

 |
市場調查報告書
商品編碼
2061459
智慧家庭市場商機、成長要素、產業趨勢分析及2026-2035年預測Smart Home Market Opportunity, Growth Drivers, Industry Trend Analysis, and Forecast 2026 - 2035 |
||||||
2025年全球智慧家庭市場價值1,720億美元,預計2035年將以9.3%的複合年成長率成長至4,137億美元。
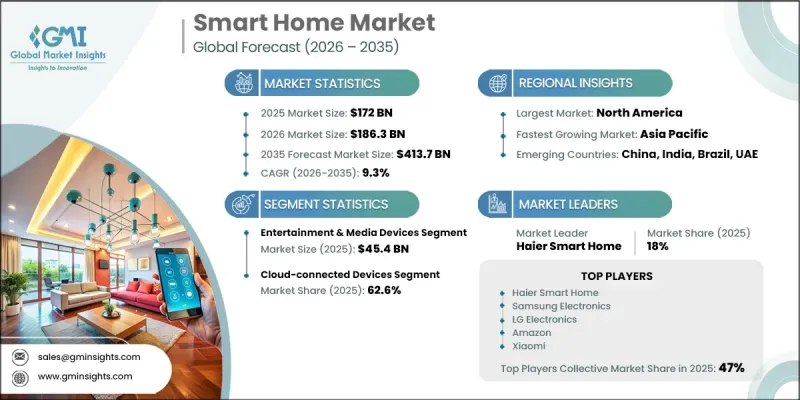
隨著消費者對整個住宅環境的便利性、安全性、自動化程度和控制能力提出更高的要求,智慧家庭產業正在迅速發展。現代家居正穩步邁向互聯生態系統,家電、照明系統、暖通空調系統、安防解決方案和娛樂平台協同運作,簡化日常生活。隨著智慧型手機、數位助理和連網技術的普及,消費者對智慧家居產品的信心顯著提升。曾經被視為奢侈品的智慧家居,如今已被視為提高能源效率、增強住宅安全和更有效率家務管理的實用投資。人工智慧、自動化和雲端運算技術的不斷進步也推動著市場的發展。不同製造商設備之間互通性的增強促進了開放生態系統和標準化通訊協定的構建,從而緩解了用戶對相容性的擔憂。因此,技術供應商、家電品牌和智慧家居公司都在不斷擴展產品系列,以滿足不斷變化的客戶期望,並支援連網生活解決方案的更廣泛應用。
| 市場範圍 | |
|---|---|
| 開始年份 | 2025 |
| 預測期 | 2026-2035 |
| 上市時的市場規模 | 1720億美元 |
| 預測金額 | 4137億美元 |
| 複合年成長率 | 9.3% |
預計到2025年,娛樂和媒體設備市場規模將達到454億美元,成為智慧家庭市場的主要類別之一。該細分市場憑藉其高消費者接受度、易於安裝和便利性,持續推動市場成長。連網娛樂產品通常是消費者邁向智慧生活環境的第一步。它們的普及性、便利性和易用性使其成為更廣泛的智慧家庭生態系統中應用最廣泛的組件之一。
到2025年,雲端連接設備市場佔有率將達到62.6%。雲端基礎設施使設備能夠通訊、同步並在統一的生態系統中運行,從而構成現代智慧家庭系統的基礎。這些系統支援即時更新、集中式自動化、遠端監控以及多個連網產品之間的無縫互通性。隨著智慧家庭設備的增多,人們對雲端平台在資料處理、通訊管理和自動化功能方面的依賴也日益成長。這種轉變已將智慧家庭從一系列獨立設備的集合轉變為能夠提供同步用戶體驗的整合式數位環境。
預計2025年,美國智慧家庭市佔率將達到89%,市場規模將達500億美元。北美地區是一個高度發展且創新驅動的環境,互聯技術已深度融入日常生活。北美消費者越來越將智慧家庭產品視為提升便利性、增強住宅安全並支持現代生活方式的實用工具。智慧型手機的高普及率、廣泛的網路連線以及人們對語音助理日益成長的熟悉度,正在推動全部區域家庭對互聯技術的採用。
目錄
第1章:調查方法
第2章執行摘要
第3章 行業洞察
- 工業生態系分析
- 價值鏈結構
- 零件製造商和供應商
- 設備製造商/OEM
- 平台和軟體供應商
- 分銷和零售業
- 安裝和整合服務
- 最終用戶/消費者群體
- 依價值鏈階段進行利潤率分析
- 價值鏈顛覆與中間環節消除的趨勢
- 影響產業的因素
- 促進因素
- 產業潛在風險與挑戰
- 機會
- 成長潛力分析
- 供應鏈分析
- 零件供應鏈的結構
- 半導體依賴和晶片短缺的影響
- 製造地
- 物流及配送網路
- 供應鏈風險及緩解措施
- 回流和近岸外包的趨勢
- 監管範圍
- 美國法規環境
- 美國聯邦通訊委員會關於無線電設備的規定
- 州級隱私法(例如 CCPA)
- 能源效率標準(能源之星)
- 歐洲法規環境
- GDPR資料保護要求
- CE標誌和產品安全指令
- 能源效率法規(歐盟生態設計)
- 無線電設備指令(RED)
- 網路安全法規
- 美國物聯網網路安全增強法案
- 歐盟網路安全法和ETSI標準
- 亞太地區的法規環境
- 中國的法規結構
- 日本的法規結構
- 印度的法規結構
- 韓國和澳洲的合規要求
- 拉丁美洲的法規環境
- 巴西的法規結構
- 墨西哥的法規結構
- 中東和非洲的法規環境
- 海灣合作理事會監管框架
- 南非和以色列的合規要求
- 關於資料主權和跨境資料傳輸的法規
- 美國法規環境
- 價格分析
- 2022-2024年歷史價格趨勢分析
- 定價策略:按業務類型分類
- 各地區價格波動
- 按通路分類的價格趨勢
- 捆綁定價與單點模式的比較
- 訂閱服務定價趨勢
- 波特的分析
- PESTLE分析
- 人工智慧和生成式人工智慧對歐洲門市場的影響
- 利用人工智慧改造現有經營模式
- 語音助理的發展(GPT 整合)
- 預測自動化與學習系統
- 電腦視覺的應用(安全、監控)
- 基於細分市場的生成式人工智慧的應用案例和部署藍圖
- 個性化智慧家庭自動化程序
- 自然語言控制介面
- 預測性維護和能源最佳化
- 智慧顯示器的內容生成
- 風險、限制和監管考量
- 對資料隱私和人工智慧模型訓練的擔憂
- 算法偏見和公平性問題
- 歐盟人工智慧法律的合規要求
- 利用人工智慧改造現有經營模式
第4章 競爭情勢
- 介紹
- 企業市佔率分析
- 北美洲
- 歐洲
- 亞太地區
- 拉丁美洲
- 中東和非洲
- 企業矩陣分析
- 主要市場公司的競爭分析
- 競爭定位矩陣
- 併購
- 夥伴關係和聯盟
- 新產品發布
- 擴張計劃
第5章:智慧家庭市場,按類型分類的估算與預測
- 安全存取控制系統
- 監視器
- 室內攝影機
- 室外攝影機
- 門鈴攝影機
- 智慧鎖
- 小鍵盤鎖
- 生物識別鎖
- 售後智慧鎖套件
- 視訊門鈴/對講機
- 遠端監控軟體服務
- 警報系統和感測器
- 其他安全設備
- 監視器
- 照明控制系統
- 智慧照明/燈泡
- LED智慧燈泡
- 智慧燈帶
- 繼電器開關
- 壁掛式智慧開關
- 插入式智慧插座
- 人體感應器和運動感應器
- 調光控制器
- 其他照明控制產品
- 智慧照明/燈泡
- 暖通空調和能源管理系統
- 智慧型恆溫器
- 學習型恆溫器
- 可程式溫控器
- 暖通空調感知器(溫度、濕度、空氣品質)
- 智慧通風口和風門
- 能源監控系統
- 智慧電錶
- 太陽能板控制器和逆變器
- 電池儲能系統
- 其他暖通空調能源相關產品
- 娛樂和媒體設備
- 智慧顯示器/電視
- 串流媒體設備(Roku、Fire TV、Apple TV)
- 條形音箱
- 智慧音箱(Alexa、Google Home、HomePod)
- 多房間音響系統
- 其他娛樂設備
- 智慧廚房電器
- 智慧冷藏庫
- 智慧洗碗機
- 智慧爐灶和爐台
- 智慧型微波爐
- 智慧咖啡機
- 其他廚房電器
- 智慧家庭設備
- 智慧洗衣機和烘乾機
- 智慧型熱水器
- 智慧吸塵器
- 智慧空氣清淨機和風扇
- 其他家用電器
- 居家醫療設備
- 遠端患者監護系統
- 跌倒偵測和通知系統
- 環保生活解決方案
- 智慧床配備健康感測器
- 睡眠監測系統
- 藥物管理裝置
- 其他醫療設備
- 其他智慧家庭設備
- 智慧家具(醫療保健產業除外)
- 智慧鏡
- 智慧寵物護理設備
- 智慧草坪和花園設備
- 其他連網產品
第6章:智慧家庭市場規模估算與預測:以連結方式分類
- 雲端連線裝置
- 支援 Wi-Fi 的設備
- 相容於蜂窩/LTE的設備
- 對雲端平台的依賴與風險
- 本地網狀網路相容設備
- 相容於 Zigbee 協定的設備
- 相容於 Z-Wave 協定的設備
- 相容於 Thread 協定的設備
- 中心需求和架構
- 近距離設備
- 藍牙裝置
- 低功耗藍牙 (BLE) 設備
- 支援NFC功能的設備
- 有線協定相容設備
- 乙太網路連接的設備
- KNX系統
- 電力線路通訊(PLC)
- Matter統一標準相容設備
第7章 智慧家庭市場估價與預測:依價格範圍分類
- 價格低廉(每台低於100美元)
- 中價位(每台100-500美元)
- 高價位(每台超過500美元)
第8章:智慧家庭市場,按應用領域分類的估算與預測
- 新建工程
- 維修
第9章:智慧家庭市場:按地區分類的估算與預測
- 北美洲
- 美國
- 加拿大
- 歐洲
- 德國
- 英國
- 法國
- 義大利
- 西班牙
- 亞太地區
- 中國
- 印度
- 日本
- 韓國
- 澳洲
- 拉丁美洲
- 巴西
- 墨西哥
- 中東和非洲
- 阿拉伯聯合大公國
- 沙烏地阿拉伯
- 南非
第10章:公司簡介
- 世界公司
- Amazon
- Apple
- Samsung
- LG Electronics
- Haier Smart Home
- Panasonic
- 當地公司
- Xiaomi
- Alibaba(Tmall Genie)
- Legrand
- Schneider Electric
- Robert Bosch
- Crestron Electronics
- Somfy
- Niche/Specialist Players
- Signify(Philips Hue)
- Assa Abloy(Yale/August)
- Honeywell International
- Lutron Electronics
- TP-Link(Kasa Smart)
- Aqara(Lumi United)
The Global Smart Home Market was valued at USD 172 billion in 2025 and is estimated to grow at a CAGR of 9.3% to reach USD 413.7 billion by 2035.
The smart home industry is rapidly transforming as consumers increasingly seek greater convenience, security, automation, and control across residential environments. Modern households are steadily shifting toward connected ecosystems where appliances, lighting systems, climate control, security solutions, and entertainment platforms operate together to simplify everyday living. Growing familiarity with smartphones, digital assistants, and connected technologies has significantly improved consumer confidence in adopting smart home products. What was once viewed as a luxury is now considered a practical investment for improving energy efficiency, strengthening home safety, and streamlining household management. The market is also evolving through continuous advancements in artificial intelligence, automation, and cloud computing technologies. Rising interoperability among devices from different manufacturers is encouraging the development of open ecosystems and standardized communication protocols, helping reduce compatibility concerns for users. As a result, technology providers, consumer electronics brands, and home automation companies are continuously expanding product portfolios to meet changing customer expectations and support broader adoption of connected living solutions.
| Market Scope | |
|---|---|
| Start Year | 2025 |
| Forecast Year | 2026-2035 |
| Start Value | $172 Billion |
| Forecast Value | $413.7 Billion |
| CAGR | 9.3% |
In 2025, the entertainment and media devices segment generated USD 45.4 billion, making it the leading category within the smart home market. This segment continues to dominate due to its high consumer adoption, ease of installation, and immediate usability benefits. Connected entertainment products often serve as the first point of entry for consumers transitioning toward smart living environments. Their accessibility, convenience, and familiarity have helped establish them as one of the most widely adopted components of the broader smart home ecosystem.
The cloud-connected devices segment accounted for 62.6% share in 2025. Cloud-enabled infrastructure has become the foundation of modern smart home systems by allowing devices to communicate, synchronize, and operate as part of a unified ecosystem. These systems support real-time updates, centralized automation, remote monitoring, and seamless interoperability between multiple connected products. The increasing number of smart devices within households continues to accelerate reliance on cloud platforms for data processing, communication management, and automated functionality. This transition has transformed smart homes from collections of independent devices into integrated digital environments capable of delivering synchronized user experiences.
U.S. Smart Home Market held an 89% share and generated USD 50 billion in 2025. The region represents a highly developed and innovation-focused environment where connected technologies are already deeply integrated into daily routines. Consumers across North America increasingly view smart home products as practical tools that enhance convenience, improve home security, and support modern lifestyles. Strong smartphone penetration, widespread internet connectivity, and growing familiarity with voice-controlled assistants continue to encourage household adoption of connected technologies throughout the region.
Major companies operating in the Smart Home Market include Amazon, Apple, Google, Samsung, LG Electronics, Haier Smart Home, Panasonic, Xiaomi, Alibaba (Tmall Genie), Legrand, Schneider Electric, Robert Bosch, Crestron Electronics, Somfy, Signify (Philips Hue), Assa Abloy (Yale/August), Honeywell International, Lutron Electronics, TP-Link (Kasa Smart), and Aqara (Lumi United). Companies operating in the smart home market are focusing on multiple growth strategies to strengthen their market position and expand consumer reach. Leading players are investing heavily in artificial intelligence, cloud computing, and IoT integration to improve device interoperability and deliver seamless user experiences across connected ecosystems. Many manufacturers are introducing products compatible with open communication standards to reduce compatibility challenges and encourage wider adoption. Strategic collaborations with technology providers, telecom companies, and homebuilders are also helping brands increase product visibility and distribution channels. In addition, companies are prioritizing energy-efficient solutions, voice-enabled controls, and enhanced cybersecurity features to meet evolving consumer expectations.
Table of Contents
Chapter 1 Research Methodology
- 1.1 Research approach
- 1.2 Quality Commitments
- 1.2.1 GMI AI policy & data integrity commitment
- 1.2.1.1 Source consistency protocol
- 1.2.1 GMI AI policy & data integrity commitment
- 1.3 Research Trail & Confidence Scoring
- 1.3.1 Research Trail Components
- 1.3.2 Scoring Components
- 1.4 Data Collection
- 1.4.1 Partial list of primary sources
- 1.5 Data mining sources
- 1.5.1 Paid sources
- 1.5.1.1 Sources, by region
- 1.5.1 Paid sources
- 1.6 Base estimates and calculations
- 1.6.1 Base year calculation for any one approach
- 1.7 Forecast model
- 1.7.1 Quantified market impact analysis
- 1.7.1.1 Mathematical impact of growth parameters on forecast
- 1.7.1 Quantified market impact analysis
- 1.8 Research transparency addendum
- 1.8.1 Source attribution framework
- 1.8.2 Quality assurance metrics
- 1.8.3 Our commitment to trust
Chapter 2 Executive Summary
- 2.1 Industry 360°synopsis
- 2.2 Key trends
- 2.3 Type
- 2.4 Connectivity
- 2.5 Price Range
- 2.6 End Use
Chapter 3 Industry Insights
- 3.1 Industry ecosystem analysis
- 3.1.1 Value chain structure
- 3.1.2 Component manufacturers & suppliers
- 3.1.3 Device manufacturers/OEMs
- 3.1.4 Platform & software providers
- 3.1.5 Distribution & retail layer
- 3.1.6 Installation & integration services
- 3.1.7 End-user/consumer layer
- 3.1.8 Profit margin analysis by value chain stage
- 3.1.9 Value chain disruptions & disintermediation trends
- 3.2 Industry impact forces
- 3.2.1 Growth drivers
- 3.2.2 Industry pitfalls & challenges
- 3.2.3 Opportunities
- 3.3 Growth potential analysis
- 3.4 Supply chain analysis
- 3.4.1 Component supply chain structure
- 3.4.2 Semiconductor dependency & chip shortage impact
- 3.4.3 Manufacturing footprint
- 3.4.4 Logistics & distribution networks
- 3.4.5 Supply chain risks & mitigation strategies
- 3.4.6 Reshoring & nearshoring trends
- 3.5 Regulation Coverage
- 3.5.1 U.S. regulatory environment
- 3.5.1.1 FCC wireless device regulations
- 3.5.1.2 State-level privacy laws (CCPA, etc.)
- 3.5.1.3 Energy efficiency standards (Energy Star)
- 3.5.2 European regulatory environment
- 3.5.2.1 GDPR data protection requirements
- 3.5.2.2 CE marking & product safety directives
- 3.5.2.3 Energy efficiency regulations (EU Ecodesign)
- 3.5.2.4 Radio Equipment Directive (RED)
- 3.5.3 Cybersecurity regulations
- 3.5.3.1 U.S. IoT cybersecurity improvement act
- 3.5.3.2 EU cybersecurity act & ETSI standards
- 3.5.4 Asia Pacific regulatory environment
- 3.5.4.1 China regulatory framework
- 3.5.4.2 Japan regulatory framework
- 3.5.4.3 India regulatory framework
- 3.5.4.4 South Korea & Australia compliance requirements
- 3.5.5 Latin America regulatory environment
- 3.5.5.1 Brazil regulatory framework
- 3.5.5.2 Mexico regulatory framework
- 3.5.6 Middle East & Africa regulatory environment
- 3.5.6.1 GCC countries regulatory framework
- 3.5.6.2 South Africa & Israel compliance requirements
- 3.5.6.3 Data sovereignty & cross-border data transfer regulations
- 3.5.1 U.S. regulatory environment
- 3.6 Pricing analysis (driven by primary research)
- 3.6.1 Historical price trend analysis (2022-2024)
- 3.6.2 Pricing strategy by player type
- 3.6.3 Regional price variation
- 3.6.4 Channel-specific pricing dynamics
- 3.6.5 Bundle pricing vs a la carte models
- 3.6.6 Subscription service pricing trends
- 3.7 Porter’s analysis
- 3.8 PESTEL analysis
- 3.9 Impact of AI and generative AI on the European doors market
- 3.9.1 AI-driven disruption of existing business models
- 3.9.1.1 Voice assistants’ evolution (GPT integration)
- 3.9.1.2 Predictive automation & learning systems
- 3.9.1.3 Computer vision applications (security, monitoring)
- 3.9.2 GenAI use cases & adoption roadmap by segment
- 3.9.2.1 Personalized home automation routines
- 3.9.2.2 Natural language control interfaces
- 3.9.2.3 Predictive maintenance & energy optimization
- 3.9.2.4 Content generation for smart displays
- 3.9.3 Risks, limitations & regulatory considerations
- 3.9.3.1 Data privacy & AI model training concerns
- 3.9.3.2 Algorithmic bias & fairness issues
- 3.9.3.3 EU AI Act compliance requirements
- 3.9.1 AI-driven disruption of existing business models
Chapter 4 Competitive Landscape, 2025
- 4.1 Introduction
- 4.2 Company market share analysis
- 4.2.1 North America
- 4.2.2 Europe
- 4.2.3 Asia Pacific
- 4.2.4 LATAM
- 4.2.5 MEA
- 4.3 Company matrix analysis
- 4.4 Competitive analysis of major market players
- 4.5 Competitive positioning matrix
- 4.6 Key developments
- 4.6.1 Mergers & acquisitions
- 4.6.2 Partnerships & collaborations
- 4.6.3 New product launches
- 4.6.4 Expansion plan
Chapter 5 Smart Home Market Estimates & Forecast, By Type (USD Billion) (Thousand Units)
- 5.1 Key trends
- 5.2 Security & access control systems
- 5.2.1 Security cameras
- 5.2.1.1 Indoor cameras
- 5.2.1.2 Outdoor cameras
- 5.2.1.3 Doorbell cameras
- 5.2.2 Smart locks
- 5.2.2.1 Keypad locks
- 5.2.2.2 Biometric locks
- 5.2.2.3 Retrofit smart lock kits
- 5.2.3 Video door phones/intercoms
- 5.2.4 Remote monitoring software & services
- 5.2.5 Alarm systems & sensors
- 5.2.6 Other security devices
- 5.2.1 Security cameras
- 5.3 Lighting control systems
- 5.3.1 Smart lights/bulbs
- 5.3.1.1 LED smart bulbs
- 5.3.1.2 Smart light strips
- 5.3.2 Relays & switches
- 5.3.2.1 In-wall smart switches
- 5.3.2.2 Plug-in smart outlets
- 5.3.3 Occupancy sensors & motion detectors
- 5.3.4 Dimmers & controllers
- 5.3.5 Other lighting control products
- 5.3.1 Smart lights/bulbs
- 5.4 HVAC & energy management systems
- 5.4.1 Smart thermostats
- 5.4.2 Learning thermostats
- 5.4.2.1 Programmable thermostats
- 5.4.2.2 HVAC sensors (temperature, humidity, air quality)
- 5.4.3 Smart vents & dampers
- 5.4.4 Energy monitoring systems
- 5.4.5 Smart meters
- 5.4.6 Solar panel controllers & inverters
- 5.4.7 Battery storage systems
- 5.4.8 Other HVAC & energy products
- 5.5 Entertainment & media devices
- 5.5.1 Smart displays/TVs
- 5.5.2 Streaming devices (Roku, Fire TV, Apple TV)
- 5.5.3 Sound bars & speakers
- 5.5.4 Smart speakers (Alexa, Google Home, HomePod)
- 5.5.5 Multi-room audio systems
- 5.5.6 Other entertainment devices
- 5.6 Smart kitchen appliances
- 5.6.1 Smart refrigerators
- 5.6.2 Smart dishwashers
- 5.6.3 Smart cooktops & ranges
- 5.6.4 Smart microwaves & ovens
- 5.6.5 Smart coffee makers
- 5.6.6 Other kitchen appliances
- 5.7 Smart home appliances
- 5.7.1 Smart washing machines & dryers
- 5.7.2 Smart water heaters
- 5.7.3 Smart vacuum cleaners
- 5.7.4 Smart air purifiers & fans
- 5.7.5 Other home appliances
- 5.8 Home healthcare devices
- 5.8.1 Remote patient monitoring systems
- 5.8.2 Fall detection & alert systems
- 5.8.3 Ambient assisted living solutions
- 5.8.4 Smart beds with health sensors
- 5.8.5 Sleep monitoring systems
- 5.8.6 Medication management devices
- 5.8.7 Other healthcare devices
- 5.9 Other smart home devices
- 5.9.1 Smart furniture (non-health)
- 5.9.2 Smart mirrors
- 5.9.3 Smart pet care devices
- 5.9.4 Smart lawn & garden equipment
- 5.9.5 Other connected products
Chapter 6 Smart Home Market Estimates & Forecast, By Connectivity (USD Billion) (Thousand Units)
- 6.1 Key trends
- 6.2 Cloud-connected devices
- 6.2.1 Wi-Fi-based devices
- 6.2.2 Cellular/LTE-based devices
- 6.2.3 Cloud platform dependencies & risks
- 6.3 Local mesh network devices
- 6.3.1 Zigbee protocol devices
- 6.3.2 Z-Wave protocol devices
- 6.3.3 Thread protocol devices
- 6.3.4 Hub requirements & architecture
- 6.4 Proximity-based devices
- 6.4.1 Bluetooth devices
- 6.4.2 Bluetooth Low Energy (BLE) devices
- 6.4.3 NFC-enabled devices
- 6.5 Wired protocol devices
- 6.5.1 Ethernet-connected devices
- 6.5.2 KNX systems
- 6.5.3 Power line communication (PLC)
- 6.6 Matter unified standard devices
Chapter 7 Smart Home Market Estimates & Forecast, By Price Range (USD Billion) (Thousand Units)
- 7.1 Key trends
- 7.2 Low (<$100 per device)
- 7.3 Medium (0-0 per device)
- 7.4 High (>$500 per device)
Chapter 8 Smart Home Market Estimates & Forecast, By End Use (USD Billion) (Thousand Units)
- 8.1 Key trends
- 8.2 New construction
- 8.3 Retrofit
Chapter 9 Smart Home Market Estimates & Forecast, By Region (USD Billion) (Thousand Units)
- 9.1 Key trends
- 9.2 North America
- 9.2.1 U.S.
- 9.2.2 Canada
- 9.3 Europe
- 9.3.1 Germany
- 9.3.2 U.K.
- 9.3.3 France
- 9.3.4 Italy
- 9.3.5 Spain
- 9.4 Asia Pacific
- 9.4.1 China
- 9.4.2 India
- 9.4.3 Japan
- 9.4.4 South Korea
- 9.4.5 Australia
- 9.5 Latin America
- 9.5.1 Brazil
- 9.5.2 Mexico
- 9.6 MEA
- 9.6.1 UAE
- 9.6.2 Saudi Arabia
- 9.6.3 South Africa
Chapter 10 Company Profiles
- 10.1 Global Players
- 10.1.1 Amazon
- 10.1.2 Apple
- 10.1.3 Google
- 10.1.4 Samsung
- 10.1.5 LG Electronics
- 10.1.6 Haier Smart Home
- 10.1.7 Panasonic
- 10.2 Regional Players
- 10.2.1 Xiaomi
- 10.2.2 Alibaba (Tmall Genie)
- 10.2.3 Legrand
- 10.2.4 Schneider Electric
- 10.2.5 Robert Bosch
- 10.2.6 Crestron Electronics
- 10.2.7 Somfy
- 10.3 Niche/Specialist Players
- 10.3.1 Signify (Philips Hue)
- 10.3.2 Assa Abloy (Yale/August)
- 10.3.3 Honeywell International
- 10.3.4 Lutron Electronics
- 10.3.5 TP-Link (Kasa Smart)
- 10.3.6 Aqara (Lumi United)
 環境生活輔助和智慧家庭市場:按組件、服務、連接方式、部署模式、動力來源、應用、分銷管道、最終用戶和部署類型分類——2026-2032年全球市場預測
 多智慧體系統平台市場(2026-2032 年):按系統類型、應用和產業分類。
 2026年全球智慧冷藏櫃支付市場報告
 環境生活輔助和智慧家庭市場規模、佔有率和成長分析:按組件、應用、最終用戶、分銷管道和地區分類-2026-2033年產業預測全球智慧家庭市場:機會與策略展望(至2035年)2026年全球低軌道(LEO)連結服務管理市場報告
 智慧生活:市場數據概覽(2026 年第二季)
 智慧家庭系統市場預測至2034年-全球分析(按組件、系統類型、連接方式、技術、應用、最終用戶和地區分類)智慧家庭市場:2026-2032年全球市場預測(按產品、使用者介面、應用、分銷管道和最終用戶分類)
 智慧家庭市場規模、佔有率、趨勢和預測:按組件、應用和地區分類,2026-2034 年