


 |
市場調查報告書
商品編碼
2061420
電動機車和踏板車市場:商業機會、成長要素、產業趨勢分析及2026-2035年預測Electric Motorcycle and Scooters Market Opportunity, Growth Drivers, Industry Trend Analysis, and Forecast 2026 - 2035 |
||||||
預計到 2025 年,全球電動機車和踏板車市場價值將達到 372 億美元,並預計以 13.7% 的複合年成長率成長,到 2035 年達到 1,299 億美元。
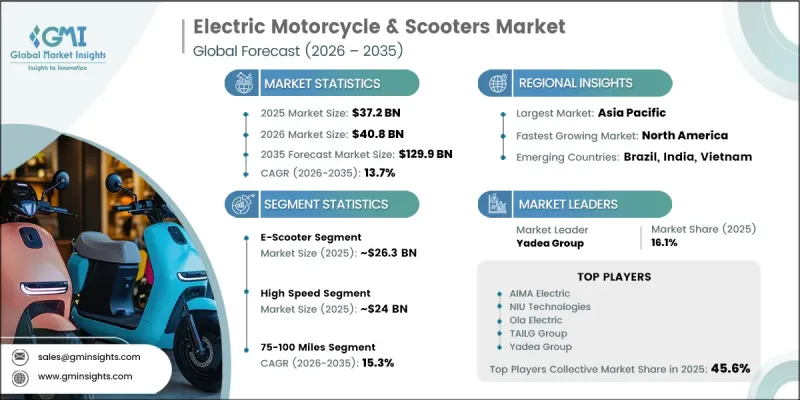
市場結構仍高度集中於亞太地區,預計2025年將佔全球市場的96.5%。同時,北美和歐洲雖然目前市場佔有率較小,但隨著充電基礎設施、經銷商網路和消費者認知度的不斷提升,其市場佔有率正在穩步成長。政策框架對市場成長有顯著影響,獎勵計畫、稅收優惠和監管准入優勢顯著降低了初始擁有成本,並加速了電動摩托車的普及。經濟因素也發揮著至關重要的作用,與內燃機汽車相比,電動摩托車的每公里運行成本更低,長期維護需求更少,使其在總擁有成本(TCO)方面具有顯著優勢。這些因素共同提升了電動摩托車在個人出行和商業車隊應用方面的吸引力,尤其是在人口密集、利用率高的城市環境中。換電模式和共用充電生態系統進一步提高了營運效率,延長了車輛的運轉率,並減少了對固定充電基礎設施的依賴。
| 市場範圍 | |
|---|---|
| 開始年份 | 2025 |
| 預測期 | 2026-2035 |
| 初始市場規模 | 372億美元 |
| 預測金額 | 1299億美元 |
| 複合年成長率 | 13.7% |
電動滑板車目前佔70.8%的市場佔有率,預計到2025年市場規模將達到263億美元。該品類憑藉其在短程都市區通勤和配送方面的親和性,持續保持主導地位。同時,電動機車正朝著更高性能的應用場景發展,例如更長的續航里程、更高的速度和更強的公路行駛能力。電池能量密度和成本效益的提升正逐步推動電動機車延長續航里程,增強其相對於傳統交通工具的競爭力。
預計2025年,高速電動摩托車市佔率將達到64.4%,市場規模將達240億美元。隨著技術進步提升了加速性能、耐用性和整體性能,高速電動摩托車的發展動能日益強勁。這些車輛越來越能滿足高速公路行駛的需求,使其成為日常通勤和長途旅行中內燃機摩托車的理想替代品。
美國電動機車和踏板車市場預計到2025年將達到1.047億美元,並在2026年至2035年間以15.6%的複合年成長率成長。美國約佔區域市場價值的83%,這得益於大都會圈早期對科技的採用以及消費者的強勁需求。人口密度高、環保意識強且擁有大量科技型消費者的都市區將繼續推動電動摩托車和踏板車的普及,並支撐市場穩步擴張。
目錄
第1章:調查方法
第2章執行摘要
第3章 行業洞察
- 產業生態系分析
- 供應商情況
- 利潤率
- 成本結構
- 每個階段增加的價值
- 影響價值鏈的因素
- 中斷
- 影響產業的因素
- 促進因素
- 嚴格的排放法規和應對氣候變遷的努力
- 燃油價格上漲及總擁有成本 (TCO) 的益處
- 政府獎勵措施、補貼和稅收減免
- 電池技術的進步和成本的降低
- 產業潛在風險與挑戰
- 高額的初始購置成本與內燃機(ICE)的替代方案比較
- 充電基礎設施不足以及對續航里程的擔憂
- 市場機遇
- 物流和配送領域的車輛電氣化
- 電池更換經營模式與基礎設施策略
- 低成本製造地帶來的出口機會
- 促進因素
- 技術與創新展望
- 最新科技趨勢
- 鋰離子電池系統(NMC/LFP)
- 無刷直流輪轂式馬達
- 新興技術
- 全固態電池
- 可更換電池生態系統
- 非接觸式感應式充電
- 最新科技趨勢
- 成長潛力分析
- 價格分析
- 對過去價格趨勢的分析
- 依球員類型分類的定價策略(高級球員、超值球員、成本加成球員)
- 監理情勢
- 北美洲
- 美國環保署(EPA)
- 美國 - 國家公路交通安全管理局 (NHTSA)
- 加拿大 - 加拿大運輸部
- 歐洲
- 歐盟 - 歐盟委員會(交通運輸/綠色新政框架)
- 德國 - 聯邦機動車輛管理局 (KBA)
- 亞太地區
- 中國 - 工業及資訊化部(工信部)
- 印度 - 公路運輸與公路部 (MoRTH)
- LATAM
- 巴西 - CONTRAN
- 巴西 - 國家交通管理局 (SENATRAN)
- 中東和非洲
- 沙烏地阿拉伯 - SASO
- 阿拉伯聯合大公國 - 工業和先進技術部 (MoIAT)
- 北美洲
- 波特的分析
- PESTLE分析
- 貿易數據分析
- 進出口量及進口額趨勢
- 主要貿易路線及關稅的影響
- 生產能力和生產情況
- 設備產能:按地區和主要生產商分類
- 運轉率和擴張計劃
- 成本細分分析
- 電池組成本
- 電動動力傳動系統的成本
- 底盤和機械部件的成本
- 電子元件成本
- 製造和組裝成本
- 專利分析
- 永續性和環境方面
- 永續計劃
- 減少廢棄物策略
- 生產中的能源效率
- 具有環保意識的舉措
- 考慮碳足跡
- 人工智慧和生成式人工智慧對市場的影響
- 利用人工智慧改造現有經營模式
- 按細分市場分類的生成式人工智慧用例和部署藍圖
- 風險、限制和監管考量
- 充電基礎設施準備狀況
- 公共充電站的密度和地理覆蓋範圍
- 充電標準和相容性問題
- 快速充電和家用充電的經濟效益
- 電池更換網路的部署
- 基礎建設投資缺口與未來藍圖
- 預測假設和情境分析
- 基本案例:驅動複合年成長率的關鍵宏觀經濟與產業變量
- 樂觀情境:宏觀經濟與產業的順風
- 悲觀情景:宏觀經濟放緩或產業逆風
第4章 競爭情勢
- 介紹
- 企業市佔率分析
- 北美洲
- 歐洲
- 亞太地區
- LATAM
- 中東和非洲
- 主要市場公司的競爭分析
- 競爭定位矩陣
- 主要進展
- 併購
- 夥伴關係和聯盟
- 新產品發布
- 業務拓展計劃及資金籌措
- 按公司規模進行基準測試
- 排名分類標準與遴選標準
- 按銷售額、地區和創新能力分類的層級定位矩陣。
第5章 市場估價與預測:依車輛類型分類,2022-2035年
- 電動機車
- 越野摩托車
- 運動摩托車
- 普通摩托車
- 巡洋艦
- 巡迴
- 街頭/裸體
- 探險/雙用途
- 通勤者
- 電動滑板車
- 折疊式滑板車
- 三輪踏板車
- 傳統踏板車
- 輕型機踏車
第6章 市場估計與預測:依速度分類,2022-2035年
- 慢速
- 高速
第7章 市場估計與預測:依範圍分類,2022-2035年
- 不到75英里
- 75-100英里
- 超過100英里
第8章 市場估計與預測:依電池類型分類,2022-2035年
- 鉛酸電池
- 鋰離子
- 磷酸鋰鐵(LFP)
- 鎳錳鈷(NMC)
第9章 市場估計與預測:依產量分類,2022-2035年
- 小於3千瓦
- 3~10 kW
- 超過10千瓦
第10章 市場估價與預測:依電壓分類,2022-2035年
- 36V
- 48V
- 60V
- 72V
- 其他
第11章 市場估計與預測:依最終用途分類,2022-2035年
- 私人/個人
- 商業
- 物流/配送
- 共享出行/共乘
- 執法機關和地方政府服務
第12章 市場估算與預測:依銷售管道分類,2022-2035年
- 線上
- 離線
第13章 市場估計與預測:依地區分類,2022-2035年
- 北美洲
- 美國
- 加拿大
- 歐洲
- 德國
- 英國
- 法國
- 義大利
- 西班牙
- 荷蘭
- 挪威
- 瑞典
- 比利時
- 亞太地區
- 中國
- 印度
- 日本
- 韓國
- 越南
- 印尼
- 泰國
- 菲律賓
- 拉丁美洲
- 巴西
- 墨西哥
- 阿根廷
- 哥倫比亞
- 中東和非洲
- 南非
- 沙烏地阿拉伯
- UAE
第14章:公司簡介
- 世界公司
- Yadea Group
- NIU Technologies
- Hero MotoCorp
- Ola Electric
- TAILG Group
- Gogoro
- TVS Motor
- Yamaha Motor
- Zero Motorcycles
- Ather Energy
- AIMA Electric
- Honda
- 當地公司
- Bajaj Auto
- TORROT Electric
- Oben Electric
- Maeving
- Mohenic Motors
- Savic Motorcycles
- 新興企業
- Matter Motors
- Ryvid
The Global Electric Motorcycle &Scooters Market was valued at USD 37.2 billion in 2025 and is estimated to grow at a CAGR of 13.7% to reach USD 129.9 billion by 2035.
The market structure remains heavily concentrated in Asia Pacific, which accounted for 96.5% of total value in 2025, while North America and Europe currently represent smaller shares but are steadily expanding as charging infrastructure, dealership networks, and consumer awareness continue to improve. Market growth is strongly influenced by policy frameworks, where incentive schemes, tax benefits, and regulatory access advantages significantly lower upfront ownership costs and accelerate adoption rates. Economic fundamentals also play a central role, as lower per-kilometer operating costs compared to internal combustion vehicles and reduced long-term maintenance requirements strengthen the total cost of ownership advantage. These combined factors are increasing the attractiveness of electric two-wheelers for both personal mobility and commercial fleet applications, particularly in dense urban environments where utilization rates are high. Battery swapping models and shared charging ecosystems are further improving operational efficiency, enabling higher uptime and reducing dependency on fixed charging infrastructure.
| Market Scope | |
|---|---|
| Start Year | 2025 |
| Forecast Year | 2026-2035 |
| Start Value | $37.2 Billion |
| Forecast Value | $129.9 Billion |
| CAGR | 13.7% |
The e-scooter segment held a 70.8% share, generating USD 26.3 billion in 2025. This category continues to lead due to its strong alignment with short-distance urban commuting and delivery applications. Electric motorcycles, on the other hand, are increasingly positioned toward higher performance use cases where extended range, higher speed capability, and highway suitability are essential. Growing improvements in battery density and cost efficiency are gradually enabling electric motorcycles to achieve longer travel ranges, making them more competitive with conventional alternatives.
The high-speed segment accounted for 64.4% share in 2025, valued at USD 24 billion. High-speed electric two-wheelers are gaining momentum as technological improvements enhance acceleration, endurance, and overall riding performance. These vehicles are increasingly meeting highway-grade requirements, making them viable substitutes for internal combustion engine models used in daily commuting and long-distance travel.
U.S. Electric Motorcycle and Scooters Market reached USD 104.7 million in 2025 and is expected to grow at a CAGR of 15.6% from 2026 to 2035. The country represents approximately 83% of the regional market value, supported by early technology adoption and strong consumer interest in metropolitan areas. Urban centers characterized by dense populations, environmental awareness, and tech-oriented consumers continue to drive adoption, reinforcing steady market expansion.
Key players operating in the Global Electric Motorcycle &Scooters Industry include Yadea Group, TVS Motor, Hero MotoCorp, NIU Technologies, Gogoro, Ola Electric, AIMA Electric, Luyuan Electric, TAILG Group, and Zero Motorcycles. Companies in the electric motorcycle & scooters market are focusing heavily on battery innovation and cost optimization to improve driving range and reduce vehicle prices. They are expanding battery swapping and charging infrastructure partnerships to enhance convenience and increase adoption speed in urban areas. Strategic collaboration with energy providers, mobility platforms, and logistics operators is strengthening fleet deployment opportunities. Manufacturers are also investing in lightweight materials and advanced powertrain systems to improve vehicle efficiency and performance. In addition, digital integration through connected vehicle platforms, app-based fleet management, and predictive maintenance solutions is enhancing user experience. Expansion into emerging markets, coupled with localized production strategies and aggressive dealership growth, is further helping companies strengthen competitive positioning and capture long-term demand growth in both personal and commercial mobility segments.
Table of Contents
Chapter 1 Methodology
- 1.1 Research approach
- 1.2 Quality Commitments
- 1.2.1 GMI AI policy & data integrity commitment
- 1.3 Research Trail & Confidence Scoring
- 1.3.1 Research Trail Components
- 1.3.2 Scoring Components
- 1.4 Data Collection
- 1.5 Data mining sources
- 1.5.1 Paid sources
- 1.6 Base estimates and calculations
- 1.6.1 Base year calculation
- 1.7 Forecast model
- 1.7.1 Quantified market impact analysis
- 1.8 Research transparency addendum
- 1.8.1 Source attribution framework
- 1.8.2 Quality assurance metrics
- 1.8.3 Our commitment to trust
Chapter 2 Executive Summary
- 2.1 Industry 360° synopsis
- 2.2 Key market trends
- 2.2.1 Regional
- 2.2.2 Vehicle
- 2.2.3 Speed
- 2.2.4 Range
- 2.2.5 Battery
- 2.2.6 Power Output
- 2.2.7 Voltage
- 2.2.8 End-Use
- 2.2.9 Sales Channel
- 2.3 TAM analysis, 2026-2035
- 2.4 CXO perspectives: Strategic imperatives
Chapter 3 Industry Insights
- 3.1 Industry ecosystem analysis
- 3.1.1 Supplier landscape
- 3.1.2 Profit margin
- 3.1.3 Cost structure
- 3.1.4 Value addition at each stage
- 3.1.5 Factor affecting the value chain
- 3.1.6 Disruptions
- 3.2 Industry impact forces
- 3.2.1 Growth drivers
- 3.2.1.1 Stringent Emission Regulations & Climate Action Commitments
- 3.2.1.2 Rising Fuel Prices & Total Cost of Ownership Benefits
- 3.2.1.3 Government Incentives, Subsidies & Tax Benefits
- 3.2.1.4 Advancement in Battery Technology & Declining Battery Costs
- 3.2.2 Industry pitfalls and challenges
- 3.2.2.1 High Upfront Purchase Cost vs ICE Alternatives
- 3.2.2.2 Limited Charging Infrastructure & Range Anxiety
- 3.2.3 Market opportunities
- 3.2.3.1 Fleet Electrification in Logistics & Delivery Sectors
- 3.2.3.2 Battery Swapping Business Models & Infrastructure Plays
- 3.2.3.3 Export Opportunities from Low-Cost Manufacturing Hubs
- 3.2.1 Growth drivers
- 3.3 Technology and innovation landscape
- 3.3.1 Current technological trends
- 3.3.1.1 Lithium-ion Battery Systems (NMC / LFP)
- 3.3.1.2 BLDC (Brushless DC) Hub Motors
- 3.3.2 Emerging technologies
- 3.3.2.1 Solid-State Batteries
- 3.3.2.2 Swappable Battery Ecosystems
- 3.3.2.3 Wireless Inductive Charging
- 3.3.1 Current technological trends
- 3.4 Growth potential analysis
- 3.5 Pricing Analysis (Driven by Primary Research)
- 3.5.1 Historical Price Trend Analysis
- 3.5.2 Pricing Strategy by Player Type (Premium / Value / Cost-plus)
- 3.6 Regulatory landscape
- 3.6.1 North America
- 3.6.1.1 US - Environmental Protection Agency (EPA)
- 3.6.1.2 US - National Highway Traffic Safety Administration (NHTSA)
- 3.6.1.3 Canada - Transport Canada
- 3.6.2 Europe
- 3.6.2.1 EU - European Commission (Mobility and Transport/Green Deal framework)
- 3.6.2.2 Germany - Kraftfahrt-Bundesamt (KBA)
- 3.6.3 Asia Pacific
- 3.6.3.1 China - Ministry of Industry and Information Technology (MIIT)
- 3.6.3.2 India - Ministry of Road Transport and Highways (MoRTH)
- 3.6.4 LATAM
- 3.6.4.1 Brazil - CONTRAN
- 3.6.4.2 Brazil - Secretaria Nacional de Transito (SENATRAN)
- 3.6.5 MEA
- 3.6.5.1 Saudi Arabia - SASO
- 3.6.5.2 UAE - Ministry of Industry and Advanced Technology (MoIAT)
- 3.6.1 North America
- 3.7 Porter's analysis
- 3.8 PESTEL analysis
- 3.9 Trade Data Analysis (Driven by Paid Database)
- 3.9.1 Import/Export Volume & Value Trends
- 3.9.2 Key Trade Corridors & Tariff Impact
- 3.10 Capacity & Production Landscape (Driven by Primary Research)
- 3.10.1 Installed Capacity by Region & Key Producer
- 3.10.2 Capacity Utilization Rates & Expansion Pipelines
- 3.11 Cost breakdown analysis
- 3.11.1 Battery Pack Cost
- 3.11.2 Electric Powertrain Cost
- 3.11.3 Chassis & Mechanical Components Cost
- 3.11.4 Electronics Cost
- 3.11.5 Manufacturing & Assembly Cost
- 3.12 Patent analysis (Driven by Primary Research)
- 3.13 Sustainability and environmental aspects
- 3.13.1 Sustainable Practices
- 3.13.2 Waste Reduction Strategies
- 3.13.3 Energy Efficiency in Production
- 3.13.4 Eco-friendly Initiatives
- 3.13.5 Carbon Footprint Considerations
- 3.14 Impact of AI & generative AI on the market
- 3.14.1 AI-driven disruption of existing business models
- 3.14.2 GenAI use cases & adoption roadmap by segment
- 3.14.3 Risks, limitations & regulatory considerations
- 3.15 Charging infrastructure readiness
- 3.15.1 Public charging station density & geographic coverage
- 3.15.2 Charging standards & compatibility issues
- 3.15.3 Fast charging vs home charging economics
- 3.15.4 Battery swapping network development
- 3.15.5 Infrastructure investment gaps & future roadmap
- 3.16 Forecast assumptions & scenario analysis (Driven by Primary Research)
- 3.16.1 Base Case- Key Macro & Industry Variables Driving CAGR
- 3.16.2 Optimistic Scenarios- Favorable macro and industry tailwinds
- 3.16.3 Pessimistic Scenario - Macroeconomic slowdown or industry headwinds
Chapter 4 Competitive Landscape, 2025
- 4.1 Introduction
- 4.2 Company market share analysis
- 4.2.1 North America
- 4.2.2 Europe
- 4.2.3 Asia Pacific
- 4.2.4 LATAM
- 4.2.5 MEA
- 4.3 Competitive analysis of major market players
- 4.4 Competitive positioning matrix
- 4.5 Key developments
- 4.5.1 Mergers & acquisitions
- 4.5.2 Partnerships & collaborations
- 4.5.3 New product launches
- 4.5.4 Expansion plans and funding
- 4.6 Company tier benchmarking
- 4.6.1 Tier classification criteria & qualifying thresholds
- 4.6.2 Tier positioning matrix by revenue, geography & innovation
Chapter 5 Market Estimates and Forecast, By Vehicle, 2022 - 2035 ($ Mn, Units)
- 5.1 Key trends
- 5.2 E-Motorcycle
- 5.2.1 Dirt Bikes
- 5.2.2 Sports Motorcycles
- 5.2.3 Standard Motorcycles
- 5.2.3.1 Cruiser
- 5.2.3.2 Touring
- 5.2.3.3 Street/Naked
- 5.2.3.4 Adventure/Dual-Sport
- 5.2.3.5 Commuter
- 5.3 E-Scooter
- 5.3.1 Folding Scooters
- 5.3.2 Three-Wheeled Scooters
- 5.3.3 Standard Scooters
- 5.3.4 Mopeds
Chapter 6 Market Estimates and Forecast, By Speed, 2022 - 2035 ($ Mn, Units)
- 6.1 Key trends
- 6.2 Low Speed
- 6.3 High Speed
Chapter 7 Market Estimates and Forecast, By Range, 2022 - 2035 ($ Mn, Units)
- 7.1 Key trends
- 7.2 Below 75 Miles
- 7.3 75-100 Miles
- 7.4 Above 100 Miles
Chapter 8 Market Estimates and Forecast, By Battery, 2022 - 2035 ($ Mn, Units)
- 8.1 Key trends
- 8.2 Lead Acid
- 8.3 Lithium-ion
- 8.3.1 Lithium Iron Phosphate (LFP)
- 8.3.2 Nickel Manganese Cobalt (NMC)
Chapter 9 Market Estimates and Forecast, By Power Output, 2022 - 2035 ($ Mn, Units)
- 9.1 Key trends
- 9.2 Below 3 kW
- 9.3 3-10 kW
- 9.4 Above 10 kW
Chapter 10 Market Estimates and Forecast, By Voltage, 2022 - 2035 ($ Mn, Units)
- 10.1 Key trends
- 10.2 36V
- 10.3 48V
- 10.4 60V
- 10.5 72V
- 10.6 Others
Chapter 11 Market Estimates and Forecast, By End-Use, 2022 - 2035 ($ Mn, Units)
- 11.1 Key trends
- 11.2 Private/Individual
- 11.3 Commercial
- 11.3.1 Logistics & Delivery
- 11.3.2 Shared Mobility/Ride-sharing
- 11.3.3 Law Enforcement & Municipal Services
Chapter 12 Market Estimates and Forecast, By Sales Channel, 2022 - 2035 ($ Mn, Units)
- 12.1 Key trends
- 12.2 Online
- 12.3 Offline
Chapter 13 Market Estimates & Forecast, By Region, 2022 - 2035 ($Mn, Units)
- 13.1 Key trends
- 13.2 North America
- 13.2.1 US
- 13.2.2 Canada
- 13.3 Europe
- 13.3.1 Germany
- 13.3.2 UK
- 13.3.3 France
- 13.3.4 Italy
- 13.3.5 Spain
- 13.3.6 Netherlands
- 13.3.7 Norway
- 13.3.8 Sweden
- 13.3.9 Belgium
- 13.4 Asia Pacific
- 13.4.1 China
- 13.4.2 India
- 13.4.3 Japan
- 13.4.4 South Korea
- 13.4.5 Vietnam
- 13.4.6 Indonesia
- 13.4.7 Thailand
- 13.4.8 Philippines
- 13.5 Latin America
- 13.5.1 Brazil
- 13.5.2 Mexico
- 13.5.3 Argentina
- 13.5.4 Colombia
- 13.6 MEA
- 13.6.1 South Africa
- 13.6.2 Saudi Arabia
- 13.6.3 UAE
Chapter 14 Company Profiles
- 14.1 Global players
- 14.1.1 Yadea Group
- 14.1.2 NIU Technologies
- 14.1.3 Hero MotoCorp
- 14.1.4 Ola Electric
- 14.1.5 TAILG Group
- 14.1.6 Gogoro
- 14.1.7 TVS Motor
- 14.1.8 Yamaha Motor
- 14.1.9 Zero Motorcycles
- 14.1.10 Ather Energy
- 14.1.11 AIMA Electric
- 14.1.12 Honda
- 14.2 Regional players
- 14.2.1 Bajaj Auto
- 14.2.2 TORROT Electric
- 14.2.3 Oben Electric
- 14.2.4 Maeving
- 14.2.5 Mohenic Motors
- 14.2.6 Savic Motorcycles
- 14.3 Emerging players
- 14.3.1 Matter Motors
- 14.3.2 Ryvid
 電動滑板車和電動機車市場:2026-2032年全球市場預測(按車輛類型、電池類型、馬達類型、功率輸出、單次充電續航里程、最終用戶和分銷管道分類)電動滑板車市場:2026-2032年全球市場預測(依產品類型、電池類型、電池容量、馬達輸出功率、煞車系統、銷售管道和應用分類)
 小型電動滑板車市場分析與至2035年的預測:類型、產品、服務、技術、組件、應用、部署模式、最終用戶、功能、安裝類型電動滑板車市場分析及預測(至2035年):依類型、產品、服務、技術、組件、應用、部署、最終用戶及模式分類
 2026-2030年全球高性能電動機車市場
 全球電動滑板車共享市場規模、佔有率、趨勢和成長分析報告(2026-2034)
 高階電動機車市場機會、成長要素、產業趨勢分析及2026-2035年預測。
 電動滑板車共享市場規模、佔有率和成長分析:按服務類型、所有權模式、應用、最終用戶、分銷管道和地區分類-2026-2033年產業預測
 獨輪電動滑板車市場規模、佔有率和成長分析:按產品類型、消費者群體、使用情境、價格範圍和地區分類-2026-2033年產業預測電動滑板車共享市場分析與預測(至2035年):類型、產品類型、服務、技術、組件、應用、部署狀態、最終用戶、解決方案