

 |
市場調查報告書
商品編碼
2045871
2026 年至 2035 年糖醇甜味劑市場的商業機會、成長要素、產業趨勢與預測。Polyol Sweeteners Market Opportunity, Growth Drivers, Industry Trend Analysis, and Forecast 2026 - 2035 |
||||||
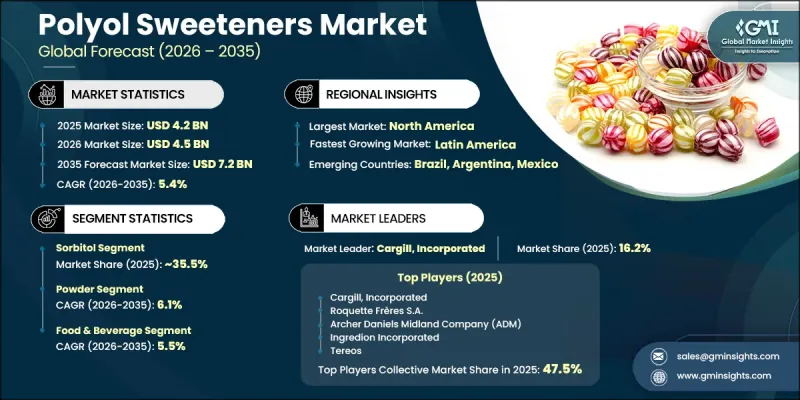
2025年全球糖醇甜味劑市值為42億美元,預計2035年將以5.4%的複合年成長率成長至72億美元。
在健康意識不斷增強和飲食偏好不斷變化的影響下,隨著消費者日益轉向低熱量取代傳統醣類,糖醇產業正穩步發展。糖醇類甜味劑憑藉其多功能性,在食品飲料、個人護理、醫藥和工業等眾多領域中發揮著至關重要的作用。它們有助於體重管理、血糖值控制和口腔健康,進一步鞏固了其在現代產品配方中的地位。消費者對潔淨標示和天然成分的需求不斷成長,加上消費者期望的改變和監管機構對更健康消費模式的關注,進一步加速了糖醇類甜味劑的普及。快速的都市化和飲食習慣的改變導致加工食品消費量增加,多元醇在低熱量配方中扮演關鍵角色。多元醇具有保水性、產品穩定性和延長保存期限等功能優勢,使其非常適合各種應用。配方技術和產品開發的持續創新使製造商能夠提供量身定做的營養解決方案,進一步推動市場擴張。
| 市場範圍 | |
|---|---|
| 開始年份 | 2025 |
| 預測期 | 2026-2035 |
| 上市時的市場規模 | 42億美元 |
| 預測市場規模 | 72億美元 |
| 複合年成長率 | 5.4% |
預計到2025年,山梨糖醇市佔率將達到35.5%,並在2035年之前以5.6%的複合年成長率成長。其用途廣泛,應用於眾多產業。山梨糖醇具有適中的甜度,同時也能起到穩定劑和保濕劑的作用,因此適用於各種產品配方。
預計到2025年,粉狀產品將佔據62%的市場佔有率,並在2026年至2035年間以6.1%的複合年成長率成長。粉狀產品因其易於儲存、操作高效且與自動化生產系統相容而備受青睞。加工技術的進步進一步提升了產品的一致性和質量,從而推動了該細分市場的持續成長及其在廣泛應用領域的普及。
預計到2025年,北美糖醇甜味劑市佔率將達到40.5%,這主要得益於消費者健康意識的增強以及對低糖產品需求的成長。該地區擁有成熟的食品飲料產業,主要生產商也持續進行創新,這些都為北美市場的發展提供了有利條件。此外,消費者對機能性食品和潔淨標示產品的興趣日益濃厚,也進一步推動了全部區域市場的成長。
目錄
第1章:調查方法和範圍
第2章執行摘要
第3章 行業洞察
- 產業生態系分析
- 供應商情況
- 利潤率
- 每個階段增加的價值
- 影響價值鏈的因素
- 中斷
- 影響產業的因素
- 促進因素
- 產業潛在風險與挑戰
- 市場機遇
- 成長潛力分析
- 監理情勢
- 北美洲
- 歐洲
- 亞太地區
- 拉丁美洲
- 中東和非洲
- 波特的分析
- PESTLE分析
- 價格趨勢
- 按地區
- 按類型
- 未來市場趨勢
- 技術與創新展望
- 最新科技趨勢
- 新興技術
- 專利趨勢
- 貿易統計
- 主要進口國
- 主要出口國
- 永續性和環境方面
- 永續計劃
- 減少廢棄物策略
- 生產中的能源效率
- 具有環保意識的舉措
- 考慮碳足跡
第4章 競爭情勢
- 介紹
- 企業市佔率分析
- 按地區
- 北美洲
- 歐洲
- 亞太地區
- LATAM
- 中東和非洲
- 按地區
- 企業矩陣分析
- 主要市場公司的競爭分析
- 競爭定位矩陣
- 主要進展
- 併購
- 夥伴關係和聯盟
- 新產品發布
- 業務拓展計劃
第5章 市場估計與預測:依類型分類,2022-2035年
- 山梨醇
- 木糖醇
- 麥芽糖醇
- 赤藻醣醇
- 異麥芽糖醇
- 甘露醇
- 乳糖醇
- 其他
第6章 市場估計與預測:依形式分類,2022-2035年
- 粉末
- 液體
- 水晶
第7章 市場估計與預測:依應用領域分類,2022-2035年
- 食品/飲料
- 麵包糖果甜點
- 飲料
- 乳製品
- 加工食品
- 製藥
- 咀嚼片
- 糖漿/懸浮液
- 個人護理和化妝品
- 口腔護理用品(牙膏、漱口水)
- 護膚品
- 護髮
- 工業應用
- 化學合成
- 紡織業
- 造紙業
第8章 市場估計與預測:依地區分類,2022-2035年
- 北美洲
- 美國
- 加拿大
- 歐洲
- 德國
- 英國
- 法國
- 西班牙
- 義大利
- 其他歐洲國家
- 亞太地區
- 中國
- 印度
- 日本
- 澳洲
- 韓國
- 其他亞太國家
- 拉丁美洲
- 巴西
- 墨西哥
- 阿根廷
- 其他拉丁美洲國家
- 中東和非洲
- 沙烏地阿拉伯
- 南非
- UAE
- 其他中東和非洲國家
第9章:公司簡介
- Archer Daniels Midland Company(ADM)
- Associated British Foods
- B Food Science Co., Ltd.
- Batory Foods
- Cargill, Incorporated
- Futaste Pharmaceutical Co., Ltd.
- Gulshan Polyols Limited
- Huakang Pharma(Zhejiang Huakang Pharmaceutical)
- Ingredion Incorporated
- Jungbunzlauer Suisse AG
- Roquette Freres SA
- Sudzucker AG
- Tereos
The Global Polyol Sweeteners Market was valued at USD 4.2 billion in 2025 and is estimated to grow at a CAGR of 5.4% to reach USD 7.2 billion by 2035.
The industry is gaining consistent traction as consumers increasingly shift toward low-calorie alternatives to traditional sugar, driven by rising health awareness and dietary preferences. Polyol sweeteners play a vital role across food and beverage, personal care, pharmaceutical, and industrial applications due to their multifunctional properties. Their ability to support weight management, blood sugar control, and dental health has strengthened their position in modern product formulations. Growing demand for clean-label and naturally derived ingredients is further accelerating adoption, supported by evolving consumer expectations and regulatory focus on healthier consumption patterns. Rapid urbanization and changing dietary habits have increased the intake of processed foods, where polyols serve as key ingredients in reduced-calorie formulations. Their functional benefits, including moisture retention, product stability, and extended shelf life, make them highly suitable for a wide range of applications. Continuous innovation in formulation technologies and product development is enabling manufacturers to deliver tailored nutrition solutions, further supporting market expansion.
| Market Scope | |
|---|---|
| Start Year | 2025 |
| Forecast Year | 2026-2035 |
| Start Value | $4.2 Billion |
| Forecast Value | $7.2 Billion |
| CAGR | 5.4% |
The sorbitol segment accounted for 35.5% share in 2025 and is anticipated to grow at a CAGR of 5.6% through 2035. Its widespread use across multiple industries is driven by its versatility, as it provides moderate sweetness while also functioning as a stabilizing and moisture-retaining agent, making it suitable for diverse product formulations.
The powder segment held a share of 62% in 2025 and is expected to grow at a CAGR of 6.1% from 2026 to 2035. Powdered forms are preferred due to their ease of storage, efficient handling, and compatibility with automated production systems. Advancements in processing technologies have further enhanced product consistency and quality, supporting the segment's continued growth and broad adoption across applications.
North America Polyol Sweeteners Market accounted for a 40.5% share in 2025, supported by strong consumer awareness regarding health and wellness and increasing demand for reduced-sugar products. The region benefits from well-established food and beverage industries and continuous innovation by major manufacturers. Growing interest in functional foods and clean-label products is further contributing to market growth across the region.
Key companies operating in the Global Polyol Sweeteners Market include Cargill, Incorporated, Archer Daniels Midland Company (ADM), Ingredion Incorporated, Roquette Freres S.A., Sudzucker AG, Tereos, Associated British Foods, Jungbunzlauer Suisse AG, Gulshan Polyols Limited, Futaste Pharmaceutical Co., Ltd., Huakang Pharma (Zhejiang Huakang Pharmaceutical), B Food Science Co., Ltd., and Batory Foods. Companies in the polyol sweeteners market are focusing on strategic initiatives to strengthen their competitive positioning and expand their global footprint. They are investing in research and development to create advanced formulations that improve taste profiles, functionality, and nutritional value. Strategic partnerships and collaborations are being leveraged to enhance product portfolios and access new markets. Expansion of manufacturing capacities and supply chain optimization are helping companies meet rising demand efficiently. Firms are also emphasizing clean-label and sustainable production practices to align with evolving consumer preferences.
Table of Contents
Chapter 1 Methodology & Scope
- 1.1 Market scope and definition
- 1.2 Research design
- 1.2.1 Research approach
- 1.2.2 Data collection methods
- 1.3 Data mining sources
- 1.3.1 Global
- 1.3.2 Regional/Country
- 1.4 Base estimates and calculations
- 1.4.1 Base year calculation
- 1.4.2 Key trends for market estimation
- 1.5 Primary research and validation
- 1.5.1 Primary sources
- 1.6 Forecast model
- 1.7 Research assumptions and limitations
Chapter 2 Executive Summary
- 2.1 Industry 360° synopsis
- 2.2 Key market trends
- 2.2.1 Regional
- 2.2.2 Type
- 2.2.3 Form
- 2.2.4 Application
- 2.3 TAM Analysis, 2026-2035
- 2.4 CXO perspectives: Strategic imperatives
- 2.4.1 Executive decision points
Chapter 3 Industry Insights
- 3.1 Industry ecosystem analysis
- 3.1.1 Supplier landscape
- 3.1.2 Profit margin
- 3.1.3 Value addition at each stage
- 3.1.4 Factor affecting the value chain
- 3.1.5 Disruptions
- 3.2 Industry impact forces
- 3.2.1 Growth drivers
- 3.2.2 Industry pitfalls and challenges
- 3.2.3 Market opportunities
- 3.3 Growth potential analysis
- 3.4 Regulatory landscape
- 3.4.1 North America
- 3.4.2 Europe
- 3.4.3 Asia Pacific
- 3.4.4 Latin America
- 3.4.5 Middle East & Africa
- 3.5 Porter's analysis
- 3.6 PESTEL analysis
- 3.7 Price trends
- 3.7.1 By region
- 3.7.2 By type
- 3.8 Future market trends
- 3.9 Technology and Innovation landscape
- 3.9.1 Current technological trends
- 3.9.2 Emerging technologies
- 3.10 Patent Landscape
- 3.11 Trade statistics (HS code)
- 3.11.1 Major importing countries
- 3.11.2 Major exporting countries
- 3.12 Sustainability and environmental aspects
- 3.12.1 Sustainable practices
- 3.12.2 Waste reduction strategies
- 3.12.3 Energy efficiency in production
- 3.12.4 Eco-friendly initiatives
- 3.13 Carbon footprint consideration
Chapter 4 Competitive Landscape, 2025
- 4.1 Introduction
- 4.2 Company market share analysis
- 4.2.1 By region
- 4.2.1.1 North America
- 4.2.1.2 Europe
- 4.2.1.3 Asia Pacific
- 4.2.1.4 LATAM
- 4.2.1.5 MEA
- 4.2.1 By region
- 4.3 Company matrix analysis
- 4.4 Competitive analysis of major market players
- 4.5 Competitive positioning matrix
- 4.6 Key developments
- 4.6.1 Mergers & acquisitions
- 4.6.2 Partnerships & collaborations
- 4.6.3 New Product Launches
- 4.6.4 Expansion Plans
Chapter 5 Market Estimates and Forecast, By Type, 2022-2035 (USD Billion) (Kilo Tons)
- 5.1 Key trends
- 5.2 Sorbitol
- 5.3 Xylitol
- 5.4 Maltitol
- 5.5 Erythritol
- 5.6 Isomalt
- 5.7 Mannitol
- 5.8 Lactitol
- 5.9 Others
Chapter 6 Market Estimates and Forecast, By Form, 2022-2035 (USD Billion) (Kilo Tons)
- 6.1 Key trends
- 6.2 Powder
- 6.3 Liquid
- 6.4 Crystal
Chapter 7 Market Estimates and Forecast, By Application, 2022-2035 (USD Billion) (Kilo Tons)
- 7.1 Key trends
- 7.2 Food & beverages
- 7.2.1 Bakery & confectionery
- 7.2.2 Beverages
- 7.2.3 Dairy products
- 7.2.4 Processed foods
- 7.3 Pharmaceuticals
- 7.3.1 Chewable tablets
- 7.3.2 Syrups & suspensions
- 7.4 Personal care & cosmetics
- 7.4.1 Oral care (toothpaste, mouthwash)
- 7.4.2 Skincare products
- 7.4.3 Hair care
- 7.5 Industrial applications
- 7.5.1 Chemical synthesis
- 7.5.2 Textile industry
- 7.5.3 Paper industry
Chapter 8 Market Estimates and Forecast, By Region, 2022-2035 (USD Billion) (Kilo Tons)
- 8.1 Key trends
- 8.2 North America
- 8.2.1 U.S.
- 8.2.2 Canada
- 8.3 Europe
- 8.3.1 Germany
- 8.3.2 UK
- 8.3.3 France
- 8.3.4 Spain
- 8.3.5 Italy
- 8.3.6 Rest of Europe
- 8.4 Asia Pacific
- 8.4.1 China
- 8.4.2 India
- 8.4.3 Japan
- 8.4.4 Australia
- 8.4.5 South Korea
- 8.4.6 Rest of Asia Pacific
- 8.5 Latin America
- 8.5.1 Brazil
- 8.5.2 Mexico
- 8.5.3 Argentina
- 8.5.4 Rest of Latin America
- 8.6 Middle East and Africa
- 8.6.1 Saudi Arabia
- 8.6.2 South Africa
- 8.6.3 UAE
- 8.6.4 Rest of Middle East and Africa
Chapter 9 Company Profiles
- 9.1 Archer Daniels Midland Company (ADM)
- 9.2 Associated British Foods
- 9.3 B Food Science Co., Ltd.
- 9.4 Batory Foods
- 9.5 Cargill, Incorporated
- 9.6 Futaste Pharmaceutical Co., Ltd.
- 9.7 Gulshan Polyols Limited
- 9.8 Huakang Pharma (Zhejiang Huakang Pharmaceutical)
- 9.9 Ingredion Incorporated
- 9.10 Jungbunzlauer Suisse AG
- 9.11 Roquette Freres S.A.
- 9.12 Sudzucker AG
- 9.13 Tereos


