

 |
市場調查報告書
商品編碼
2045847
翻新筆記型電腦市場機會、成長要素、產業趨勢分析及2026-2035年預測Refurbished Laptop Market Opportunity, Growth Drivers, Industry Trend Analysis, and Forecast 2026 - 2035 |
||||||
2025年全球翻新筆記型電腦市場價值64億美元,預計到2035年將以6%的複合年成長率成長至117億美元。
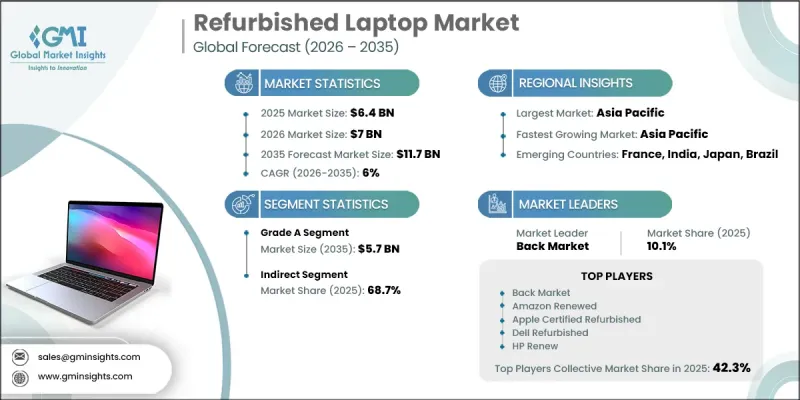
隨著企業和消費者在硬體採購中日益重視成本效益,翻新筆記型電腦產業正穩步發展。在經濟壓力不斷增加的情況下,企業開始採用翻新系統,與新設備相比,翻新系統不僅成本更低,性能也更高。這種轉變使得企業能夠在控制預算的同時獲得高效能配置。永續性因素也發揮著至關重要的作用,企業致力於透過減少電子廢棄物和降低碳排放,籌資策略與環境、社會和管治(ESG) 目標保持一致。硬體耐用性和軟體相容性的提升延長了計算設備的使用壽命,使翻新系統成為實用可靠的選擇。靈活辦公和數位化學習趨勢的推動,對二手設備的需求不斷成長,進一步擴大了市場。隨著翻新技術的接受度不斷提高,市場也不斷發展,品質標準和認證流程也不斷改進,消費者信心也不斷增強。
| 市場範圍 | |
|---|---|
| 開始年份 | 2025 |
| 預測期 | 2026-2035 |
| 上市時的市場規模 | 64億美元 |
| 預計金額 | 117億美元 |
| 複合年成長率 | 6% |
A級翻新筆記型電腦市場預計在2025年達到30億美元,到2035年將達到57億美元。此類別在翻新筆記型電腦市場中佔據最高品質等級,其產品在性能和外觀上都接近全新。這些系統通常經過嚴格的翻新流程,以最大程度地減少使用痕跡並確保功能穩定可靠。對於尋求可靠且外觀精美設備的專業用戶而言,該類別極具吸引力,同時與低等級產品相比,它還具有更長的使用壽命和更高的成本績效。
到2025年,間接通路的市佔率將達到68.7%。此通路的優勢在於其豐富多樣的庫存,使客戶能夠在單一平台上獲取不同品牌的多種產品選擇。間接通路在產品供應和配置方面提供了更大的柔軟性,從而更好地滿足特定用戶的需求。這些平台的廣泛覆蓋範圍,加上精簡的物流和更便利的管道,持續推動著該管道的成長。
預計到2025年,美國翻新筆記型電腦市佔率將達到76.3%。美國市場的成長主要得益於系統化的硬體生命週期管理實務以及機構和商業領域對翻新設備的廣泛應用。各組織機構擴大利用翻新系統來最佳化成本,同時保持性能標準。完善的翻新生態系統、先進的分銷網路以及消費者的高度信任,進一步推動了該地區市場的擴張。
目錄
第1章:調查方法和範圍
第2章執行摘要
第3章:行業洞察
- 工業生態系分析
- 供應商情況
- 利潤率
- 每個階段增加的價值
- 影響價值鏈的因素
- 影響產業的因素
- 促進因素
- 中小企業和教育領域的需求不斷成長。
- 企業IT資產處分計劃
- 電子商務
- 產業潛在風險與挑戰
- 與消費者認知和信任相關的挑戰
- 科技快速過時
- 機會
- 企業和機構的生命週期更新
- 以線上為先、以信任主導的零售擴張
- 促進因素
- 成長潛力分析
- 監理框架
- 關鍵市場趨勢與顛覆性因素
- 價格分析
- 對過去價格趨勢的分析
- 根據參與企業的類型(高階、價值、成本加成)所製定的定價策略
- 未來市場趨勢
- 貿易數據分析
- 進出口量及進口額趨勢
- 主要貿易路線及關稅的影響
- 人工智慧和生成式人工智慧對市場的影響
- 利用人工智慧改造現有經營模式
- 基於細分市場的生成式人工智慧的應用案例和部署藍圖
- 風險、限制和監管考量
- 波特的分析
- PESTLE分析
- 生產能力和生產情況
- 設備產能:按地區和主要生產商分類
- 運轉率和擴張計劃
第4章 競爭情勢
- 介紹
- 企業市佔率分析
- 按地區
- 企業矩陣分析
- 主要市場公司的競爭分析
- 競爭定位矩陣
- 併購
- 夥伴關係和聯盟
- 新產品發布
- 業務拓展計劃
第5章 市場估算與預測:依等級分類,2022-2035年
- A級
- B級
- C級
- D級
第6章 市場估算與預測:依作業系統分類,2022-2035年
- Windows翻新筆記型電腦
- 翻新Mac筆記型電腦
- 其他
第7章 市場估價與預測:依螢幕尺寸分類,2022-2035年
- 11-13英寸
- 14-16英寸
- 17吋或更大
第8章 市場估算與預測:依最終用途分類,2022-2035年
- 個人消費者
- 公司
- 其他
第9章 市場估價與預測:依通路分類,2022-2035年
- 直接地
- 間接
第10章 市場估價與預測:依地區分類,2022-2035年
- 北美洲
- 美國
- 加拿大
- 歐洲
- 德國
- 英國
- 法國
- 義大利
- 西班牙
- 亞太地區
- 中國
- 印度
- 日本
- 韓國
- 澳洲
- 拉丁美洲
- 巴西
- 墨西哥
- 其他拉丁美洲國家
- 中東和非洲
- 阿拉伯聯合大公國
- 沙烏地阿拉伯
- 南非
- 其他中東和非洲國家
第11章:公司簡介
- 世界公司
- Amazon Renewed
- Apple Certified Refurbished
- Back Market
- Dell Refurbished
- HP Renew
- Lenovo Outlet
- Walmart Renewed
- 當地公司
- Gazelle
- Mac of All Trades
- Newegg Renewed
- OWC
- Recommerce
- Refurb.io
- Refurbees
- 新興企業
- Laptop Outlet
- Patagonia Computers
- Reebelo
- RefurbMe
- Renewd
- Renewed Computer Technology
- Student Computers
The Global Refurbished Laptop Market was valued at USD 6.4 billion in 2025 and is estimated to grow at a CAGR of 6% to reach USD 11.7 billion by 2035.
The refurbished laptop industry is gaining consistent traction as businesses and consumers increasingly prioritize cost efficiency in hardware procurement. Rising economic pressure is encouraging organizations to adopt refurbished systems that deliver strong performance at significantly lower costs compared to new devices. This shift enables access to premium specifications while maintaining budget discipline. Sustainability considerations are also playing a central role, as companies aim to align procurement strategies with Environmental, Social, and Governance objectives by reducing electronic waste and minimizing carbon impact. Improvements in hardware durability and software compatibility have extended the usable life of computing devices, making refurbished systems a practical and reliable choice. The growing demand for secondary devices, driven by flexible work environments and digital learning trends, is further supporting market expansion. As acceptance of refurbished technology increases, the market continues to evolve with improved quality standards, certification processes, and enhanced consumer confidence.
| Market Scope | |
|---|---|
| Start Year | 2025 |
| Forecast Year | 2026-2035 |
| Start Value | $6.4 Billion |
| Forecast Value | $11.7 Billion |
| CAGR | 6% |
The Grade A segment reached USD 3 billion in 2025 and is expected to reach USD 5.7 billion by 2035. This category represents the highest quality tier within the refurbished laptop market, offering products that closely resemble new devices in both performance and appearance. These systems typically undergo rigorous refurbishment processes to ensure minimal signs of prior use and consistent functionality. The segment is highly appealing to professional users seeking reliable and aesthetically suitable devices, while also offering extended usability and strong value compared to lower-grade alternatives.
The indirect distribution channel held a 68.7% share in 2025. This segment benefits from a broad and diverse inventory, allowing customers to access multiple product options across different brands in a single platform. Indirect channels provide enhanced flexibility in product availability and configuration, enabling better alignment with specific user requirements. The widespread reach of these platforms, combined with streamlined logistics and improved accessibility, continues to drive growth within this segment.
United States Refurbished Laptop Market held a 76.3% share in 2025. Growth in the country is supported by structured hardware lifecycle management practices and widespread adoption of refurbished devices across institutional and commercial sectors. Organizations are increasingly leveraging refurbished systems to optimize costs while maintaining performance standards. The presence of established refurbishment ecosystems, advanced distribution networks, and high consumer trust is further strengthening market expansion in the region.
Key companies operating in the Global Refurbished Laptop Market include Apple Certified Refurbished, Dell Refurbished, Amazon Renewed, Lenovo Outlet, HP Renew, Back Market, Gazelle, Newegg Renewed, Walmart Renewed, Reebelo, RefurbMe, Refurbees, Refurb.io, Renewd, Recommerce, OWC, Laptop Outlet, Mac of All Trades, Patagonia Computers, Student Computers, and Renewed Computer Technology. Companies in the refurbished laptop market are implementing a variety of strategies to strengthen their market position and expand their customer base. Organizations are focusing on enhancing refurbishment processes to ensure high product quality, reliability, and consistency across offerings. Certification programs and warranty support are being emphasized to build consumer trust and improve purchase confidence. Companies are also expanding their digital presence through e-commerce platforms, enabling broader market reach and improved accessibility. Strategic partnerships with enterprises and institutions are helping secure a steady supply of used devices for refurbishment.
Table of Contents
Chapter 1 Methodology & Scope
- 1.1 Research approach
- 1.2 Quality Commitments
- 1.3 GMI AI policy & data integrity commitment
- 1.3.1 Source consistency protocol
- 1.4 Research Trail & Confidence Scoring
- 1.4.1 Research Trail Components
- 1.4.2 Scoring Components
- 1.5 Data Collection
- 1.5.1 Partial list of primary sources
- 1.6 Data mining sources
- 1.7 Paid sources
- 1.7.1 Sources, by region
- 1.8 Base estimates and calculations
- 1.8.1 Base year calculation for any one approach
- 1.9 Forecast model
- 1.9.1 Quantified market impact analysis
- 1.9.1.1 Mathematical impact of growth parameters on forecast
- 1.9.1 Quantified market impact analysis
- 1.10 Research transparency addendum
- 1.10.1 Source attribution framework
- 1.10.2 Quality assurance metrics
- 1.10.3 Our commitment to trust
Chapter 2 Executive Summary
- 2.1 Industry 360° synopsis, 2022 - 2035
- 2.2 Key market trends
- 2.2.1 Regional
- 2.2.2 Grade
- 2.2.3 Operating System
- 2.2.4 Screen Size
- 2.2.5 End use
- 2.2.6 Distribution Channel
Chapter 3 Industry Insights
- 3.1 Industry ecosystem analysis
- 3.1.1 Supplier landscape
- 3.1.2 Profit margin
- 3.1.3 Value addition at each stage
- 3.1.4 Factor affecting the value chain
- 3.2 Industry impact forces
- 3.2.1 Growth drivers
- 3.2.1.1 Rising demand in SMB and education sectors
- 3.2.1.2 Corporate IT asset disposal programs
- 3.2.1.3 E-commerce growth
- 3.2.2 Industry pitfalls & challenges
- 3.2.2.1 Consumer perception and trust issues
- 3.2.2.2 Rapid tech obsolescence
- 3.2.3 Opportunities
- 3.2.3.1 Enterprise & institutional lifecycle refresh programs:
- 3.2.3.2 Online-first, trust-led retail expansion
- 3.2.1 Growth drivers
- 3.3 Growth potential analysis
- 3.4 Regulatory framework
- 3.5 Major market trends and disruptions
- 3.6 Pricing Analysis (driven by primary research)
- 3.6.1 Historical price trend analysis (driven by primary research)
- 3.6.2 Pricing strategy by player type (premium / value / cost-plus) (driven by primary research)
- 3.7 Future market trends
- 3.8 Trade data analysis (driven by paid database) (HS Code 847130)
- 3.8.1 Import/export volume & value trends (driven by primary research)
- 3.8.2 Key trade corridors & tariff impact (driven by primary research)
- 3.9 Impact of AI & Generative AI on the Market
- 3.9.1 AI-driven disruption of existing business models
- 3.9.2 Gen-AI use cases & adoption roadmap by segment
- 3.9.3 Risks, limitations & regulatory considerations
- 3.10 Porter's analysis
- 3.11 PESTEL analysis
- 3.12 Capacity & production landscape (driven by primary research)
- 3.12.1 Installed capacity by region & key producer (driven by primary research)
- 3.12.2 Capacity utilization rates & expansion pipelines (driven by primary research)
Chapter 4 Competitive Landscape, 2025
- 4.1 Introduction
- 4.2 Company market share analysis
- 4.2.1 By region
- 4.2.1.1 North America
- 4.2.1.2 Europe
- 4.2.1.3 Asia Pacific
- 4.2.1.4 Latin America
- 4.2.1.5 Middle East and Africa
- 4.2.1 By region
- 4.3 Company matrix analysis
- 4.4 Competitive analysis of major market players
- 4.5 Competitive positioning matrix
- 4.6 Key developments
- 4.6.1 Mergers & acquisitions
- 4.6.2 Partnerships & collaborations
- 4.6.3 New product launches
- 4.6.4 Expansion plans
Chapter 5 Market Estimates & Forecast, By Grade, 2022 - 2035, (USD Billion) (Thousand Units)
- 5.1 Key trends
- 5.2 Grade A
- 5.3 Grade B
- 5.4 Grade C
- 5.5 Grade D
Chapter 6 Market Estimates & Forecast, By Operating System, 2022 - 2035, (USD Billion) (Thousand Units)
- 6.1 Key trends
- 6.2 Windows refurbished laptops
- 6.3 Mac refurbished laptops
- 6.4 Others
Chapter 7 Market Estimates & Forecast, By Screen Size, 2022 - 2035, (USD Billion) (Thousand Units)
- 7.1 Key trends
- 7.2 11-13 inches
- 7.3 14-16 inches
- 7.4 17 inches and above
Chapter 8 Market Estimates & Forecast, By End Use, 2022 - 2035, (USD Billion) (Thousand Units)
- 8.1 Key trends
- 8.2 Individual consumers
- 8.3 Businesses
- 8.4 Others
Chapter 9 Market Estimates & Forecast, By Distribution Channel, 2022 - 2035, (USD Billion) (Thousand Units)
- 9.1 Key trends
- 9.2 Direct
- 9.3 Indirect
Chapter 10 Market Estimates & Forecast, By Region, 2022 - 2035, (USD Billion) (Units)
- 10.1 Key trends
- 10.2 North America
- 10.2.1 U.S.
- 10.2.2 Canada
- 10.3 Europe
- 10.3.1 Germany
- 10.3.2 U.K.
- 10.3.3 France
- 10.3.4 Italy
- 10.3.5 Spain
- 10.4 Asia Pacific
- 10.4.1 China
- 10.4.2 India
- 10.4.3 Japan
- 10.4.4 South Korea
- 10.4.5 Australia
- 10.5 Latin America
- 10.5.1 Brazil
- 10.5.2 Mexico
- 10.5.3 Rest of Latin America
- 10.6 MEA
- 10.6.1 UAE
- 10.6.2 Saudi Arabia
- 10.6.3 South Africa
- 10.6.4 Rest of MEA
Chapter 11 Company Profiles (Business Overview, Financial Data, Product Landscape, Strategic Outlook, SWOT Analysis)
- 11.1 Global Companies
- 11.1.1 Amazon Renewed
- 11.1.2 Apple Certified Refurbished
- 11.1.3 Back Market
- 11.1.4 Dell Refurbished
- 11.1.5 HP Renew
- 11.1.6 Lenovo Outlet
- 11.1.7 Walmart Renewed
- 11.2 Regional Companies
- 11.2.1 Gazelle
- 11.2.2 Mac of All Trades
- 11.2.3 Newegg Renewed
- 11.2.4 OWC
- 11.2.5 Recommerce
- 11.2.6 Refurb.io
- 11.2.7 Refurbees
- 11.3 Emerging Companies
- 11.3.1 Laptop Outlet
- 11.3.2 Patagonia Computers
- 11.3.3 Reebelo
- 11.3.4 RefurbMe
- 11.3.5 Renewd
- 11.3.6 Renewed Computer Technology
- 11.3.7 Student Computers

