

 |
市場調查報告書
商品編碼
2045779
2026 年至 2035 年 7 級卡車的市場機會、成長要素、產業趨勢分析與預測。Class 7 Trucks Market Opportunity, Growth Drivers, Industry Trend Analysis, and Forecast 2026 - 2035 |
||||||
預計到 2025 年,全球 7 級卡車市場價值將達到 389.1 億美元,年複合成長率為 5.6%,到 2035 年將達到 643.6 億美元。
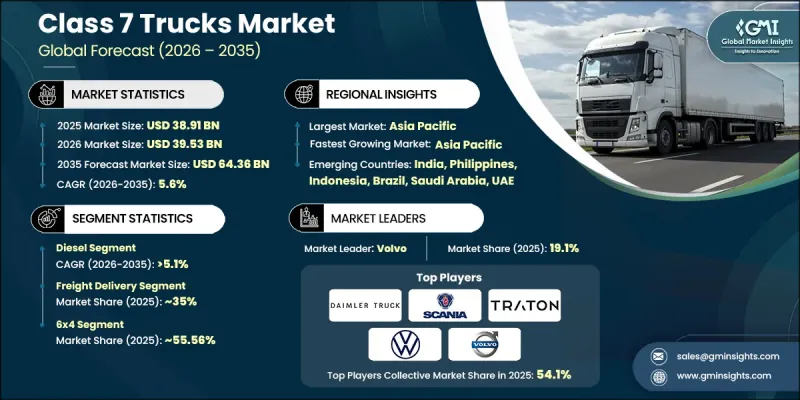
隨著貨運物流、基礎建設和工業活動朝向更最佳化、技術驅動的車輛生態系統演進,市場正經歷結構性轉型。 7級卡車(通常定義為總重在26,001至33,000磅之間的卡車)正日益成為中程運輸網路中不可或缺的資產,為物流活動、建築相關作業、市政職能和公共產業服務提供支援。車隊營運商正在迅速採用遠端資訊處理解決方案、高級駕駛輔助系統(ADAS)和替代燃料技術,這些技術正在改變車隊效率、路線最佳化和生命週期成本管理策略。
| 市場範圍 | |
|---|---|
| 開始年份 | 2025 |
| 預測期 | 2026-2035 |
| 初始市場規模 | 389.1億美元 |
| 預測市場規模 | 643.6億美元 |
| 複合年成長率 | 5.6% |
監管壓力在塑造市場走向方面發揮著至關重要的作用,嚴格的排放氣體標準、強制性零排放貨運以及以永續性為導向的運輸政策正在影響主要經濟體的購買行為。在北美和歐洲等地區,監管合規要求正在加速車輛的更新換代;而在新興市場,排放氣體法規的逐步收緊正在推動中型卡車的現代化。這些監管趨勢也影響動力傳動系統的選擇、基礎設施投資和長期採購規劃。同時,物流網路和工業供應鏈的擴張帶動了需求的成長,進一步提升了對可靠且適應性強的7級卡車的需求,而這些卡車是全球現代貨運戰略的核心。
預計到2025年,柴油卡車市佔率將達到77.01%,並在2035年之前以5.1%的複合年成長率成長。柴油技術憑藉其高扭矩輸出、燃油效率以及適用於長途和重型運輸等優勢,在7級卡車市場繼續保持主導地位。這些卡車在物流、基礎設施建設、市政營運和本地配送等需要耐用性和在嚴苛條件下穩定性能的領域備受青睞。完善的加油基礎設施和柴油燃料的廣泛供應進一步推動了柴油車在已開發地區和發展中地區的強勁普及,確保了柴油中型卡車市場的持續穩定。
預計到2035年,公共產業服務領域將以6.4%的複合年成長率成長,這主要得益於7級卡車在公共基礎設施維護、廢棄物管理系統、能源分配網路和市政服務等領域的日益普及。政府和私人營運商正積極對其公共產業事業車隊進行現代化改造,以提高效率、減少運作並滿足日益嚴格的環保標準。替代燃料系統、整合式遠端資訊處理平台和增強型安全技術的引入也推動了車隊現代化進程。這些改進提升了營運績效,並支持公共產業運輸服務實現長期永續性目標。
預計2025年,中國7級卡車市佔率將達到64.2%,市場規模將達93億美元。大規模的基礎設施投資、都市區貨運系統的快速發展以及政府持續推動商用車現代化建設,都為中國7級卡車市場的擴張提供了強力的支撐。工業園區、智慧城市計畫和交通基礎設施的持續發展,顯著提升了建築支援、市政服務和區域間貨運對中型卡車的需求。此外,數位商務和準時配送服務的快速發展,也推動了對高效中程物流解決方案的需求,進一步凸顯了7級卡車在中國不斷發展的交通運輸生態系統中的重要性。
目錄
第1章:調查方法
第2章執行摘要
第3章:行業洞察
- 工業生態系分析
- 供應商情況
- 利潤率分析
- 成本結構
- 每個階段增加的價值
- 影響價值鏈的因素
- 中斷
- 影響產業的因素
- 促進因素
- 全球對7級電動混合動力卡車的需求正在成長。
- 北美貨運活動的擴張
- 歐洲引入嚴格的排放法規
- 亞太地區基礎建設活動投資增加
- 中東和非洲的採礦、石油和天然氣產業對 7 級混凝土的需求不斷成長。
- 產業潛在風險與挑戰
- 高昂的初始成本和維護費用
- 卡車駕駛人短缺
- 市場機遇
- 市政和城市物流車輛的電氣化
- 新興國家的基礎設施和建設活動擴張
- 擴大靈活的所有權模式、租賃和卡車即服務 (TaaS) 模式。
- 整合先進的遠端資訊處理和車隊分析解決方案
- 促進因素
- 成長潛力分析
- 技術與創新展望
- 最新科技趨勢
- 新技術
- 價格分析
- 對過去價格趨勢的分析
- 根據參與企業的類型(高階、價值、成本加成)所製定的定價策略
- 監理情勢
- 北美洲
- NEVI/IIJA,先進清潔卡車(ACT)法規
- 歐洲
- 德國:電動汽車法(EmoG)
- 英國:清潔車輛改造系統(CVRAS)、超低排放氣體區(ULEZ)
- 法國:流動性導向法(LOM 法)
- 義大利:能源與氣候整合計畫(PNIEC)
- 亞太地區
- 中國:強制推廣新能源汽車
- 印度:FAME II計劃
- 日本:電動車/燃料電池車引進戰略藍圖圖
- 澳洲:各州強制推行零排放車輛
- 拉丁美洲
- 巴西:國家電動車政策(PNME)
- 墨西哥:都市區零排放車輛推廣計劃
- 阿根廷:國家電動車獎勵政策(布宜諾斯艾利斯)
- 中東和非洲
- 阿拉伯聯合大公國:電動車充電基礎設施法規(ADDM/DEWA)
- 沙烏地阿拉伯:電動車普及法規結構(SASO)
- 南非:綠色交通戰略
- 北美洲
- 專利趨勢
- 貿易數據分析
- 進出口量及進口額趨勢
- 主要貿易路線及關稅的影響
- 人工智慧和生成式人工智慧對市場的影響
- 利用人工智慧改造現有經營模式
- 基於細分市場的生成式人工智慧的應用案例和部署藍圖
- 風險、限制和監管考量
- 生產能力和生產情況
- 生產能力:按地區和主要生產商分類
- 運轉率和擴張計劃
- 永續性和環境方面
- 永續發展計劃
- 減少廢棄物策略
- 生產中的能源效率
- 環保舉措
- 考慮碳足跡
- 預測假設和情境分析
- 基本案例:驅動複合年成長率的關鍵宏觀經濟與產業變量
- 樂觀情境:宏觀經濟與產業的利多因素
- 悲觀情景:宏觀經濟放緩或產業逆風
第4章 競爭情勢
- 企業市佔率分析
- 主要市場公司的競爭分析
- 競爭定位矩陣
- 併購
- 夥伴關係和聯盟
- 新產品發布
- 業務拓展計劃及資金籌措
- 按公司規模進行基準測試
- 排名分類標準與遴選標準
- 按銷售額、地區和創新能力分類的層級定位矩陣。
第5章 市場估算與預測:依燃料類型分類,2022-2035年
- 柴油引擎
- 天然氣
- 混合
- 其他
第6章 市場估計與預測:依應用領域分類,2022-2035年
- 貨物運輸
- 公共產業服務
- 建築和採礦
- 其他
第7章 市場估價與預測:依車軸分類,2022-2035年
- 4x2
- 6x4
- 6x2
第8章 市場估算與預測:惠普公司,2022-2035年
- 300馬力或以下
- 300HP~400HP
- 400HP~500HP
- 500馬力或以上
第9章 市場估計與預測:依所有權類型分類,2022-2035年
- 車隊營運商
- 獨立企業
第10章 市場估價與預測:依輸電類型分類,2022-2035年
- 手排變速箱
- 自動變速箱
第11章 市場估價與預測:按地區分類,2022-2035年
- 北美洲
- 美國
- 加拿大
- 歐洲
- 德國
- 英國
- 法國
- 義大利
- 西班牙
- 俄羅斯
- 北歐的
- 亞太地區
- 中國
- 印度
- 日本
- 澳洲
- 韓國
- 菲律賓
- 印尼
- 拉丁美洲
- 巴西
- 墨西哥
- 阿根廷
- 中東和非洲
- 南非
- 沙烏地阿拉伯
- 阿拉伯聯合大公國
第12章:公司簡介
- 世界公司
- Daimler Truck
- Ford Motor Company
- Hino Motors
- Isuzu Motors
- Navistar
- Scania
- TRATON
- Volvo Trucks
- 當地公司
- Ashok Leyland
- BYD
- Eicher Motor
- GMC
- Hyundai
- JAC Motors
- Kenworth
- Kia
- Mack Trucks
- Mahindra & Mahindra
- Mitsubishi Fuso Truck and Bus Corporation
- Peterbilt
- SML Isuzu
- Tata Motors
- 新興企業
- Dongfeng Motor
- Rivian Automotive
- SAIC Maxus
The Global Class 7 Trucks Market was valued at USD 38.91 billion in 2025 and is estimated to grow at a CAGR of 5.6% to reach USD 64.36 billion by 2035.
The market is undergoing structural transformation as freight logistics, infrastructure development, and industrial operations evolve toward more optimized and technology-enabled fleet ecosystems. Class 7 trucks, typically defined by a GVWR range of 26,001 to 33,000 lbs, are increasingly positioned as essential assets in medium-duty transportation networks supporting distribution activities, construction-related operations, municipal functions, and utility-based services. Fleet operators are rapidly adopting telematics solutions, advanced driver-assistance systems, and alternative fuel technologies, which are reshaping fleet efficiency, route optimization, and lifecycle cost management strategies.
| Market Scope | |
|---|---|
| Start Year | 2025 |
| Forecast Year | 2026-2035 |
| Start Value | $38.91 Billion |
| Forecast Value | $64.36 Billion |
| CAGR | 5.6% |
Regulatory pressure is playing a defining role in shaping market direction, with stringent emission standards, zero-emission freight mandates, and sustainability-focused transport policies influencing purchasing behavior across major economies. Regions such as North America and Europe are accelerating fleet renewal cycles due to compliance requirements, while emerging economies are progressively tightening emission frameworks, encouraging modernization of medium-duty fleets. These regulatory dynamics are also influencing powertrain selection, infrastructure investments, and long-term procurement planning. In parallel, rising demand from expanding logistics networks and industrial supply chains is reinforcing the need for reliable and adaptable Class 7 trucks, making them central to modern freight mobility strategies across global markets.
The diesel-powered segment held a 77.01% share in 2025 and is projected to grow at a CAGR of 5.1% through 2035. Diesel technology continues to lead the Class 7 trucks space due to its high torque output, fuel efficiency, and strong suitability for long-distance and heavy-load operations. These trucks are widely preferred in sectors requiring durability and consistent performance under demanding conditions, including logistics, infrastructure development, municipal operations, and regional distribution activities. Established fueling infrastructure and widespread diesel availability further reinforce its strong adoption across both developed and developing regions, ensuring continued market stability for diesel-powered medium-duty trucks.
The utility services application segment is expected to grow at a CAGR of 6.4% through 2035, supported by increasing deployment of Class 7 trucks across public infrastructure maintenance, waste handling systems, energy distribution networks, and municipal operations. Governments and private operators are actively modernizing utility fleets to enhance efficiency, reduce operational downtime, and comply with tightening environmental standards. Fleet upgrades are also being driven by the adoption of alternative fuel systems, integrated telematics platforms, and enhanced safety technologies, which are improving operational performance and supporting long-term sustainability goals in utility-based transportation services.
China Class 7 Trucks Market held a 64.2% share in 2025 and generated USD 9.3 billion through 2035. The country's market expansion is strongly supported by large-scale infrastructure investment, rapid growth in urban freight systems, and sustained government initiatives aimed at modernizing commercial vehicle fleets. Ongoing development of industrial zones, smart city projects, and transportation infrastructure is significantly increasing demand for medium-duty trucks across construction support, municipal services, and regional freight movement. Additionally, the rapid expansion of digital commerce and time-sensitive delivery services is strengthening demand for efficient mid-mile logistics solutions, further reinforcing the importance of Class 7 trucks in China's evolving transport ecosystem.
Key players operating in the Global Class 7 Trucks Industry include Volvo, PACCAR, Isuzu Motors, Daimler Trucks, Volkswagen, Traton, Scania, Kenworth, and Peterbilt. Companies in the Class 7 Trucks Market are prioritizing fleet electrification strategies and alternative fuel integration to align with global emission targets and regulatory mandates. They are investing heavily in telematics-based fleet intelligence systems to enhance route optimization, predictive maintenance, and real-time performance tracking. Strategic collaborations with logistics providers and infrastructure developers are strengthening their supply chain presence. Manufacturers are also focusing on modular truck platforms to improve customization flexibility across applications. In addition, continuous R&D investments are being directed toward improving vehicle efficiency, safety systems, and autonomous driving capabilities. Expansion of service networks and lifecycle support programs is further helping companies retain long-term customer relationships and reinforce market competitiveness across diverse regions.
Table of Contents
Chapter 1 Methodology
- 1.1 Research approach
- 1.2 Quality Commitments
- 1.2.1 GMI AI policy & data integrity commitment
- 1.2.1.1 Source consistency protocol
- 1.2.1 GMI AI policy & data integrity commitment
- 1.3 Research Trail & Confidence Scoring
- 1.3.1 Research Trail Components
- 1.3.2 Scoring Components
- 1.4 Data Collection
- 1.4.1 Partial list of primary sources
- 1.5 Data mining sources
- 1.5.1 Paid sources
- 1.5.1.1 Sources, by region
- 1.5.1 Paid sources
- 1.6 Base estimates and calculations
- 1.6.1 Base year calculation
- 1.7 Forecast Model
- 1.7.1 Quantified market impact analysis
- 1.7.1.1 Mathematical impact of growth parameters on forecast
- 1.7.1 Quantified market impact analysis
- 1.8 Research transparency addendum
- 1.8.1 Source attribution framework
- 1.8.2 Quality assurance metrics
- 1.8.3 Our commitment to trust
Chapter 2 Executive Summary
- 2.1 Industry 360° synopsis, 2022 - 2035
- 2.2 Key market trends
- 2.2.1 Regional
- 2.2.2 Fuel
- 2.2.3 Application
- 2.2.4 Axle
- 2.2.5 Horsepower
- 2.2.6 Ownership
- 2.2.7 Transmission
- 2.3 TAM Analysis, 2026-2035
- 2.4 CXO perspectives: Strategic imperatives
Chapter 3 Industry Insights
- 3.1 Industry ecosystem analysis
- 3.1.1 Supplier landscape
- 3.1.2 Profit margin analysis
- 3.1.3 Cost structure
- 3.1.4 Value addition at each stage
- 3.1.5 Factor affecting the value chain
- 3.1.6 Disruptions
- 3.2 Industry impact forces
- 3.2.1 Growth drivers
- 3.2.1.1 Increasing demand for electric & hybrid class 7 trucks across the globe
- 3.2.1.2 Growing freight transportation activities across North America
- 3.2.1.3 Implementation of stringent emission regulations in Europe
- 3.2.1.4 Rising investments in infrastructure development activities in Asia Pacific
- 3.2.1.5 Growing demand for class 7 from mining and oil & gas sector in MEA
- 3.2.2 Industry pitfalls and challenges
- 3.2.2.1 High initial and maintenance costs
- 3.2.2.2 Shortage of truck drivers
- 3.2.3 Market opportunities
- 3.2.3.1 Electrification of municipal and urban logistics fleets
- 3.2.3.2 Expansion of infrastructure and construction activities in emerging economies
- 3.2.3.3 Growth of flexible ownership, leasing, and Truck-as-a-Service (TaaS) models
- 3.2.3.4 Integration of advanced telematics and fleet analytics solutions
- 3.2.1 Growth drivers
- 3.3 Growth potential analysis
- 3.4 Technology and Innovation landscape
- 3.4.1 Current technological trends
- 3.4.2 Emerging technologies
- 3.5 Pricing Analysis (Driven by Primary Research)
- 3.5.1 Historical Price Trend Analysis
- 3.5.2 Pricing Strategy by Player Type (Premium / Value / Cost-plus)
- 3.6 Regulatory landscape
- 3.6.1 North America
- 3.6.1.1 NEVI / IIJA, Advanced Clean Trucks (ACT) Regulation.
- 3.6.2 Europe
- 3.6.2.1 Germany: Electric Mobility Act (EmoG)
- 3.6.2.2 UK: Clean Vehicle Retrofit Accreditation Scheme (CVRAS), Ultra-Low Emission Zone (ULEZ)
- 3.6.2.3 France: Mobility Orientation Law (LOM Act)
- 3.6.2.4 Italy: National Integrated Plan for Energy and Climate (PNIEC)
- 3.6.3 Asia Pacific
- 3.6.3.1 China: New Energy Vehicle (NEV) Mandate
- 3.6.3.2 India: FAME II Scheme
- 3.6.3.3 Japan: Strategic Roadmap for EV/FCV Deployment
- 3.6.3.4 Australia: State-Level Zero-Emission Vehicle Mandates
- 3.6.4 Latin America
- 3.6.4.1 Brazil: National Electric Mobility Policy (PNME)
- 3.6.4.2 Mexico: Urban Zero-Emission Fleet Programs
- 3.6.4.3 Argentina: Provincial EV Incentive Regulations (Buenos Aires)
- 3.6.5 MEA
- 3.6.5.1 UAE: EV Charging Infrastructure Regulation (ADDM/DEWA)
- 3.6.5.2 Saudi Arabia: EV Deployment Regulatory Framework (SASO)
- 3.6.5.3 South Africa: Green Transport Strategy
- 3.6.1 North America
- 3.7 Patent Landscape (Driven by Primary Research)
- 3.8 Trade Data Analysis (Based on Paid Database)
- 3.8.1 Import/Export Volume & Value Trends
- 3.8.2 Key Trade Corridors & Tariff Impact
- 3.9 Impact of AI & Generative AI on the Market (Driven by Primary Research)
- 3.9.1 AI-Driven Disruption of Existing Business Models
- 3.9.2 GenAI Use Cases & Adoption Roadmap by Segment
- 3.9.3 Risks, Limitations & Regulatory Considerations
- 3.10 Capacity & Production Landscape (Driven by Primary Research)
- 3.10.1 Production Capacity by Region & Key Producer
- 3.10.2 Capacity Utilization Rates & Expansion Pipelines
- 3.11 Sustainability and environmental aspects
- 3.11.1 Sustainable practices
- 3.11.2 Waste reduction strategies
- 3.11.3 Energy efficiency in production
- 3.11.4 Eco-friendly initiatives
- 3.11.5 Carbon footprint considerations
- 3.12 Forecast assumptions & scenario analysis (Driven by Primary Research)
- 3.12.1 Base Case - Key Macro & Industry Variables Driving CAGR
- 3.12.2 Optimistic Scenarios - Favourable macro and industry tailwinds
- 3.12.3 Pessimistic Scenario - Macroeconomic slowdown or industry headwinds
Chapter 4 Competitive Landscape, 2025
- 4.1 Company market share analysis
- 4.1.1 North America
- 4.1.2 Europe
- 4.1.3 Asia Pacific
- 4.1.4 Latin America
- 4.1.5 MEA
- 4.2 Competitive analysis of major market players
- 4.3 Competitive positioning matrix
- 4.4 Key developments
- 4.4.1 Mergers & acquisitions
- 4.4.2 Partnerships & collaborations
- 4.4.3 New Product Launches
- 4.4.4 Expansion Plans and funding
- 4.5 Company Tier Benchmarking
- 4.5.1 Tier Classification Criteria & Qualifying Thresholds
- 4.5.2 Tier Positioning Matrix by Revenue, Geography & Innovation
Chapter 5 Market Estimates & Forecast, By Fuel, 2022 - 2035 ($Bn, Units)
- 5.1 Key trends
- 5.2 Diesel
- 5.3 Natural gas
- 5.4 Hybrid electric
- 5.5 Others
Chapter 6 Market Estimates & Forecast, By Application, 2022 - 2035 ($Bn, Units)
- 6.1 Key trends
- 6.2 Freight delivery
- 6.3 Utility services
- 6.4 Construction & mining
- 6.5 Others
Chapter 7 Market Estimates & Forecast, By Axle, 2022 - 2035 ($Bn, Units)
- 7.1 Key trends
- 7.2 4x2
- 7.3 6x4
- 7.4 6x2
Chapter 8 Market Estimates & Forecast, By Horsepower, 2022 - 2035 ($Bn, Units)
- 8.1 Key trends
- 8.2 Below 300HP
- 8.3 300HP - 400HP
- 8.4 400HP - 500HP
- 8.5 500HP & Above
Chapter 9 Market Estimates & Forecast, By Ownership, 2022 - 2035 ($Bn, Units)
- 9.1 Key trends
- 9.2 Fleet operator
- 9.3 Independent operator
Chapter 10 Market Estimates & Forecast, By Transmission, 2022 - 2035 ($Bn, Units)
- 10.1 Key trends
- 10.2 Manual transmission
- 10.3 Automatic transmission
Chapter 11 Market Estimates & Forecast, By Region, 2022 - 2035 ($Bn, Units)
- 11.1 Key trends
- 11.2 North America
- 11.2.1 US
- 11.2.2 Canada
- 11.3 Europe
- 11.3.1 Germany
- 11.3.2 UK
- 11.3.3 France
- 11.3.4 Italy
- 11.3.5 Spain
- 11.3.6 Russia
- 11.3.7 Nordics
- 11.4 Asia Pacific
- 11.4.1 China
- 11.4.2 India
- 11.4.3 Japan
- 11.4.4 Australia
- 11.4.5 South Korea
- 11.4.6 Philippines
- 11.4.7 Indonesia
- 11.5 Latin America
- 11.5.1 Brazil
- 11.5.2 Mexico
- 11.5.3 Argentina
- 11.6 MEA
- 11.6.1 South Africa
- 11.6.2 Saudi Arabia
- 11.6.3 UAE
Chapter 12 Company Profiles
- 12.1 Global Players
- 12.1.1 Daimler Truck
- 12.1.2 Ford Motor Company
- 12.1.3 Hino Motors
- 12.1.4 Isuzu Motors
- 12.1.5 Navistar
- 12.1.6 Scania
- 12.1.7 TRATON
- 12.1.8 Volvo Trucks
- 12.2 Regional Players
- 12.2.1 Ashok Leyland
- 12.2.2 BYD
- 12.2.3 Eicher Motor
- 12.2.4 GMC
- 12.2.5 Hyundai
- 12.2.6 JAC Motors
- 12.2.7 Kenworth
- 12.2.8 Kia
- 12.2.9 Mack Trucks
- 12.2.10 Mahindra & Mahindra
- 12.2.11 Mitsubishi Fuso Truck and Bus Corporation
- 12.2.12 Peterbilt
- 12.2.13 SML Isuzu
- 12.2.14 Tata Motors
- 12.3 Emerging Players
- 12.3.1 Dongfeng Motor
- 12.3.2 Rivian Automotive
- 12.3.3 SAIC Maxus
 中重型商用車中冷器市場-全球產業規模、佔有率、趨勢、機會與預測:按類型、引擎類型、設計類型、地區和競爭格局分類,2021-2031年
 2026年全球中重型商用車市場報告
 重型商用車市場規模、佔有率、成長和全球產業分析:按類型、應用和地區分類的洞察,以及 2026-2034 年的預測。
 7級卡車市場:依動力系統和地區分類中型商用車市場規模、佔有率、成長和全球行業分析:按類型、應用和地區的洞察,2026-2034年的預測
 8級卡車市場:按卡車類型、推進系統、變速箱、引擎功率和最終用途分類-2026-2032年全球預測全球7級卡車市場規模、佔有率、趨勢和成長分析報告(2026-2034年)全球8級卡車市場規模、佔有率、趨勢和成長分析報告(2026-2034年)中重型商用車排氣系統市場-全球產業規模、佔有率、趨勢、機會及預測(依燃料類型、後處理類型、零件類型、地區及競爭格局分類,2021-2031年)中重型商用車泵市場-全球產業規模、佔有率、趨勢、機會和預測:按泵類型、技術類型、銷售管道、地區和競爭格局分類,2021-2031年