

 |
市場調查報告書
商品編碼
2045762
浸沒式冷卻液市場商機、成長要素、產業趨勢分析及2026-2035年預測Immersion Cooling Fluids Market Opportunity, Growth Drivers, Industry Trend Analysis, and Forecast 2026 - 2035 |
||||||
2025 年全球浸沒式冷卻劑市場價值 24 億美元,預計到 2035 年將以 8.2% 的複合年成長率成長至 52 億美元。
浸沒式冷卻液透過與電子元件直接接觸,在散熱方面發揮至關重要的作用,能夠透過傳導和對流實現高效的熱傳遞。這些冷卻液在保持電絕緣性和化學穩定性的同時,也具有優異的散熱性能,確保精密設備的安全可靠運作。多種配方,包括合成和特殊介電成分,旨在實現寬廣的溫度範圍和長時間的穩定運作。日益成長的能源消耗和數位基礎設施的複雜性推動了對高效冷卻解決方案的需求。隨著計算系統變得更加緊湊和強大,傳統的冷卻方法在效率和能耗方面面臨許多限制。這種轉變正在推動浸沒式冷卻技術的應用,預計全球浸沒式冷卻液市場將持續成長。
| 市場範圍 | |
|---|---|
| 開始年份 | 2025 |
| 預測期 | 2026-2035 |
| 上市時的市場規模 | 24億美元 |
| 預計金額 | 52億美元 |
| 複合年成長率 | 8.2% |
2025年,碳氫化合物流體市場規模將達14億美元。這些流體因其成本效益和可靠的熱性能而被廣泛應用。它們與多種材料的兼容性以及較長的運作,使其適用於需要穩定性能和簡化操作流程的設施。此外,這些解決方案在滿足維護和處置等實際要求的同時,也能確保穩定運作。
預計到2025年,變壓器市場規模將達到11億美元,反映出浸沒式冷卻液在關鍵應用上的廣泛應用。對高效溫度控管日益成長的需求,推動了這些冷卻液在需要穩定介電性能和增強運行穩定性的系統中的應用。因應更高熱負荷的需求,促使各組織採用既能提高性能又能降低能耗的解決方案。這些系統有助於延長設備壽命並提高運作可靠性。
預計北美浸沒式冷卻液市場規模將從2025年的8.113億美元成長至2035年的17億美元。該地區的成長主要得益於工業應用中先進冷卻解決方案的日益普及。數位基礎設施的現代化以及對高密度運算需求的不斷成長是市場擴張的關鍵促進因素。隨著高工作負載和分散式運算環境的持續擴展,對熱穩定性解決方案的需求不斷增加,從而推動了全部區域的需求成長。
目錄
第1章:調查方法和範圍
第2章執行摘要
第3章:行業洞察
- 工業生態系分析
- 供應商情況
- 利潤率
- 每個階段增加的價值
- 影響價值鏈的因素
- 中斷
- 影響產業的因素
- 促進因素
- 高效溫度控管的需求日益成長
- 資料中心能源最佳化問題日益受到關注
- 在高密度計算領域得到更廣泛的應用
- 潛在風險和挑戰
- 初始實施和遷移成本高昂
- 對與舊硬體的兼容性問題感到擔憂
- 機會
- 高品質介電液體的化學技術開發
- 人們對永續製冷解決方案的興趣日益濃厚
- 促進因素
- 成長潛力分析
- 監理情勢
- 北美洲
- 歐洲
- 亞太地區
- 拉丁美洲
- 中東和非洲
- 波特的分析
- PESTLE分析
- 技術與創新展望
- 最新科技趨勢
- 新技術
- 價格趨勢
- 按地區
- 按流體類型
- 未來市場趨勢
- 專利趨勢
- 貿易統計
- 主要進口國
- 主要出口國
- 永續性和環境方面
- 永續發展計劃
- 減少廢棄物策略
- 生產中的能源效率
- 環保舉措
- 考慮碳足跡
第4章 競爭情勢
- 介紹
- 企業市佔率分析
- 按地區
- 北美洲
- 歐洲
- 亞太地區
- 拉丁美洲
- 中東和非洲
- 按地區
- 企業矩陣分析
- 主要市場公司的競爭分析
- 競爭定位矩陣
- 併購
- 夥伴關係和聯盟
- 新產品發布
- 業務拓展計劃
第5章 市場估算與預測:依流體類型分類,2022-2035年
- 碳氫化合物
- 礦物
- 合成
- 氟化合物
第6章 市場估計與預測:依技術分類,2022-2035年
- 單相冷卻
- 兩相冷卻
第7章 市場估計與預測:依應用領域分類,2022-2035年
- 變壓器
- 資料中心
- 電動汽車電池
- 其他
第8章 市場估計與預測:依地區分類,2022-2035年
- 北美洲
- 美國
- 加拿大
- 歐洲
- 德國
- 英國
- 法國
- 西班牙
- 義大利
- 其他歐洲國家
- 亞太地區
- 中國
- 印度
- 日本
- 澳洲
- 韓國
- 其他亞太國家
- 拉丁美洲
- 巴西
- 墨西哥
- 阿根廷
- 其他拉丁美洲國家
- 中東和非洲
- 沙烏地阿拉伯
- 南非
- 阿拉伯聯合大公國
- 其他中東和非洲國家
第9章:公司簡介
- 3M
- Cargill
- Chemie
- Chevron
- Dow
- Engineered Fluids
- Ergon, Inc.
- ExxonMobil Chemical
- Shell
- Soltex
- Valvoline
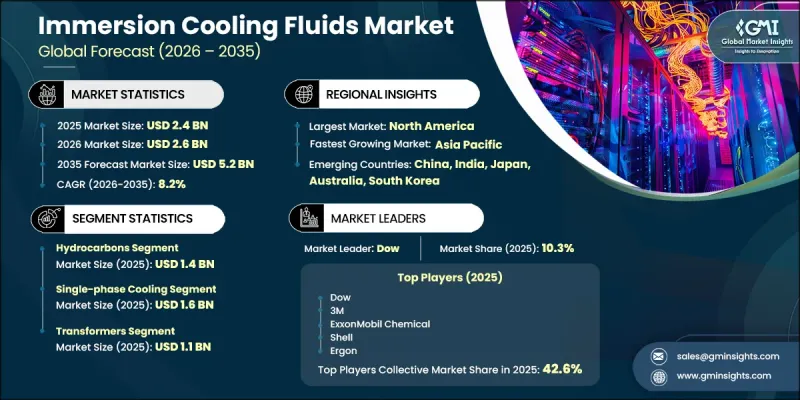
The Global Immersion Cooling Fluids Market was valued at USD 2.4 billion in 2025 and is estimated to grow at a CAGR of 8.2% to reach USD 5.2 billion by 2035.
Immersion cooling fluids play a critical role in dissipating heat by coming into direct contact with electronic components, enabling efficient heat transfer through conduction and convection. These fluids are engineered to deliver high thermal performance while maintaining electrical insulation and chemical stability, ensuring safe and reliable operation of sensitive equipment. Different formulations, including synthetic and engineered dielectric compositions, are designed to perform effectively across varying temperature ranges and extended operational periods. Increasing demand for efficient cooling solutions is being driven by rising energy consumption and the growing complexity of digital infrastructure. As computing systems become more compact and powerful, traditional cooling approaches face limitations in efficiency and energy usage. This shift is encouraging widespread adoption of immersion cooling technologies, positioning the global immersion cooling fluids market for sustained expansion.
| Market Scope | |
|---|---|
| Start Year | 2025 |
| Forecast Year | 2026-2035 |
| Start Value | $2.4 Billion |
| Forecast Value | $5.2 Billion |
| CAGR | 8.2% |
The hydrocarbons segment accounted for USD 1.4 billion in 2025. These fluids are widely adopted due to their cost efficiency and dependable thermal performance. Their compatibility with various materials and long operational lifespan makes them suitable for facilities seeking consistent performance and simplified handling processes. Additionally, these solutions support stable operations while meeting practical requirements for maintenance and disposal.
The transformers segment reached USD 1.1 billion in 2025, reflecting strong adoption of immersion cooling fluids across critical applications. Increasing demand for efficient thermal management is driving the use of these fluids in systems requiring consistent dielectric properties and enhanced operational stability. The need to manage higher thermal loads is encouraging organizations to adopt solutions that improve performance while reducing energy consumption. These systems contribute to extended equipment lifespan and improved operational reliability.
North America Immersion Cooling Fluids Market is projected to grow from USD 811.3 million in 2025 to USD 1.7 billion by 2035. Growth across the region is supported by increasing adoption of advanced cooling solutions in industrial applications. Modernization of digital infrastructure and rising demand for high-density computing are key factors influencing market expansion. The need for thermally stable solutions is increasing as advanced workloads and distributed computing environments continue to expand, reinforcing demand across the region.
Key companies operating in the Global Immersion Cooling Fluids Market include 3M, Cargill, Chemie, Chevron, Dow, Engineered Fluids, Ergon, Inc., ExxonMobil Chemical, Shell, Soltex, and Valvoline. Companies in the Global Immersion Cooling Fluids Market are strengthening their market position through innovation, strategic partnerships, and product development initiatives. Organizations are investing in research and development to enhance fluid performance, improve thermal efficiency, and ensure long-term stability. Many companies are focusing on creating solutions that meet evolving industry standards while addressing sustainability requirements. Expanding production capabilities and strengthening distribution networks are helping businesses reach a broader customer base. Collaboration with technology providers is also supporting the development of advanced cooling systems tailored to modern infrastructure needs.
Table of Contents
Chapter 1 Methodology & Scope
- 1.1 Market scope and definition
- 1.2 Research design
- 1.2.1 Research approach
- 1.2.2 Data collection methods
- 1.3 Data mining sources
- 1.3.1 Global
- 1.3.2 Regional/Country
- 1.4 Base estimates and calculations
- 1.4.1 Base year calculation
- 1.4.2 Key trends for market estimation
- 1.5 Primary research and validation
- 1.5.1 Primary sources
- 1.6 Forecast model
- 1.7 Research assumptions and limitations
Chapter 2 Executive Summary
- 2.1 Industry 360° synopsis
- 2.2 Key market trends
- 2.2.1 Fluid Type
- 2.2.2 Technology
- 2.2.3 Application
- 2.2.4 Regional
- 2.3 TAM Analysis, 2026-2035
- 2.4 CXO perspectives: Strategic imperatives
- 2.5 Future outlook and strategic recommendations
Chapter 3 Industry Insights
- 3.1 Industry ecosystem analysis
- 3.1.1 Supplier landscape
- 3.1.2 Profit margin
- 3.1.3 Value addition at each stage
- 3.1.4 Factor affecting the value chain
- 3.1.5 Disruptions
- 3.2 Industry impact forces
- 3.2.1 Growth drivers
- 3.2.1.1 Rising demand for efficient thermal management
- 3.2.1.2 Increasing data center energy optimization focus
- 3.2.1.3 Expanding use in high-density computing
- 3.2.2 Pitfalls/challenge
- 3.2.2.1 Higher initial setup and transition costs
- 3.2.2.2 Compatibility concerns with older hardware
- 3.2.3 Opportunities
- 3.2.3.1 Development of advanced dielectric fluid chemistries
- 3.2.3.2 Growing interest in sustainable cooling options
- 3.2.1 Growth drivers
- 3.3 Growth potential analysis
- 3.4 Regulatory landscape
- 3.4.1 North America
- 3.4.2 Europe
- 3.4.3 Asia Pacific
- 3.4.4 Latin America
- 3.4.5 Middle East & Africa
- 3.5 Porter's analysis
- 3.6 PESTEL analysis
- 3.7 Technology and innovation landscape
- 3.7.1 Current technological trends
- 3.7.2 Emerging technologies
- 3.8 Price trends
- 3.8.1 By region
- 3.8.2 By fluid type
- 3.9 Future market trends
- 3.10 Patent landscape
- 3.11 Trade statistics (HS code)
- 3.11.1 Major importing countries
- 3.11.2 Major exporting countries
- 3.12 Sustainability and environmental aspects
- 3.12.1 Sustainable practices
- 3.12.2 Waste reduction strategies
- 3.12.3 Energy efficiency in production
- 3.12.4 Eco-friendly initiatives
- 3.13 Carbon footprint consideration
Chapter 4 Competitive Landscape, 2025
- 4.1 Introduction
- 4.2 Company market share analysis
- 4.2.1 By region
- 4.2.1.1 North America
- 4.2.1.2 Europe
- 4.2.1.3 Asia Pacific
- 4.2.1.4 LATAM
- 4.2.1.5 MEA
- 4.2.1 By region
- 4.3 Company matrix analysis
- 4.4 Competitive analysis of major market players
- 4.5 Competitive positioning matrix
- 4.6 Key developments
- 4.6.1 Mergers & acquisitions
- 4.6.2 Partnerships & collaborations
- 4.6.3 New product launches
- 4.6.4 Expansion plans
Chapter 5 Market Estimates and Forecast, By Fluid Type, 2022-2035 (USD Billion) (Kilo Tons)
- 5.1 Key trends
- 5.2 Hydrocarbons
- 5.2.1 Mineral
- 5.2.2 Synthetic
- 5.3 Fluorocarbons
Chapter 6 Market Estimates and Forecast, By Technology, 2022-2035 (USD Billion) (Kilo Tons)
- 6.1 Key trends
- 6.2 Single-phase cooling
- 6.3 Two-phase cooling
Chapter 7 Market Estimates and Forecast, By Application, 2022-2035 (USD Billion) (Kilo Tons)
- 7.1 Key trends
- 7.2 Transformers
- 7.3 Data centre
- 7.4 EV batteries
- 7.5 Others
Chapter 8 Market Estimates and Forecast, By Region, 2022-2035 (USD Billion) (Kilo Tons)
- 8.1 Key trends
- 8.2 North America
- 8.2.1 U.S.
- 8.2.2 Canada
- 8.3 Europe
- 8.3.1 Germany
- 8.3.2 UK
- 8.3.3 France
- 8.3.4 Spain
- 8.3.5 Italy
- 8.3.6 Rest of Europe
- 8.4 Asia Pacific
- 8.4.1 China
- 8.4.2 India
- 8.4.3 Japan
- 8.4.4 Australia
- 8.4.5 South Korea
- 8.4.6 Rest of Asia Pacific
- 8.5 Latin America
- 8.5.1 Brazil
- 8.5.2 Mexico
- 8.5.3 Argentina
- 8.5.4 Rest of Latin America
- 8.6 Middle East and Africa
- 8.6.1 Saudi Arabia
- 8.6.2 South Africa
- 8.6.3 UAE
- 8.6.4 Rest of Middle East and Africa
Chapter 9 Company Profiles
- 9.1 3M
- 9.2 Cargill
- 9.3 Chemie
- 9.4 Chevron
- 9.5 Dow
- 9.6 Engineered Fluids
- 9.7 Ergon,Inc.
- 9.8 ExxonMobil Chemical
- 9.9 Shell
- 9.10 Soltex
- 9.11 Valvoline
 浸沒式冷卻液市場-全球及區域分析:按應用、產品與國家分類-分析與預測(2025-2035 年)
 浸沒式冷卻液:市場佔有率分析、產業趨勢與統計、成長預測(2026-2031)
 浸沒式冷卻液市場:按類型、部署模式、應用程式、最終用戶和銷售管道分類-2026-2032年全球市場預測
 浸沒式冷卻液市場分析及預測(至2035年):依類型、產品、服務、技術、組件、應用、材料類型、設備、部署及最終用戶分類
 全球浸沒式冷卻液市場規模、佔有率、趨勢和成長分析報告(2026-2034年)
 全球浸沒式冷卻液市場:預測(至2034年)-按類型、冷卻技術、部署方式、應用、最終用戶和地區進行分析
 2026年全球浸沒式冷卻液市場報告
 浸沒式冷卻液市場-全球產業規模、佔有率、趨勢、機會、預測:按類型、最終用戶、地區和競爭格局分類,2021-2031年
 亞太地區浸入式冷卻液市場(按應用、產品和國家)分析與預測(2024 年至 2034 年)
 歐洲浸沒式冷卻液市場(按應用、產品和國家分類)分析與預測(2024 年至 2034 年)