

 |
市場調查報告書
商品編碼
2045739
穿戴式裝置市場:商業機會、成長要素、產業趨勢分析及2026-2035年預測Wearables Market Opportunity, Growth Drivers, Industry Trend Analysis, and Forecast 2026 - 2035 |
||||||
2025年全球穿戴式裝置市場價值為835億美元,預計到2035年將以8%的複合年成長率成長至1,817億美元。
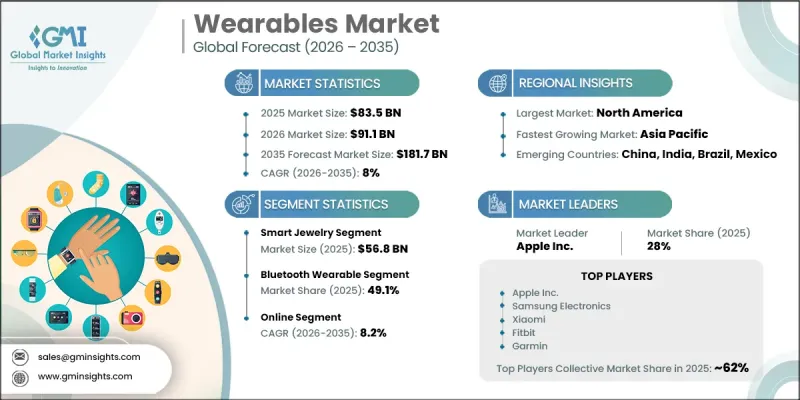
隨著消費者對健康和健身監測解決方案的需求持續成長,穿戴式裝置市場正蓬勃發展,這主要得益於感測器整合和人工智慧技術的快速進步。消費者擴大採用穿戴式技術來獲取即時數據、實現無縫連接並提升便利性。數位支付技術的普及也推動了市場擴張,因為最新的穿戴式裝置無需依賴傳統支付方式即可實現快速安全的交易。持續創新正將穿戴式產品轉變為高效能智慧的工具,以滿足消費者不斷變化的需求。諸如更佳的電池性能、更廣的通訊範圍和更強的資料隱私保護等先進功能的整合,進一步增強了這些產品的吸引力。隨著生活方式的改善、健康監測的普及以及數位技術的融合推動穿戴式裝置的發展,預計穿戴式裝置產業將在多個消費群體中持續成長。
| 市場範圍 | |
|---|---|
| 開始年份 | 2025 |
| 預測期 | 2026-2035 |
| 上市時的市場規模 | 835億美元 |
| 預測金額 | 1817億美元 |
| 複合年成長率 | 8% |
穿戴式裝置市場的發展動力源自於消費者對能夠無縫融入日常生活的緊湊型多功能解決方案日益成長的需求。消費者優先考慮將多種功能整合於單一高效外形規格,並能與數位生態系統無縫對接的設備。人工智慧系統和感測器技術的進步,正助力製造商開發出新一代穿戴式設備,進而提升使用者體驗、延長電池續航力並增強效能。這些發展為整個產業的創新和差異化創造了新的機會。
藍牙穿戴裝置市佔率高達49.1%,預計2026年至2035年將以19.2%的複合年成長率成長。該細分市場憑藉其柔軟性、健身和廣泛的設備相容性,持續保持成長勢頭。專為健康和健身應用設計的穿戴式裝置正加速普及,這得益於其性能和易用性的不斷提升。隨著對互聯健身解決方案的需求持續成長,預計該細分市場將保持強勁的成長動能。
預計2026年至2035年間,線上分銷通路將以8.2%的複合年成長率成長。電子商務平台的快速擴張提升了消費者的購物便利性,使他們能夠探索種類繁多的穿戴式產品。數位零售格局正在不斷發展,人工智慧驅動的建議和互動技術等先進的個人化功能不斷湧現,從而增強了購物體驗。這些創新正在彌合線上線下零售之間的鴻溝,並支持線上銷售的持續成長。
預計到2025年,美國穿戴式裝置市場將佔據77%的全球佔有率,市場規模將達到218億美元。推動美國市場成長的主要因素包括消費者對健康管理的日益關注、先進穿戴式技術的廣泛應用以及個人健康意識的不斷增強。持續的創新和互聯技術的不斷拓展應用也進一步刺激了市場需求。主要產業參與者的強大實力以及產品功能的持續演進,也為區域市場的擴張做出了重要貢獻。
目錄
第1章:調查方法和範圍
第2章執行摘要
第3章 行業洞察
- 產業生態系分析
- 供應商情況
- 影響價值鏈的因素
- 利潤率分析
- 中斷
- 前景
- 每個階段增加的價值
- 中斷
- 影響產業的因素
- 促進因素
- 健康監測設備的廣泛應用
- 穿戴式裝置的技術進步
- 產業潛在風險與挑戰
- 穿戴式裝置高成本
- 資料隱私和安全問題
- 機會
- 開發中國家的新興市場
- 與物聯網生態系統的整合
- 促進因素
- 成長潛力分析
- 技術與創新展望
- 最新科技趨勢
- 新興技術
- 價格趨勢和價格分析
- 對過去價格趨勢的分析
- 依球員類型分類的定價策略(高級球員、超值球員、成本加成球員)
- 價格定位:依產品類型
- 區域價格波動
- 監理情勢
- 標準和合規要求
- 資料隱私與保護法規(GDPR、HIPAA)
- 醫療設備法規(FDA、CE標誌)
- 區域監理框架
- 認證標準
- 波特的分析
- PESTLE分析
- 貿易統計
- 主要進口國
- 主要出口國
- 消費行為分析
- 購買模式
- 偏好分析
- 不同地區的消費者行為差異
- 電子商務對購買決策的影響
- 人工智慧和生成式人工智慧對市場的影響
- 利用人工智慧改造現有經營模式
- 按細分市場分類的生成式人工智慧用例和部署藍圖
- 人工智慧驅動的個人化和洞察生成
- 風險、限制和監管考量
- 基礎架構和部署狀態
- 按地區和購買者群體分類的採用率和滲透率
- 基礎設施投資的可擴展性限制和趨勢
第4章 競爭情勢
- 介紹
- 企業市佔率分析
- 按地區
- 北美洲
- 歐洲
- 亞太地區
- 中東和非洲
- 拉丁美洲
- 按地區
- 戰略展望矩陣
- 企業矩陣分析
- 主要市場公司的競爭分析
- 主要進展
- 併購
- 夥伴關係和聯盟
- 新產品發布
- 業務拓展計劃
第5章 市場估算與預測:依產品類型分類,2022-2035年
- 智慧珠寶
- 智慧型手錶
- 智慧戒指
- 智慧手環
- 其他(例如智慧項鍊)
- 健身
- 智慧褲
- 智慧襪子
- 智慧襯衫
- 帥氣的鞋子
- 其他(例如智慧腰帶)
- 健康監測設備
- 穿戴式生物感測器
- 去心房顫動
- 穿戴式心電圖監測器
- 其他(例如,連續血糖監測儀)
- 智慧眼鏡
- 擴增實境(AR)眼鏡
- 虛擬實境(VR)眼鏡
- 其他(例如混合實境(MR)眼鏡)
- 其他(例如,智慧耳機)
第6章 市場估計與預測:依技術分類,2022-2035年
- GPS穿戴裝置
- 藍牙穿戴裝置
- LTE穿戴式裝置
- 支援 Wi-Fi 的穿戴式設備
- NFC
- 其他(LoRa 穿戴式裝置等)
第7章 市場估計與預測:依價格分類,2022-2035年
- 低的
- 中等的
- 高的
第8章 市場估算與預測:依最終用途分類,2022-2035年
- 個人
- 商業的
- 辦公室
- 軍隊
- 醫護人員
- 運動與健身
- 其他(零售等)
第9章 市場估價與預測:依通路分類,2022-2035年
- 線上
- 電子商務
- 企業網站
- 離線
- 超級市場/大賣場
- 專業零售店
- 其他(例如獨立經營零售商店)
第10章 市場估價與預測:依地區分類,2022-2035年
- 北美洲
- 美國
- 加拿大
- 歐洲
- 英國
- 德國
- 法國
- 義大利
- 西班牙
- 亞太地區
- 中國
- 印度
- 日本
- 韓國
- 澳洲
- 拉丁美洲
- 巴西
- 墨西哥
- 阿根廷
- 中東和非洲
- UAE
- 沙烏地阿拉伯
- 南非
第11章:公司簡介
- Amazfit
- Apple
- Boat
- Fitbit
- Garmin
- Noise
- Oura
- Philips
- Samsung Electronics
- Sony
- Ultrahuman
- Vuzix
- Whoop
- Withings
- Xiaomi
第12章 競爭格局
- 介紹
- 企業市佔率分析
- 按地區
- 企業矩陣分析
- 主要市場公司的競爭分析
- 競爭定位矩陣
- 主要進展
- 併購
- 夥伴關係和聯盟
- 新產品發布
- 業務拓展計劃
The Global Wearables Market was valued at USD 83.5 billion in 2025 and is estimated to grow at a CAGR of 8% to reach USD 181.7 billion by 2035.
The wearable devices market is gaining momentum as demand for health and fitness monitoring solutions continues to rise alongside rapid technological progress in sensor integration and AI-driven capabilities. Consumers are increasingly adopting wearable technology that delivers real-time insights, seamless connectivity, and enhanced user convenience. The growing adoption of digital payment technologies is also contributing to market expansion, as modern wearable devices enable fast and secure transaction capabilities without reliance on traditional payment methods. Continuous innovation is transforming wearable products into highly efficient, intelligent tools that align with evolving consumer expectations. The integration of advanced features such as extended battery performance, improved connectivity range, and enhanced data privacy is further strengthening product appeal. The convergence of lifestyle enhancement, health monitoring, and digital functionality is driving widespread adoption, positioning the wearable industry for sustained growth across multiple consumer segments.
| Market Scope | |
|---|---|
| Start Year | 2025 |
| Forecast Year | 2026-2035 |
| Start Value | $83.5 Billion |
| Forecast Value | $181.7 Billion |
| CAGR | 8% |
The wearable devices market is being propelled by increasing demand for compact, multifunctional solutions that integrate effortlessly into daily life. Consumers are prioritizing devices that combine multiple functionalities within a single, efficient form factor, enabling seamless interaction with digital ecosystems. Advances in AI-based systems and sensor technologies are enabling manufacturers to develop next-generation wearables with improved operational capabilities, longer battery life, and enhanced performance. These developments are creating new opportunities for innovation and differentiation across the industry.
The Bluetooth wearable segment held a 49.1% share and is expected to grow at a CAGR of 19.2% from 2026 to 2035. This segment continues to gain traction due to its flexibility, connectivity, and compatibility with a wide range of devices. Wearables designed for health and wellness applications are witnessing accelerated adoption, supported by continuous improvements in performance and usability. The segment is expected to maintain strong growth momentum as demand for connected fitness solutions continues to increase.
The online distribution channel is projected to grow at a CAGR of 8.2% from 2026 to 2035. The rapid expansion of e-commerce platforms is enhancing accessibility and convenience for consumers, allowing them to explore a broad range of wearable products. Digital retail environments are evolving with advanced personalization features, including AI-powered recommendations and interactive technologies that enhance the shopping experience. These innovations are bridging the gap between digital and physical retail, supporting continued growth in online sales.
United States Wearables Market accounted for 77% share in 2025, generating USD 21.8 billion. Market growth in the country is driven by increasing consumer focus on health tracking, rising adoption of advanced wearable technologies, and growing awareness of personal wellness. Continuous innovation, combined with expanding applications of connected technologies, is further supporting demand. The strong presence of leading industry players and ongoing advancements in product capabilities are contributing significantly to regional market expansion.
Key companies operating in the Global Wearables Market include Samsung Electronics, Apple, Xiaomi, Garmin, Fitbit, Sony, Philips, Noise, Boat, Oura, Whoop, Withings, Ultrahuman, and Vuzix. Companies in the Wearables Market are adopting a range of strategic initiatives to strengthen their competitive positioning. Organizations are focusing on continuous product innovation by integrating advanced sensors, AI capabilities, and enhanced connectivity features into their devices. Strategic partnerships and collaborations are being pursued to expand technological expertise and accelerate product development. Companies are also investing in digital ecosystems and software platforms to deliver personalized user experiences and increase customer engagement. Expansion of online distribution channels and direct-to-consumer strategies is improving market reach and accessibility.
Table of Contents
Chapter 1 Methodology and Scope
- 1.1 Market scope and definition
- 1.2 Research design
- 1.2.1 Research approach
- 1.2.2 Data collection methods
- 1.3 Data mining sources
- 1.3.1 Global
- 1.3.2 Regional/Country
- 1.4 Base estimates and calculations
- 1.4.1 Base year calculation
- 1.4.2 Key trends for market estimation
- 1.5 Primary research and validation
- 1.5.1 Primary sources
- 1.6 Forecast model
- 1.7 Research assumptions and limitations
Chapter 2 Executive Summary
- 2.1 Industry 360° synopsis
- 2.2 Key market trends
- 2.2.1 Regional
- 2.2.2 Product Type
- 2.2.3 Technology
- 2.2.4 Price
- 2.2.5 End Use
- 2.2.6 Distribution Channel
Chapter 3 Industry Insights
- 3.1 Industry ecosystem analysis
- 3.1.1 Supplier landscape
- 3.1.2 Factor affecting the value chain
- 3.1.3 Profit margin analysis
- 3.1.4 Disruptions
- 3.1.5 Future outlook
- 3.1.6 Value addition at each stage
- 3.1.7 Distributors
- 3.2 Industry Impact forces
- 3.2.1 Growth drivers
- 3.2.1.1 Increased adoption of health monitoring devices
- 3.2.1.2 Technological advancements in wearable devices
- 3.2.2 Industry pitfalls & challenges
- 3.2.2.1 High cost of wearable devices
- 3.2.2.2 Data privacy and security concerns
- 3.2.3 Opportunities
- 3.2.3.1 Emerging markets in developing economies
- 3.2.3.2 Integration with IoT ecosystems
- 3.2.1 Growth drivers
- 3.3 Growth potential analysis
- 3.4 Technology and innovation landscape
- 3.4.1 Current technological trends
- 3.4.2 Emerging technologies
- 3.5 Price trends Pricing Analysis (Driven by Primary Research)
- 3.5.1 Historical Price Trend Analysis (Driven by Primary Research)
- 3.5.2 Pricing Strategy by Player Type (Premium / Value / Cost-plus) (Driven by Primary Research)
- 3.5.3 Price Positioning by Product Category
- 3.5.4 Regional Price Variations
- 3.6 Regulatory landscape
- 3.6.1 Standards and compliance requirements
- 3.6.2 Data Privacy & Protection Regulations (GDPR, HIPAA)
- 3.6.3 Medical Device Regulations (FDA, CE Mark)
- 3.6.4 Regional regulatory frameworks
- 3.6.5 Certification standards
- 3.7 Porter's analysis
- 3.8 PESTEL analysis
- 3.9 Trade statistics (HS code)
- 3.9.1 Major importing countries
- 3.9.2 Major exporting countries
- 3.10 Consumer behaviour analysis
- 3.10.1 Purchasing patterns
- 3.10.2 Preference analysis
- 3.10.3 Regional variations in consumer behaviour
- 3.10.4 Impact of e-commerce on buying decisions
- 3.11 Impact of AI & Generative AI on the Market
- 3.11.1 AI-Driven Disruption of Existing Business Models
- 3.11.2 GenAI Use Cases & Adoption Roadmap by Segment
- 3.11.3 AI-Powered Personalization & Insights Generation
- 3.11.4 Risks, Limitations & Regulatory Considerations
- 3.12 Infrastructure & Deployment Landscape (Driven by Primary Research)
- 3.12.1 Deployment Penetration by Region & Buyer Segment (Driven by Primary Research)
- 3.12.2 Scalability Constraints & Infrastructure Investment Trends (Driven by Primary Research)
Chapter 4 Competitive Landscape, 2025
- 4.1 Introduction
- 4.2 Company market share analysis
- 4.2.1 By region
- 4.2.1.1 North America
- 4.2.1.2 Europe
- 4.2.1.3 Asia Pacific
- 4.2.1.4 Middle East & Africa
- 4.2.1.5 Latin America
- 4.2.1 By region
- 4.3 Strategic outlook matrix
- 4.4 Company matrix analysis
- 4.5 Competitive analysis of major market players
- 4.6 Key developments
- 4.6.1 Mergers & acquisitions
- 4.6.2 Partnerships & collaborations
- 4.6.3 New Product Launches
- 4.6.4 Expansion Plans
Chapter 5 Market Estimates & Forecast, By Product Type, 2022 - 2035 ($Billion, Million Units)
- 5.1 Key trends
- 5.2 Smart jewelry
- 5.2.1 Smartwatch
- 5.2.2 Smart ring
- 5.2.3 Smart bracelet
- 5.2.4 Others (smart necklaces etc.)
- 5.3 Fitness apparel
- 5.3.1 Smart pants
- 5.3.2 Smart socks
- 5.3.3 Smart shirt
- 5.3.4 Smart shoes
- 5.3.5 Others (smart belt etc.)
- 5.4 Health monitoring devices
- 5.4.1 Wearable biosensors
- 5.4.2 Wearable defibrillators
- 5.4.3 Wearable ECG monitors
- 5.4.4 Others (continuous glucose monitors etc.)
- 5.5 Smart glasses
- 5.5.1 Augmented reality glasses
- 5.5.2 Virtual reality glasses
- 5.5.3 Others (mixed reality glasses etc.)
- 5.6 Others (smart hearables etc.)
Chapter 6 Market Estimates & Forecast, By Technology, 2022 - 2035 ($Billion, Million Units)
- 6.1 Key trends
- 6.2 GPS wearable
- 6.3 Bluetooth wearable
- 6.4 LTE wearable
- 6.5 Wi-Fi wearable
- 6.6 NFC
- 6.7 Others (LoRa wearable etc.)
Chapter 7 Market Estimates & Forecast, By Price, 2022 - 2035 ($Billion, Million Units)
- 7.1 Key trends
- 7.2 Low
- 7.3 Medium
- 7.4 High
Chapter 8 Market Estimates & Forecast, By End Use, 2022 - 2035 ($Billion, Million Units)
- 8.1 Key trends
- 8.2 Individual
- 8.3 Commercial
- 8.3.1 Offices
- 8.3.2 Military forces
- 8.3.3 Medical professionals
- 8.3.4 Sports and fitness
- 8.3.5 Others (retail etc.)
Chapter 9 Market Estimates & Forecast, By Distribution Channel, 2022 - 2035 ($Billion, Million Units)
- 9.1 Key trends
- 9.2 Online
- 9.2.1 E-commerce
- 9.2.2 Company websites
- 9.3 Offline
- 9.3.1 Supermarkets/hypermarket
- 9.3.2 Specialty retail stores
- 9.3.3 Others (independent retailer etc.)
Chapter 10 Market Estimates & Forecast, By Region, 2022-2035 ($Billion, Million Units)
- 10.1 Key trends
- 10.2 North America
- 10.2.1 U.S.
- 10.2.2 Canada
- 10.3 Europe
- 10.3.1 UK
- 10.3.2 Germany
- 10.3.3 France
- 10.3.4 Italy
- 10.3.5 Spain
- 10.4 Asia Pacific
- 10.4.1 China
- 10.4.2 India
- 10.4.3 Japan
- 10.4.4 South Korea
- 10.4.5 Australia
- 10.5 Latin America
- 10.5.1 Brazil
- 10.5.2 Mexico
- 10.5.3 Argentina
- 10.6 MEA
- 10.6.1 UAE
- 10.6.2 Saudi Arabia
- 10.6.3 South Africa
Chapter 11 Company Profiles
- 11.1 Amazfit
- 11.2 Apple
- 11.3 Boat
- 11.4 Fitbit
- 11.5 Garmin
- 11.6 Noise
- 11.7 Oura
- 11.8 Philips
- 11.9 Samsung Electronics
- 11.10 Sony
- 11.11 Ultrahuman
- 11.12 Vuzix
- 11.13 Whoop
- 11.14 Withings
- 11.15 Xiaomi
Chapter 12 Competitive Landscape, 2025
- 12.1 Introduction
- 12.2 Company market share analysis
- 12.2.1 By region
- 12.2.1.1 North America
- 12.2.1.2 Europe
- 12.2.1.3 Asia Pacific
- 12.2.1.4 Latin America
- 12.2.1.5 Middle East and Africa
- 12.2.1 By region
- 12.3 Company matrix analysis
- 12.4 Competitive analysis of major market players
- 12.5 Competitive positioning matrix
- 12.6 Key developments
- 12.6.1 Mergers & acquisitions
- 12.6.2 Partnerships & collaborations
- 12.6.3 New product launches
- 12.6.4 Expansion plans
 穿戴式材料市場:商業機會、成長要素、產業趨勢分析及2026-2035年預測
 2034年穿戴式裝置人工智慧市場預測:按產品、組件、部署模式、應用和區域分類的全球分析
 2026年全球運動心理服務市場報告
 穿戴式材料市場規模、佔有率和成長分析:按材料類型、技術、應用、最終用戶和地區分類-2026-2033年產業預測
 全球穿戴式材料市場規模、佔有率、趨勢和成長分析報告(2026-2034年)
 人工智慧穿戴裝置市場按產品類型、應用和消費者分類-2026-2032年全球預測AI眼鏡市場:2025-2030年全球預測(按用戶互動模式、電源、連接性、應用和分銷管道)智慧眼鏡市場按類型、組件、連接性、設計、輸入介面和分銷管道分類—全球預測,2025-2030 年
 2025-2029年全球智慧穿戴健身及運動設備及服務市場
 2025-2029年穿戴式裝置全球市場