


 |
市場調查報告書
商品編碼
2038781
壓力釋放閥市場機會、成長要素、產業趨勢分析及2026-2035年預測。Pressure Relief Valve Market Opportunity, Growth Drivers, Industry Trend Analysis, and Forecast 2026 - 2035 |
||||||

2025年全球壓力釋放閥市場價值為81億美元,預計到2035年將以5.5%的複合年成長率成長至139億美元。
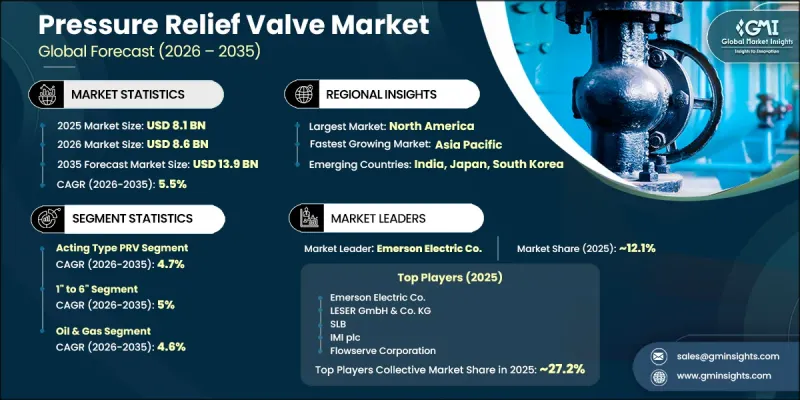
市場成長主要受石油天然氣、化學和發電等高風險行業對可靠的安全和壓力控制系統的需求不斷成長所驅動。這些行業在極端壓力條件下運行,控制和釋放過壓對於確保運行安全和設備完整性至關重要。探勘活動的擴大、煉油廠的維修以及新建工業設施進一步增加了對先進洩壓系統的需求。
| 市場範圍 | |
|---|---|
| 開始年份 | 2025 |
| 預測期 | 2026-2035 |
| 上市時的市場規模 | 81億美元 |
| 預測金額 | 139億美元 |
| 複合年成長率 | 5.5% |
工業化的進步和製程工業產能的持續擴張,正顯著推動市場對高耐久性和高性能洩壓閥的需求成長。操作人員越來越重視那些即使在嚴苛條件下也能提供長期可靠性、符合法規要求且運作性能穩定的閥門。全球市場日益嚴格的工業安全法規進一步加速了洩壓系統在關鍵應用上的普及。此外,工業自動化和智慧製程控制系統的日益普及,也催生了對高精度壓力調節技術的新需求。在自動化生產環境中,精確的壓力管理對於維持效率和避免系統故障至關重要,這進一步促進了該產品在多個終端應用產業的應用。
預計到2025年,電動洩壓閥市場規模將達到45億美元,並在2026年至2035年間以4.7%的複合年成長率成長。該細分市場在維護系統安全和控制工業流程中的過壓方面發揮著至關重要的作用,因此是推動市場成長的主要動力。這些閥門的設計使其能夠在壓力超過安全限值時自動動作,確保即時釋放壓力並防止設備損壞。其快速反應能力、運作可靠性和對寬壓力範圍的適應性使其廣泛應用於石油天然氣、化學和發電等行業。隨著安全標準合規性和運作效率重要性的不斷提高,全球對電動洩壓閥的需求持續成長。
預計到2025年,石油和天然氣產業將佔據38%的市場佔有率,並在2035年之前以4.6%的複合年成長率成長。該行業的主導地位源於探勘、鑽井、煉油和運輸作業中對壓力控制的迫切需求。壓力釋放閥在維持管道、加工廠和海上設施等高壓環境的安全運作方面發揮著至關重要的作用。上游和下游產業的投資增加,以及日益嚴格的安全法規,正在推動需求的持續成長。該行業固有的高營運風險和嚴格的合規要求進一步鞏固了石油和天然氣應用在全球市場的主導地位。
預計到2025年,北美壓力安全閥市場規模將達到5.638億美元,並在2026年至2035年間以5.6%的複合年成長率成長。該地區的需求主要受石油天然氣、化學和發電行業嚴格的安全標準所驅動。工業設施需要可靠的壓力控制系統,以確保即使在高壓波動的情況下也能安全運作。頁岩氣生產和煉油活動的需求尤其突出,因為這些產業的設備必須能夠承受波動的壓力負荷。該地區的製造商正致力於採用先進材料、精密工程技術並遵守ASME標準。此外,老舊基礎設施的持續維護和更新也顯著促進了市場需求的持續成長。
全球壓力釋放閥市場的主要參與者包括艾默生電氣、福斯公司、Honeywell國際公司、派克霍尼芬公司、IMI plc、斯派萊薩科工程公司、Crane Ltd.、濱特爾公司、SLB、LESER GmbH & Co. KG、Rotok plc、布克特流體控制系統公司、穆格公司、閥門技術有限公司。這些市場新進業者正透過持續的產品創新來鞏固其市場地位,其創新重點在於提高產品的耐用性、反應速度和運作安全性。他們正加大對智慧閥門技術的投資,並將之與數位監控系統結合,以實現預測性維護和即時壓力追蹤。擴大生產能力和全球分銷網路也是拓展市場覆蓋範圍的關鍵策略。各公司在開發針對特定工業應用的客製化解決方案的同時,也著重符合國際安全標準。與EPC承包商和工業開發商建立策略夥伴關係,有助於專案整合和長期合約的簽訂。
目錄
第1章:調查方法和範圍
第2章執行摘要
第3章業界考察
- 生態系分析
- 供應商情況
- 利潤率
- 每個階段增加的價值
- 影響價值鏈的因素
- 影響產業的因素
- 促進因素
- 石油天然氣、化工和發電業的需求增加。
- 工業自動化和流程最佳化方面的成長
- 擴大用水和污水基礎設施
- 陷阱與挑戰
- 高維護成本和定期檢查要求
- 鋼鐵和合金等原物料價格波動
- 機會
- 擴大具備即時監控功能的智慧閥門的應用
- 可再生能源和氫能基礎設施的成長
- 促進因素
- 成長潛力分析
- 未來市場趨勢
- 科技與創新趨勢
- 當前技術趨勢
- 新興技術
- 監理情勢
- 標準和合規要求
- 區域法規結構
- 認證標準
- 波特五力分析
- PESTEL 分析
- 價格分析(基於初步調查)
- 對過去價格趨勢的分析(基於初步研究)
- 根據業務類型分類的定價策略(高階/價值/成本加成)(基於初步調查)
- 價格差異取決於材料成分
- 區域價格波動和關稅的影響
- 貿易資料分析(HS編碼848140)(基於付費資料庫)
- 進出口量和進口額趨勢(基於付費資料庫)
- 主要貿易路線及關稅的影響(基於付費資料庫)
- 區域貿易平衡
- HS編碼分類及其對貿易政策的影響
- 人工智慧和生成式人工智慧對市場的影響
- 利用人工智慧改造現有經營模式
- 針對特定領域的生成式人工智慧應用案例和實施藍圖
- 風險、限制和監管考量
- 生產能力和生產趨勢(基於初步調查)
- 按地區和主要生產商分類的運作能力(基於初步調查)
- 運轉率和擴張計劃(基於初步調查)
第4章 競爭情勢
- 介紹
- 企業市佔率分析
- 按地區
- 企業矩陣分析
- 主要市場公司的競爭分析
- 競爭定位矩陣
- 主要進展
- 併購
- 夥伴關係與合作
- 新產品發布
- 業務拓展計劃
第5章 市場估計與預測:依類型分類,2022-2035年
- 驅動式減壓閥
- 活塞式減壓閥
- 隔膜式壓力釋放閥
第6章 市場規模估算與預測(2022-2035年)
- 小於1英寸
- 1英寸至6英寸
- 6英寸至25英寸
- 25英寸至50英寸
- 50吋或更大
第7章 市場估計與預測:依壓力範圍分類,2022-2035年
- 低氣壓(5毫巴至3000毫巴)
- 中壓(50 巴或以下)
- 高壓(400 巴或以下)
第8章 市場估算與預測:依最終使用者分類,2022-2035年
- 石油和天然氣
- 用水和污水處理
- 電力業
- 化工
- 其他
第9章 市場估價與預測:依銷售管道分類,2022-2035年
- 直銷
- 間接銷售
第10章 市場估價與預測:依地區分類,2022-2035年
- 北美洲
- 美國
- 加拿大
- 歐洲
- 德國
- 英國
- 法國
- 義大利
- 西班牙
- 亞太地區
- 中國
- 印度
- 日本
- 韓國
- 澳洲
- 拉丁美洲
- 巴西
- 墨西哥
- 阿根廷
- 中東和非洲(MEA)
- 沙烏地阿拉伯
- 阿拉伯聯合大公國
- 南非
第11章:公司簡介
- Burkert Fluid Control Systems
- Crane Co
- Emerson Electric Co.
- Flowserve Corporation
- Honeywell International
- IMI plc
- LESER GmbH & Co. KG
- Moog Inc
- Parker Hannifin Corporation
- Pentair plc
- Rotork Plc
- SLB
- Spirax-Sarco Engineering
- ValvTechnologies Inc
- Watts Water Technologies
The Global Pressure Relief Valve Market was valued at USD 8.1 billion in 2025 and is estimated to grow at a CAGR of 5.5% to reach USD 13.9 billion by 2035.
Market growth is supported by the rising need for reliable safety and pressure control systems across high-risk industries such as oil & gas, chemicals, and power generation. These sectors operate under extreme pressure conditions where controlled release of excess pressure is essential to ensure operational safety and equipment integrity. Expansion in exploration activities, refinery upgrades, and new industrial facility installations is further increasing the requirement for advanced pressure relief systems.
| Market Scope | |
|---|---|
| Start Year | 2025 |
| Forecast Year | 2026-2035 |
| Start Value | $8.1 Billion |
| Forecast Value | $13.9 Billion |
| CAGR | 5.5% |
Rising industrialization and continuous capacity additions in process industries are significantly boosting demand for durable and high-performance pressure relief valves. Operators are increasingly prioritizing valves that deliver long-term reliability, regulatory compliance, and consistent operational performance under demanding conditions. The tightening of industrial safety regulations across global markets has further accelerated installation rates of pressure relief systems in critical applications. In addition, the growing adoption of industrial automation and smart process control systems is creating new demand for precision-based pressure regulation technologies. Automated production environments require highly accurate pressure management to maintain efficiency and avoid system failures, which is further reinforcing product adoption across multiple end-use industries.
The acting type pressure relief valve segment accounted for USD 4.5 billion in 2025 and is expected to grow at a CAGR of 4.7% from 2026 to 2035. This segment leads the market due to its essential role in maintaining system safety and controlling excess pressure across industrial operations. These valves are designed to automatically activate when pressure exceeds safe limits, ensuring immediate release and preventing equipment damage. Their fast response capability, operational reliability, and adaptability across different pressure ranges make them widely used in industries such as oil & gas, chemical processing, and power generation. Increasing emphasis on safety compliance and operational efficiency continues to strengthen demand for acting type pressure relief valves globally.
The oil & gas segment held a 38% share in 2025 and is projected to grow at a CAGR of 4.6% through 2035. This segment dominates due to the critical need for pressure control in exploration, drilling, refining, and transportation operations. Pressure relief valves play a vital role in maintaining safe operating conditions in high-pressure environments such as pipelines, processing facilities, and offshore installations. Rising upstream and downstream investments, combined with stringent safety regulations, are driving continuous demand. The inherently high operational risk in this sector, along with strict compliance requirements, further reinforces the dominance of oil & gas applications in the global market.
North America Pressure Relief Valve Market accounted for USD 563.8 million in 2025 and is expected to grow at a CAGR of 5.6% from 2026 to 2035. Demand in the country is driven by strict safety standards across oil & gas, chemical processing, and power generation industries. Industrial facilities require highly reliable pressure control systems to ensure safe operations under fluctuating and high-pressure conditions. Strong demand is particularly evident in shale production and refining activities, where equipment must withstand variable pressure loads. Manufacturers in the region focus on advanced materials, precision engineering, and compliance with ASME standards. Additionally, ongoing maintenance and replacement of aging infrastructure significantly contribute to sustained market demand.
The key companies operating in the Global Pressure Relief Valve Market include Emerson Electric Co., Flowserve Corporation, Honeywell International, Parker Hannifin Corporation, IMI plc, Spirax-Sarco Engineering, Crane Co., Pentair plc, SLB, LESER GmbH & Co. KG, Rotork Plc, Burkert Fluid Control Systems, Moog Inc., ValvTechnologies Inc., and Watts Water Technologies. Market players are strengthening their positions through continuous product innovation focused on improving durability, response accuracy, and operational safety. Companies are increasingly investing in smart valve technologies integrated with digital monitoring systems to enable predictive maintenance and real-time pressure tracking. Expansion of manufacturing capabilities and global distribution networks is also a key strategy to enhance market reach. Firms are focusing on compliance with international safety standards while developing customized solutions for specific industrial applications. Strategic partnerships with EPC contractors and industrial operators are helping improve project integration and long-term contracts.
Table of Contents
Chapter 1 Methodology & Scope
- 1.1 Market scope and definition
- 1.2 Research design
- 1.2.1 Research approach
- 1.2.2 Data collection methods
- 1.3 Data mining sources
- 1.3.1 Global
- 1.3.2 Regional/Country
- 1.4 Base estimates and calculations
- 1.4.1 Base year calculation
- 1.4.2 Key trends for market estimation
- 1.5 Primary research and validation
- 1.5.1 Primary sources
- 1.6 Forecast model
- 1.7 Research assumptions and limitations
Chapter 2 Executive Summary
- 2.1 Industry 360° synopsis
- 2.2 Key market trends
- 2.2.1 Regional
- 2.2.2 Type
- 2.2.3 Size
- 2.2.4 Pressure Range
- 2.2.5 End User
- 2.2.6 Distribution channel
Chapter 3 Industry Insights
- 3.1 Industry ecosystem analysis
- 3.1.1 Supplier landscape
- 3.1.2 Profit margin
- 3.1.3 Value addition at each stage
- 3.1.4 Factor affecting the value chain
- 3.2 Industry impact forces
- 3.2.1 Growth drivers
- 3.2.1.1 Increasing demand from oil & gas, chemical, and power generation industries
- 3.2.1.2 Growth in industrial automation and process optimization
- 3.2.1.3 Expansion of water and wastewater treatment infrastructure
- 3.2.2 Pitfalls & Challenges
- 3.2.2.1 High maintenance and periodic inspection requirements
- 3.2.2.2 Volatility in raw material prices such as steel and alloys
- 3.2.3 Opportunities
- 3.2.3.1 Rising adoption of smart valves with real-time monitoring capabilities
- 3.2.3.2 Growth of renewable energy and hydrogen infrastructure
- 3.2.1 Growth drivers
- 3.3 Growth potential analysis
- 3.4 Future market trends
- 3.5 Technology and innovation landscape
- 3.5.1 Current technological trends
- 3.5.2 Emerging technologies
- 3.6 Regulatory landscape
- 3.6.1 Standards and compliance requirements
- 3.6.2 Regional regulatory frameworks
- 3.6.3 Certification standards
- 3.7 Porter's analysis
- 3.8 PESTEL analysis
- 3.9 Pricing analysis (driven by primary research)
- 3.9.1 Historical price trend analysis (driven by primary research)
- 3.9.2 Pricing strategy by player type (premium / value / cost-plus) (driven by primary research)
- 3.9.3 Price differential by material construction
- 3.9.4 Regional price variations & tariff impact
- 3.10 Trade data analysis (HS code 848140) (driven by paid database)
- 3.10.1 Import/export volume and value trends (driven by paid database)
- 3.10.2 Key trade corridors and tariff impact (driven by paid database)
- 3.10.3 Trade balance by region
- 3.10.4 HS code classification and trade policy impact
- 3.11 Impact of AI and generative AI on the market
- 3.11.1 AI-driven disruption of existing business models
- 3.11.2 GenAI use cases and adoption roadmap by segment
- 3.11.3 Risks, limitations and regulatory considerations
- 3.12 Capacity and production landscape (driven by primary research)
- 3.12.1 Installed capacity by region and key producer (driven by primary research)
- 3.12.2 Capacity utilization rates and expansion pipelines (driven by primary research)
Chapter 4 Competitive Landscape, 2025
- 4.1 Introduction
- 4.2 Company market share analysis
- 4.2.1 By Region
- 4.2.1.1 North America
- 4.2.1.2 Europe
- 4.2.1.3 Asia Pacific
- 4.2.1.4 Latin America
- 4.2.1.5 Middle East & Africa
- 4.2.1 By Region
- 4.3 Company matrix analysis
- 4.4 Competitive analysis of major market players
- 4.5 Competitive positioning matrix
- 4.6 Key developments
- 4.6.1 Mergers & acquisitions
- 4.6.2 Partnerships & collaborations
- 4.6.3 New product launches
- 4.6.4 Expansion plans
Chapter 5 Market Estimates & Forecast, By Type, 2022 - 2035, (USD Billion) (Thousand Units)
- 5.1 Key trends
- 5.2 Acting Type PRV
- 5.3 Piston Type PRV
- 5.4 Diaphragm Type PRV
Chapter 6 Market Estimates & Forecast, By Size, 2022 - 2035, (USD Billion) (Thousand Units)
- 6.1 Key trends
- 6.2 Up to 1"
- 6.3 1" to 6"
- 6.4 6" to 25"
- 6.5 25" to 50"
- 6.6 50" and Larger
Chapter 7 Market Estimates & Forecast, By Pressure Range, 2022 - 2035, (USD Billion) (Thousand Units)
- 7.1 Key trends
- 7.2 Low (5 mbar to 3000 mbar)
- 7.3 Medium (Up to 50 bar)
- 7.4 High (Up to 400 bar)
Chapter 8 Market Estimates & Forecast, By End User, 2022 - 2035, (USD Billion) (Thousand Units)
- 8.1 Key trends
- 8.2 Oil & Gas
- 8.3 Water & Wastewater Treatment
- 8.4 Power Industry
- 8.5 Chemical Industry
- 8.6 Others
Chapter 9 Market Estimates & Forecast, By Distribution Channel, 2022 - 2035, (USD Billion) (Thousand Units)
- 9.1 Key trends
- 9.2 Direct Sales
- 9.3 Indirect Sales
Chapter 10 Market Estimates & Forecast, By Region, 2022 - 2035, (USD Billion) (Thousand Units)
- 10.1 Key trends
- 10.2 North America
- 10.2.1 U.S.
- 10.2.2 Canada
- 10.3 Europe
- 10.3.1 Germany
- 10.3.2 UK
- 10.3.3 France
- 10.3.4 Italy
- 10.3.5 Spain
- 10.4 Asia Pacific
- 10.4.1 China
- 10.4.2 India
- 10.4.3 Japan
- 10.4.4 South Korea
- 10.4.5 Australia
- 10.5 Latin America
- 10.5.1 Brazil
- 10.5.2 Mexico
- 10.5.3 Argentina
- 10.6 MEA
- 10.6.1 Saudi Arabia
- 10.6.2 UAE
- 10.6.3 South Africa
Chapter 11 Company Profiles
- 11.1 Burkert Fluid Control Systems
- 11.2 Crane Co
- 11.3 Emerson Electric Co.
- 11.4 Flowserve Corporation
- 11.5 Honeywell International
- 11.6 IMI plc
- 11.7 LESER GmbH & Co. KG
- 11.8 Moog Inc
- 11.9 Parker Hannifin Corporation
- 11.10 Pentair plc
- 11.11 Rotork Plc
- 11.12 SLB
- 11.13 Spirax-Sarco Engineering
- 11.14 ValvTechnologies Inc
- 11.15 Watts Water Technologies

 小型洩壓閥市場:全球市場預測,2026-2032年線上壓力安全閥市場:全球市場預測(2026-2032年)低雜訊先導式電磁控制保險閥市場:全球市場預測,2026-2032年
 全球壓力保險閥:市場佔有率分析、產業趨勢與統計及成長預測(2026-2031)
 比例式保險閥市場規模、佔有率和成長分析:按閥型、驅動方式、應用、最終用戶、額定壓力和地區分類-2026-2033年產業預測
 真空保險閥(VRV)市場規模、佔有率和成長分析:按閥門類型、材質、應用、最終用戶和地區分類-2026-2033年產業預測
 2026年全球壓力保險閥市場報告
 壓力釋放閥市場 - 全球產業規模、佔有率、趨勢、機會、預測:按類型、分銷管道、地區和競爭格局分類,2021-2031年
 壓力保險閥市場規模、佔有率和成長分析(按產品類型、閥門尺寸、設定壓力、材質、最終用戶和地區分類)-產業預測,2026-2033年
 壓力保險閥市場:2025-2030 年預測