


 |
市場調查報告書
商品編碼
2038773
天然螯合劑市場:商業機會、成長要素、產業趨勢分析及2026-2035年預測Natural Chelating Agents Market Opportunity, Growth Drivers, Industry Trend Analysis, and Forecast 2026 - 2035 |
||||||

2025年全球天然螯合劑市值為31億美元,預計2035年將以5.9%的複合年成長率成長至55億美元。
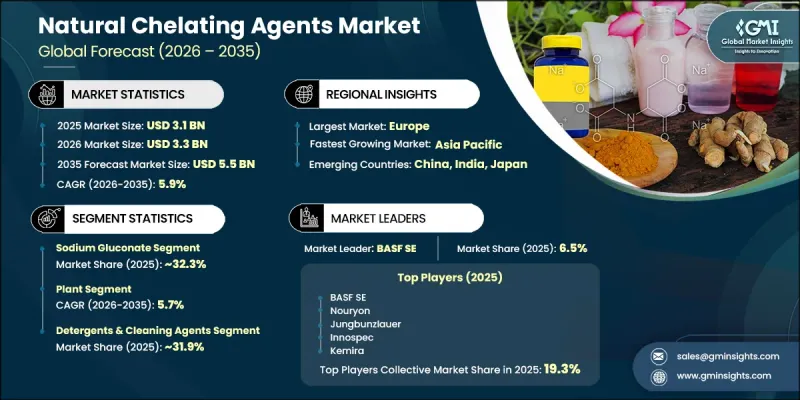
隨著各行各業紛紛轉向永續基和環保的化學解決方案,天然螯合劑市場正蓬勃發展。天然螯合劑源自可再生資源,旨在與金屬離子結合,從而實現金屬離子的穩定性、去除或中和。這些化合物廣泛應用於農業、水處理、個人保健產品和工業清洗等領域。它們的主要功能是與鈣、鎂、鐵和其他重金屬結合,這些重金屬會導致水垢、腐蝕和毒性等問題。日益增強的環保意識和對合成螯合劑日益嚴格的監管正在加速天然來源替代品的普及。天然螯合劑具有高生物分解性和低毒性,使其成為優於傳統合成產品的理想選擇。此外,它們還具有提高清潔效率、改善土壤品質和促進有效水淨化等優點,進一步推動了市場需求。全球終端用戶產業對環保成分和永續工業實踐的日益偏好也是推動市場發展的重要因素。
| 市場範圍 | |
|---|---|
| 開始年份 | 2025 |
| 預測期 | 2026-2035 |
| 上市時的市場規模 | 31億美元 |
| 預測金額 | 55億美元 |
| 複合年成長率 | 5.9% |
預計到2025年,葡萄糖酸鈉市佔率將達到32.3%,並將在2035年之前以5%的複合年成長率成長。該產品因其成本效益高、性能穩定且適用於大規模工業應用而持續廣泛應用。其與鹼性環境的高相容性和可靠的螯合性能也使其在眾多終端用戶產業中持續應用。
預計到2025年,植物來源產品將佔據43.1%的市場佔有率,並在2035年之前以5.7%的複合年成長率成長。該領域擁有成熟的農業採購系統和相對較低的生產成本,使其成為廣泛應用的生產方式。然而,它也受到原料供應波動和其他生質能應用領域的競爭的影響。儘管如此,由於其永續性優勢,植物來源解決方案仍然是市場擴張的主要驅動力。
預計2025年,北美天然螯合劑市佔率將達27%。該地區的成長主要得益於消費者對環保清潔和個人保健產品需求的不斷成長。日益增強的環保意識以及對合成化學品使用日益嚴格的監管,進一步推動了市場滲透。此外,天然螯合劑在食品加工和水處理產業的應用不斷拓展,也促進了該地區市場的穩定成長。
目錄
第1章:調查方法和範圍
第2章執行摘要
第3章業界考察
- 生態系分析
- 供應商情況
- 利潤率
- 每個階段增加的價值
- 影響價值鏈的因素
- 中斷
- 影響產業的因素
- 促進因素
- 產業潛在風險與挑戰
- 市場機遇
- 成長潛力分析
- 監理情勢
- 波特五力分析
- PESTEL 分析
- 價格趨勢
- 按地區
- 按類型
- 未來市場趨勢
- 科技與創新趨勢
- 當前技術趨勢
- 新興技術
- 專利趨勢
- 貿易統計(HS編碼)
- 主要進口國
- 主要出口國
- 永續性和環境方面
- 永續計劃
- 減少廢棄物策略
- 生產中的能源效率
- 具有環保意識的舉措
- 考慮碳足跡
第4章 競爭情勢
- 介紹
- 企業市佔率分析
- 按地區
- 北美洲
- 歐洲
- 亞太地區
- 拉丁美洲
- 中東和非洲(MEA)
- 按地區
- 企業矩陣分析
- 主要市場公司的競爭分析
- 競爭定位矩陣
- 主要進展
- 併購
- 夥伴關係與合作
- 新產品發布
- 業務拓展計劃
第5章 市場估價與預測:依產品分類,2022-2035年
- 葡萄糖酸鈉
- 乙二胺二琥珀酸酯(EDDS)
- 麩胺酸酸酯(GLDA)
- 亞氨基二琥珀酸(IDSA)
- 甲基甘氨酸二乙酸酯(MGDA)
- 其他(N-二乙酸四鈉鹽(ASDA)、葡庚酸鹽)
第6章 市場估計與預測:依來源分類,2022-2035年
- 植物
- 微生物發酵
- 利用生物基原料進行化學合成
第7章 市場估計與預測:依應用領域分類,2022-2035年
- 清潔劑和清潔劑
- 個人護理和化妝品
- 紙漿和造紙
- 農業化學品
- 食品/飲料
- 水處理
- 其他(照片、藥品、水泥、治療藥物)
第8章 市場估計與預測:依地區分類,2022-2035年
- 北美洲
- 美國
- 加拿大
- 歐洲
- 德國
- 英國
- 法國
- 西班牙
- 義大利
- 其他歐洲地區
- 亞太地區
- 中國
- 印度
- 日本
- 澳洲
- 韓國
- 亞太其他地區
- 拉丁美洲
- 巴西
- 墨西哥
- 阿根廷
- 其他拉丁美洲地區
- 中東和非洲
- 沙烏地阿拉伯
- 南非
- 阿拉伯聯合大公國
- 其他中東和非洲地區
第9章:公司簡介
- BASF SE
- Corbion
- Innospec
- Itaconix Corporation
- Jungbunzlauer
- Kemira
- Lanxess
- Nippon Shokubai
- Nouryon
- PMP Fermentation Products
- Roquette Freres
- Shandong Fuyang Biotech
- Yuanlian Chemical
The Global Natural Chelating Agents Market was valued at USD 3.1 billion in 2025 and is estimated to grow at a CAGR of 5.9% to reach USD 5.5 billion by 2035.
The market is gaining traction due to the rising shift toward sustainable, bio-based, and environmentally safe chemical solutions across multiple industries. Natural chelating agents are derived from renewable sources and are designed to bind metal ions, enabling their stabilization, removal, or neutralization. These compounds are widely used in agriculture, water treatment, personal care formulations, and industrial cleaning applications. Their primary function involves binding metals such as calcium, magnesium, iron, and other heavy metals that contribute to scaling, corrosion, and toxicity-related issues. Growing environmental awareness and tightening regulatory frameworks against synthetic chelating agents are accelerating the adoption of natural alternatives. Their biodegradability and lower toxicity profile make them a preferred choice compared to conventional synthetic options. In addition, their ability to enhance cleaning efficiency, improve soil quality, and support effective water purification is further strengthening demand. The market is also benefiting from increasing consumer preference for eco-friendly ingredients and sustainable industrial practices across global end-use sectors.
| Market Scope | |
|---|---|
| Start Year | 2025 |
| Forecast Year | 2026-2035 |
| Start Value | $3.1 Billion |
| Forecast Value | $5.5 Billion |
| CAGR | 5.9% |
The sodium gluconate segment accounted for 32.3% share in 2025 and is expected to grow at a CAGR of 5% through 2035. This segment remains widely adopted due to its cost efficiency, stable performance, and suitability for large-scale industrial applications. Its strong compatibility with alkaline environments and reliable chelation properties continue to support its use across various end-use industries.
The plant-based segment held a 43.1% share in 2025 and is projected to grow at a CAGR of 5.7% through 2035. This segment benefits from established agricultural sourcing systems and relatively lower production costs, making it a widely used production route. However, it is influenced by fluctuations in raw material availability and competition from other biomass applications. Despite this, plant-derived solutions remain a key contributor to market expansion due to their sustainability advantages.
North America Natural Chelating Agents Market accounted for 27% share in 2025. Growth in the region is driven by rising demand for eco-friendly cleaning solutions and personal care products. Increasing environmental awareness and stricter regulations on synthetic chemical usage are further supporting market adoption. Expanding applications in the food processing and water treatment industries are also contributing to consistent regional growth.
Major companies operating in the Global Natural Chelating Agents Industry include Nouryon, BASF SE, Kemira, Lanxess, Corbion, Jungbunzlauer, Innospec, Itaconix Corporation, Nippon Shokubai, Roquette Freres, PMP Fermentation Products, Shandong Fuyang Biotech, Yuanlian Chemical. Companies in the Natural Chelating Agents Market are focusing on strengthening their competitive position through expansion of bio-based product portfolios and investment in sustainable production technologies. They are increasingly adopting fermentation-based and plant-derived manufacturing processes to improve product efficiency and environmental performance. Strategic collaborations with agricultural suppliers and industrial end users are helping secure stable raw material supply chains and expand application reach. Firms are also investing in research and development to improve chelation efficiency, stability, and cost competitiveness across different pH conditions. Expansion into emerging markets and development of application-specific formulations for water treatment, personal care, and cleaning industries are further supporting growth.
Table of Contents
Chapter 1 Methodology & Scope
- 1.1 Market scope and definition
- 1.2 Research design
- 1.2.1 Research approach
- 1.2.2 Data collection methods
- 1.3 Data mining sources
- 1.3.1 Global
- 1.3.2 Regional/Country
- 1.4 Base estimates and calculations
- 1.4.1 Base year calculation
- 1.4.2 Key trends for market estimation
- 1.5 Primary research and validation
- 1.5.1 Primary sources
- 1.6 Forecast model
- 1.7 Research assumptions and limitations
Chapter 2 Executive Summary
- 2.1 Industry 360° synopsis
- 2.2 Key market trends
- 2.2.1 Regional
- 2.2.2 Product
- 2.2.3 Source
- 2.2.4 Application
- 2.3 TAM Analysis, 2026-2035
- 2.4 CXO perspectives: Strategic imperatives
- 2.4.1 Executive decision points
Chapter 3 Industry Insights
- 3.1 Industry ecosystem analysis
- 3.1.1 Supplier landscape
- 3.1.2 Profit margin
- 3.1.3 Value addition at each stage
- 3.1.4 Factor affecting the value chain
- 3.1.5 Disruptions
- 3.2 Industry impact forces
- 3.2.1 Growth drivers
- 3.2.2 Industry pitfalls and challenges
- 3.2.3 Market opportunities
- 3.3 Growth potential analysis
- 3.4 Regulatory landscape
- 3.4.1 North America
- 3.4.2 Europe
- 3.4.3 Asia Pacific
- 3.4.4 Latin America
- 3.4.5 Middle East & Africa
- 3.5 Porter's analysis
- 3.6 PESTEL analysis
- 3.7 Price trends
- 3.7.1 By region
- 3.7.2 By type
- 3.8 Future market trends
- 3.9 Technology and Innovation landscape
- 3.9.1 Current technological trends
- 3.9.2 Emerging technologies
- 3.10 Patent Landscape
- 3.11 Trade statistics (HS code)
- 3.11.1 Major importing countries
- 3.11.2 Major exporting countries
- 3.12 Sustainability and environmental aspects
- 3.12.1 Sustainable practices
- 3.12.2 Waste reduction strategies
- 3.12.3 Energy efficiency in production
- 3.12.4 Eco-friendly initiatives
- 3.13 Carbon footprint consideration
Chapter 4 Competitive Landscape, 2025
- 4.1 Introduction
- 4.2 Company market share analysis
- 4.2.1 By region
- 4.2.1.1 North America
- 4.2.1.2 Europe
- 4.2.1.3 Asia Pacific
- 4.2.1.4 LATAM
- 4.2.1.5 MEA
- 4.2.1 By region
- 4.3 Company matrix analysis
- 4.4 Competitive analysis of major market players
- 4.5 Competitive positioning matrix
- 4.6 Key developments
- 4.6.1 Mergers & acquisitions
- 4.6.2 Partnerships & collaborations
- 4.6.3 New Product Launches
- 4.6.4 Expansion Plans
Chapter 5 Market Estimates and Forecast, By Product, 2022-2035 (USD Billion) (Kilo Tons)
- 5.1 Key trends
- 5.2 Sodium Gluconate
- 5.3 Ethylene diamine disuccinate (EDDS)
- 5.4 Glutamic acid diacetate (GLDA)
- 5.5 Iminodisuccinic acid (IDSA)
- 5.6 Methylglycine Diacetic Acid (MGDA)
- 5.7 Others (N-Diacetic Acid Tetrasodium Salt (ASDA), Glucoheptonates)
Chapter 6 Market Estimates and Forecast, By Source, 2022-2035 (USD Billion) (Kilo Tons)
- 6.1 Key trends
- 6.2 Plants
- 6.3 Microbial fermentation
- 6.4 Chemical synthesis from bio-based feedstocks
Chapter 7 Market Estimates and Forecast, By Application, 2022-2035 (USD Billion) (Kilo Tons)
- 7.1 Key trends
- 7.2 Detergents & cleaning agents
- 7.3 Personal care & cosmetics
- 7.4 Pulp and paper
- 7.5 Agrichemicals
- 7.6 Food and beverage
- 7.7 Water treatment
- 7.8 Others (photography, pharmaceuticals, cements, Therapeutics)
Chapter 8 Market Estimates and Forecast, By Region, 2022-2035 (USD Billion) (Kilo Tons)
- 8.1 Key trends
- 8.2 North America
- 8.2.1 U.S.
- 8.2.2 Canada
- 8.3 Europe
- 8.3.1 Germany
- 8.3.2 UK
- 8.3.3 France
- 8.3.4 Spain
- 8.3.5 Italy
- 8.3.6 Rest of Europe
- 8.4 Asia Pacific
- 8.4.1 China
- 8.4.2 India
- 8.4.3 Japan
- 8.4.4 Australia
- 8.4.5 South Korea
- 8.4.6 Rest of Asia Pacific
- 8.5 Latin America
- 8.5.1 Brazil
- 8.5.2 Mexico
- 8.5.3 Argentina
- 8.5.4 Rest of Latin America
- 8.6 Middle East and Africa
- 8.6.1 Saudi Arabia
- 8.6.2 South Africa
- 8.6.3 UAE
- 8.6.4 Rest of Middle East and Africa
Chapter 9 Company Profiles
- 9.1 BASF SE
- 9.2 Corbion
- 9.3 Innospec
- 9.4 Itaconix Corporation
- 9.5 Jungbunzlauer
- 9.6 Kemira
- 9.7 Lanxess
- 9.8 Nippon Shokubai
- 9.9 Nouryon
- 9.10 PMP Fermentation Products
- 9.11 Roquette Freres
- 9.12 Shandong Fuyang Biotech
- 9.13 Yuanlian Chemical

 生物基螯合劑市場預測至2034年:按產品類型、原料、應用、劑型、最終用戶和地區分類的全球分析
 生物可分解螯合劑:市場佔有率分析、產業趨勢與統計、成長預測(2026-2031)
 天然螯合劑市場規模、佔有率和成長分析:按產品類型、原料、形態、應用、最終用途產業和地區分類-2026-2033年產業預測
 生物可分解螯合劑市場:依產品類型、劑型、通路、應用及產業分類-2026-2032年全球市場預測檸檬醛產品市場:2026-2032年全球市場預測(依調味品、食品飲料、製藥、應用及通路分類)
 全球鋅甲硫胺酸螯合物市場規模、佔有率、趨勢和成長分析報告(2026-2034年)
 全球綠色螯合劑(天然螯合劑)市場報告,2026年
 鋅甲硫胺酸螯合物市場規模、佔有率和成長分析(按產品類型、形態、牲畜種類、應用和地區分類)-2026-2033年產業預測
 農業螯合物市場-全球產業規模、佔有率、趨勢、機會及預測,依類型、作物類型、應用、地區及競爭格局分類,2020-2030年預測螯合劑市場-全球產業規模、佔有率、趨勢、機會與預測,按產品、應用、地區和競爭細分,2020-2030 年