

 |
市場調查報告書
商品編碼
2038686
五氧化二鉭市場機會、成長要素、產業趨勢分析及2026-2035年預測。Tantalum Pentoxide Market Opportunity, Growth Drivers, Industry Trend Analysis, and Forecast 2026 - 2035 |
||||||

預計到 2025 年,全球五氧化二鉭市場價值將達到 4.162 億美元,並有望以 5% 的複合年成長率成長,到 2035 年達到 6.754 億美元。
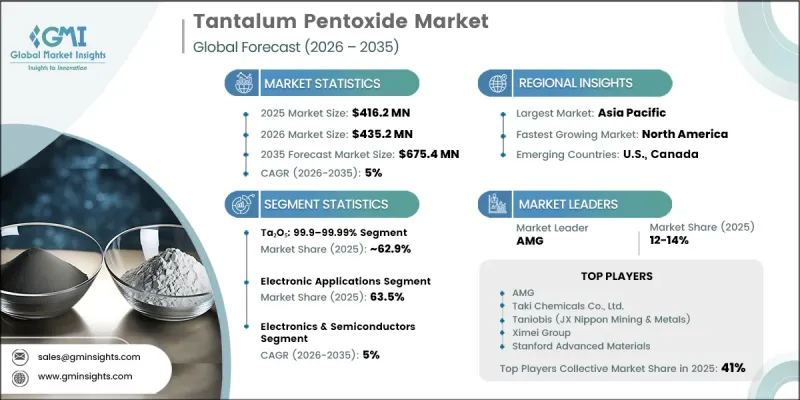
全球電子產業的持續擴張,尤其是新興市場裝置製造的加速發展,是推動五氧化二鉭市場成長的主要動力。五氧化二鉭因其優異的介電性能和高材料穩定性,被廣泛應用於光電子、半導體裝置和化學加工領域。市場對更小巧、更節能的電子設備的需求不斷成長,進一步促進了五氧化二鉭的市場應用,因為這種材料有助於提升緊湊型元件的性能。此外,可再生能源產業的蓬勃發展,尤其是太陽能和風能發電設施配套能源儲存系統的廣泛應用,也推動了對五氧化二鉭的需求。然而,供應鏈的不穩定性,主要是由於依賴來自地緣政治敏感地區的原料,構成了市場挑戰。價格波動、監管壓力和採礦限制也進一步影響市場動態。為了因應這些風險,產業相關人員正日益關注負責任的籌資策略和供應鏈網路的多元化。
| 市場範圍 | |
|---|---|
| 開始年份 | 2025 |
| 預測期 | 2026-2035 |
| 上市時的市場規模 | 4.162億美元 |
| 預測金額 | 6.754億美元 |
| 複合年成長率 | 5% |
隨著電子和材料科學技術的進步,五氧化二鉭市場也不斷發展。新一代元件對高性能材料的日益青睞,推動製造流程的持續創新。製造商致力於提升材料的純度、均勻性和可擴展性,以滿足先進電子應用的需求。高密度電路和小型化元件等應用領域的拓展,進一步促進了市場成長。製造技術的不斷改進提高了材料利用率,使其能夠在各個工業領域中廣泛使用。
2025年,純度為99.9%至99.99%的Ta₂O₅市佔率達62.9%。預計到2035年,該細分市場將以5.2%的複合年成長率成長,這主要得益於其在電子陶瓷、電容器、光學塗層、鉭酸鋰晶體和先進介電材料等領域的廣泛應用。 Ta₂O₅具有高可靠性、穩定性和性能一致性,使其成為大規模電子和光電製造的首選牌號。其滿足高精度應用的能力對於現代電子元件生產至關重要。
預計到2025年,電子應用領域將佔據63.5%的市場佔有率,並在2026年至2035年間以5.2%的複合年成長率成長。該領域佔據主導地位,主要得益於其作為高介電材料在電容器、積體電路和先進陶瓷元件中的廣泛應用。其穩定的電氣性能使其成為緊湊型高性能電子系統的理想之選。家用電子電器、汽車電子和工業設備領域需求的成長正在推動其進一步普及。隨著電子產品小型化趨勢的加劇,其在全球製造業生態系統中的重要性也日益凸顯。
預計到2025年,北美五氧化二鉭市場佔有率將達到26.7%,並持續穩定成長。這一成長主要得益於先進的製造基礎設施以及在電子和半導體研發領域的強大技術實力。電容器、薄膜和先進陶瓷等應用領域對高純度材料的高需求進一步推動了區域市場的成長。持續的研發投入也促進了材料應用和製造流程的創新。
目錄
第1章:調查方法和範圍
第2章執行摘要
第3章業界考察
- 生態系分析
- 供應商情況
- 利潤率
- 每個階段增加的價值
- 影響價值鏈的因素
- 中斷
- 影響產業的因素
- 促進因素
- 電子產業需求增加
- 能源儲存領域的應用不斷擴展
- 新興科技與產業
- 產業潛在風險與挑戰
- 供應鏈脆弱性
- 新的大型採礦項目有限。
- 市場機遇
- 先進電子產品小型化趨勢
- 綠色能源和工業電氣化的發展
- 促進因素
- 成長潛力分析
- 監理情勢
- 北美洲
- 歐洲
- 亞太地區
- 拉丁美洲
- 中東和非洲
- 波特五力分析
- PESTEL 分析
- 價格趨勢
- 按地區
- 依產品
- 未來市場趨勢
- 科技與創新趨勢
- 當前技術趨勢
- 新興技術
- 專利趨勢
- 貿易統計(HS編碼)
- 主要進口國
- 主要出口國
- 永續性和環境方面
- 永續計劃
- 減少廢棄物策略
- 生產中的能源效率
- 環保意識的舉措
- 考慮碳足跡
第4章 競爭情勢
- 介紹
- 企業市佔率分析
- 按地區
- 北美洲
- 歐洲
- 亞太地區
- 拉丁美洲
- 中東和非洲(MEA)
- 按地區
- 企業矩陣分析
- 主要市場公司的競爭分析
- 競爭定位矩陣
- 主要進展
- 併購
- 夥伴關係與合作
- 新產品發布
- 業務拓展計劃
第5章 市場估價與預測:依產品分類,2022-2035年
- Ta2O5<99.9%
- Ta2O5:99.9~99.99%
- Ta2O5>99.99%
第6章 市場估計與預測:依應用領域分類,2022-2035年
- 電子應用
- 鉭酸鋰單晶
- 濺鍍靶
- 其他
第7章 市場估計與預測:依最終用戶分類,2022-2035年
- 電子和半導體
- 車
- 溝通
- 光學和光電
- 航太/國防
- 醫療保健
- 能源與公共產業
- 其他
第8章 市場估計與預測:依地區分類,2022-2035年
- 北美洲
- 美國
- 加拿大
- 歐洲
- 德國
- 英國
- 法國
- 西班牙
- 義大利
- 其他歐洲地區
- 亞太地區
- 中國
- 印度
- 日本
- 澳洲
- 韓國
- 亞太其他地區
- 拉丁美洲
- 巴西
- 墨西哥
- 阿根廷
- 其他拉丁美洲地區
- 中東和非洲
- 沙烏地阿拉伯
- 南非
- 阿拉伯聯合大公國
- 其他中東和非洲地區
第9章:公司簡介
- AMG
- Taki Chemicals Co., Ltd.
- Taniobis(JX Nippon Mining &Metals)
- Ximei Group
- Stanford Advanced Materials
- American Elements
- Inframat Corporation
- Admat Inc
- Loba Chemie
- F&X Electro-Materials
- Nanoshel
- Otto Chemie Pvt. Ltd.
- Edgetech Industries LLC
- Lorad Chemical Corporation
- Shanghai Greenearth Chemicals Co.,Ltd
The Global Tantalum Pentoxide Market was valued at USD 416.2 million in 2025 and is estimated to grow at a CAGR of 5% to reach USD 675.4 million by 2035.
Growth is supported by the ongoing expansion of the global electronics sector, particularly in emerging economies where device manufacturing is accelerating. Tantalum pentoxide is widely used in optoelectronics, semiconductor devices, and chemical processing applications due to its strong dielectric properties and high material stability. Increasing demand for miniaturized, energy-efficient electronic devices is further strengthening market adoption, as the material supports enhanced performance in compact components. The growing renewable energy sector is also contributing to demand, driven by increased use of energy storage systems linked to solar and wind installations. However, the market faces challenges from supply chain instability, largely due to reliance on raw material sourcing from geopolitically sensitive regions. Price volatility, regulatory pressures, and mining constraints further influence market dynamics. To address these risks, industry participants are increasingly focusing on responsible sourcing strategies and diversified supply networks.
| Market Scope | |
|---|---|
| Start Year | 2025 |
| Forecast Year | 2026-2035 |
| Start Value | $ 416.2 Million |
| Forecast Value | $ 675.4 Million |
| CAGR | 5% |
The tantalum pentoxide market is also evolving due to technological advancements in electronics and materials engineering. Increasing integration of high-performance materials in next-generation devices is driving continuous innovation in production processes. Manufacturers are focusing on improving material purity, consistency, and scalability to meet the requirements of advanced electronic applications. Expanding use in high-density circuits and miniaturized components is further supporting market growth. Continuous improvements in fabrication technologies are enhancing material efficiency and enabling broader industrial applications across multiple sectors.
The Ta2O5 99.9-99.99% grade segment accounted for 62.9% share in 2025. This segment is projected to grow at a CAGR of 5.2% through 2035 due to its widespread use in electronic ceramics, capacitors, optical coatings, lithium tantalate crystals, and advanced dielectric applications. It remains the preferred grade for large-scale electronics and photonics manufacturing because of its high reliability, stability, and performance consistency. Its ability to support high-precision applications makes it essential for modern electronic component production.
The electronic applications segment held a 63.5% share in 2025 and is expected to grow at a CAGR of 5.2% between 2026 and 2035. This segment leads due to its extensive use as a high dielectric material in capacitors, integrated circuits, and advanced ceramic components. Its stable electrical properties make it highly suitable for compact and high-performance electronic systems. Increasing demand for consumer electronics, automotive electronics, and industrial devices is further driving adoption. Growing miniaturization trends in electronics continue to reinforce its importance across global manufacturing ecosystems.
North America Tantalum Pentoxide Market captured 26.7% share in 2025 and continues to expand steadily. The region's growth is supported by advanced manufacturing infrastructure and strong technological capabilities in electronics and semiconductor development. High demand for high-purity materials used in capacitors, thin films, and advanced ceramics is further strengthening regional market growth. Continuous investment in research and development activities is also contributing to innovation in material applications and production processes.
Key companies operating in the Global Tantalum Pentoxide Market include AMG, Taki Chemicals Co., Ltd., Taniobis (JX Nippon Mining & Metals), Ximei Group, Stanford Advanced Materials, American Elements, Inframat Corporation, Admat Inc, Loba Chemie, F&X Electro-Materials, Nanoshel, Otto Chemie Pvt. Ltd., Edgetech Industries LLC, Lorad Chemical Corporation, and Shanghai Greenearth Chemicals Co., Ltd. Companies in the tantalum pentoxide market are focusing on supply chain diversification, material purity enhancement, and strategic partnerships to strengthen their market position. They are investing in advanced refining and processing technologies to improve product consistency and meet stringent industry standards. Many players are expanding their sourcing networks to reduce dependency on high-risk regions and ensure stable raw material availability. Strategic collaborations with electronics and semiconductor manufacturers are helping companies secure long-term supply agreements.
Table of Contents
Chapter 1 Methodology & Scope
- 1.1 Market scope and definition
- 1.2 Research design
- 1.2.1 Research approach
- 1.2.2 Data collection methods
- 1.3 Data mining sources
- 1.3.1 Global
- 1.3.2 Regional/Country
- 1.4 Base estimates and calculations
- 1.4.1 Base year calculation
- 1.4.2 Key trends for market estimation
- 1.5 Primary research and validation
- 1.5.1 Primary sources
- 1.6 Forecast model
- 1.7 Research assumptions and limitations
Chapter 2 Executive Summary
- 2.1 Industry 360° synopsis
- 2.2 Key market trends
- 2.2.1 Regional
- 2.2.2 Product
- 2.2.3 Application
- 2.2.4 End-User
- 2.3 TAM Analysis, 2026-2035
- 2.4 CXO perspectives: Strategic imperatives
- 2.4.1 Executive decision points
- 2.4.2 Critical success factors
- 2.5 Future Outlook and Strategic Recommendations
Chapter 3 Industry Insights
- 3.1 Industry ecosystem analysis
- 3.1.1 Supplier landscape
- 3.1.2 Profit margin
- 3.1.3 Value addition at each stage
- 3.1.4 Factor affecting the value chain
- 3.1.5 Disruptions
- 3.2 Industry impact forces
- 3.2.1 Growth drivers
- 3.2.1.1 Increasing demand in electronics industry
- 3.2.1.2 Expanding applications in energy storage
- 3.2.1.3 Emerging technologies and industries
- 3.2.2 Industry pitfalls and challenges
- 3.2.2.1 Supply chain vulnerability
- 3.2.2.2 Limited new large-scale mining projects
- 3.2.3 Market opportunities
- 3.2.3.1 Advanced electronics miniaturization trends
- 3.2.3.2 Green energy & industrial electrification growth
- 3.2.1 Growth drivers
- 3.3 Growth potential analysis
- 3.4 Regulatory landscape
- 3.4.1 North America
- 3.4.2 Europe
- 3.4.3 Asia Pacific
- 3.4.4 Latin America
- 3.4.5 Middle East & Africa
- 3.5 Porter's analysis
- 3.6 PESTEL analysis
- 3.7 Price trends
- 3.7.1 By region
- 3.7.2 By product
- 3.8 Future market trends
- 3.9 Technology and Innovation landscape
- 3.9.1 Current technological trends
- 3.9.2 Emerging technologies
- 3.10 Patent Landscape
- 3.11 Trade statistics (HS code)
- 3.11.1 Major importing countries
- 3.11.2 Major exporting countries
- 3.12 Sustainability and environmental aspects
- 3.12.1 Sustainable practices
- 3.12.2 Waste reduction strategies
- 3.12.3 Energy efficiency in production
- 3.12.4 Eco-friendly initiatives
- 3.13 Carbon footprint consideration
Chapter 4 Competitive Landscape, 2025
- 4.1 Introduction
- 4.2 Company market share analysis
- 4.2.1 By region
- 4.2.1.1 North America
- 4.2.1.2 Europe
- 4.2.1.3 Asia Pacific
- 4.2.1.4 LATAM
- 4.2.1.5 MEA
- 4.2.1 By region
- 4.3 Company matrix analysis
- 4.4 Competitive analysis of major market players
- 4.5 Competitive positioning matrix
- 4.6 Key developments
- 4.6.1 Mergers & acquisitions
- 4.6.2 Partnerships & collaborations
- 4.6.3 New Product Launches
- 4.6.4 Expansion Plans
Chapter 5 Market Estimates and Forecast, By Product, 2022-2035 (USD Million) (Kilo Tons)
- 5.1 Key trends
- 5.2 Ta2O5 < 99.9%
- 5.3 Ta2O5: 99.9-99.99%
- 5.4 Ta2O5 > 99.99%
Chapter 6 Market Estimates and Forecast, By Application, 2022-2035 (USD Million) (Kilo Tons)
- 6.1 Key trends
- 6.2 Electronic applications
- 6.3 Lithium tantalate single crystals
- 6.4 Sputtering targets
- 6.5 Others
Chapter 7 Market Estimates and Forecast, By End-User, 2022-2035 (USD Million) (Kilo Tons)
- 7.1 Key trends
- 7.2 Electronics & Semiconductors
- 7.3 Automotive
- 7.4 Telecommunications
- 7.5 Optical & Photonics
- 7.6 Aerospace & Defense
- 7.7 Medical & Healthcare
- 7.8 Energy & Utilities
- 7.9 Others
Chapter 8 Market Estimates and Forecast, By Region, 2022-2035 (USD Million) (Kilo Tons)
- 8.1 Key trends
- 8.2 North America
- 8.2.1 U.S.
- 8.2.2 Canada
- 8.3 Europe
- 8.3.1 Germany
- 8.3.2 UK
- 8.3.3 France
- 8.3.4 Spain
- 8.3.5 Italy
- 8.3.6 Rest of Europe
- 8.4 Asia Pacific
- 8.4.1 China
- 8.4.2 India
- 8.4.3 Japan
- 8.4.4 Australia
- 8.4.5 South Korea
- 8.4.6 Rest of Asia Pacific
- 8.5 Latin America
- 8.5.1 Brazil
- 8.5.2 Mexico
- 8.5.3 Argentina
- 8.5.4 Rest of Latin America
- 8.6 Middle East and Africa
- 8.6.1 Saudi Arabia
- 8.6.2 South Africa
- 8.6.3 UAE
- 8.6.4 Rest of Middle East and Africa
Chapter 9 Company Profiles
- 9.1 AMG
- 9.2 Taki Chemicals Co., Ltd.
- 9.3 Taniobis (JX Nippon Mining & Metals)
- 9.4 Ximei Group
- 9.5 Stanford Advanced Materials
- 9.6 American Elements
- 9.7 Inframat Corporation
- 9.8 Admat Inc
- 9.9 Loba Chemie
- 9.10 F&X Electro-Materials
- 9.11 Nanoshel
- 9.12 Otto Chemie Pvt. Ltd.
- 9.13 Edgetech Industries LLC
- 9.14 Lorad Chemical Corporation
- 9.15 Shanghai Greenearth Chemicals Co.,Ltd

 鉭電容器市場-2026-2032年全球市場預測
 鉭電容器:市場佔有率分析、產業趨勢與統計、成長預測(2026-2031)
 全球五氧化二鉭市場規模、佔有率、趨勢和成長分析報告(2026-2034年)
 2032 年鉭電容器市場預測:按類型、安裝類型、電容範圍、電壓範圍、應用和地區進行的全球分析2030 年鉭電容器市場預測:按類型、電容、額定電壓、安裝類型、等級、應用、最終用戶和地區進行的全球分析
 鉭質電容的全球市場:產業分析,規模,佔有率,成長,趨勢,預測(2024年~2031年)
 五氧化二鉭市場,按產品類型、按產品提供類型、按應用、按國家和地區 - 2024-2032年產業分析、市場規模、市場佔有率和預測