


 |
市場調查報告書
商品編碼
2038683
培養肉市場機會、成長要素、產業趨勢分析及2026-2035年預測Cultured Meat Market Opportunity, Growth Drivers, Industry Trend Analysis, and Forecast 2026 - 2035 |
||||||
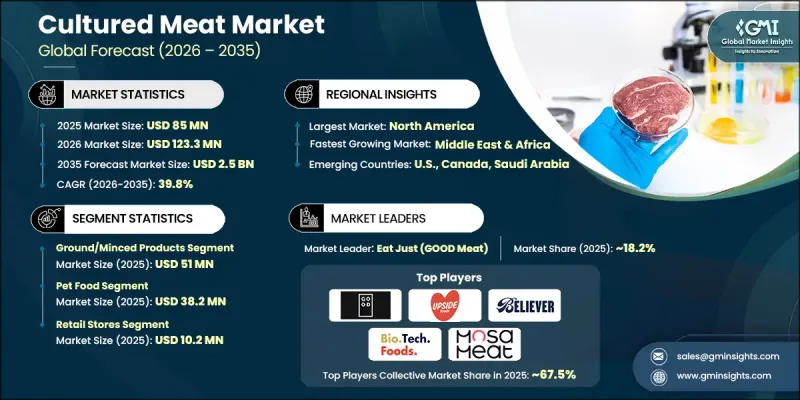
2025 年全球培養肉市場價值 8,500 萬美元,預計到 2035 年將達到 25 億美元,年複合成長率為 39.8%。
隨著主要經濟體的監管機構逐步核准消費品上市,該產業正從試點研發階段邁向早期商業化階段。美國食品藥物管理局(FDA)和美國農業部(USDA)等機構對禽類衍生培養產品的早期核准,增強了消費者對產品安全標準的信心,促進了投資者的進入,並支持了整個行業產能的擴張。同時,環境壓力也在加速推廣,因為生命週期評估(LCA)結果始終表明,與傳統畜牧業相比,培養肉可以顯著減少溫室氣體排放、土地利用和水資源消耗。這些可衡量的永續性優勢正在鞏固培養肉在全球蛋白質市場的長期地位。技術進步也在改變成本結構,無血清培養基的開發、細胞株開發的改進以及高通量生物反應器的進步,都在穩步降低每公斤的生產成本,並增強其與傳統肉類的競爭力。此外,消費者對符合倫理、透明且更安全的蛋白質替代品的興趣日益濃厚,進一步推動了零售和餐飲通路的需求。
| 市場範圍 | |
|---|---|
| 開始年份 | 2025 |
| 預測期 | 2026-2035 |
| 上市時的市場規模 | 8500萬美元 |
| 預測金額 | 25億美元 |
| 複合年成長率 | 39.8% |
預計到2025年,碎肉和肉品市場規模將達到5,100萬美元。與加工肉類相比,碎肉的生產過程相對簡單,更容易擴大生產規模,因此該細分市場佔據主導地位。其組織結構易於成型,使得生產商能夠在小規模的生物反應器中高效操作,同時保持肉的質地和感官品質。此外,碎肉適合製作漢堡、肉丸、餃子和雞塊等廣受歡迎的食品,這也有助於其獲得消費者的廣泛認可。這些特性使生產者能夠瞄準需求量大的細分市場,從而在初期價格水準上佔據優勢,並確保可預測的消費模式。
預計到2025年,寵物食品市場規模將達到3,820萬美元。由於企業初期優先考慮人類食品和主流消費通路的應用,寵物食品在培養肉市場中佔有重要地位。早期的監管核准、試點口味測試和有限的零售推廣主要集中在人類消費領域,旨在大規模檢驗人造肉的安全性、風味和質地一致性。這種重點與更廣泛的永續性趨勢以及消費者對符合倫理的蛋白質替代品日益成長的需求相契合,推動培養肉成為傳統動物性蛋白質產品的可行替代品。
預計到2025年,北美培養肉市場規模將達到2,720萬美元。這得歸功於蓬勃發展的細胞農業新創企業生態系統、大量創業投資的湧入,以及美國食品藥物管理局(FDA)和美國農業部(USDA)等機構的早期監管介入。此外,大規模的設施投資和餐飲服務業的持續試點計畫也推動了區域成長,這些計畫檢驗了消費者的接受度,並加速了人造肉的商業化進程。
目錄
第1章:調查方法和範圍
第2章執行摘要
第3章業界考察
- 生態系分析
- 供應商情況
- 利潤率
- 每個階段增加的價值
- 影響價值鏈的因素
- 中斷
- 影響產業的因素
- 促進因素
- 人們越來越傾向於以植物來源的飲食和彈性素食。
- 功能性飲料和高蛋白飲料的需求不斷成長
- 以便利性為優先的消費模式
- 產業潛在風險與挑戰
- 產品成本高,且對價格敏感
- 激烈的競爭和品牌差異化的壓力
- 市場機遇
- 透過新興市場拓展業務和製定定價策略
- 功能性混合物和個人化營養的創新
- 促進因素
- 成長潛力分析
- 監理情勢
- 北美洲
- 歐洲
- 亞太地區
- 拉丁美洲
- 中東和非洲
- 波特五力分析
- PESTEL 分析
- 價格趨勢
- 按地區
- 依產品類型
- 未來市場趨勢
- 科技與創新趨勢
- 當前技術趨勢
- 新興技術
- 專利趨勢
- 貿易統計資料(HS編碼)(註:僅提供主要國家的貿易統計資料)
- 主要進口國
- 主要出口國
- 永續性和環境方面
- 永續計劃
- 減少廢棄物策略
- 生產中的能源效率
- 環保意識的舉措
- 關於碳足跡的考量
第4章 競爭情勢
- 介紹
- 企業市佔率分析
- 按地區
- 北美洲
- 歐洲
- 亞太地區
- 拉丁美洲
- 中東和非洲(MEA)
- 按地區
- 企業矩陣分析
- 主要市場公司的競爭分析
- 競爭定位矩陣
- 主要進展
- 併購
- 夥伴關係和聯盟
- 新產品發布
- 業務拓展計劃
第5章 市場估計與預測:依類型分類,2022-2035年
- 蛋白質飲料粉
- 代餐粉
- 能量飲料/運動飲料混合物
- 功能飲料混合物
第6章 市場估計與預測:依類型分類,2022-2035年
- 粉末
- 液體
第7章 市場估計與預測:依來源分類,2022-2035年
- 大豆衍生
- 杏仁衍生的
- 源自豌豆
- 稻米衍生
- 大麻衍生
- 混合原料
- 椰子衍生的
- 水果衍生的
第8章 市場估算與預測:依通路分類,2022-2035年
- 線上零售
- 離線
- 大賣場和超級市場
- 便利商店
- 專賣店
第9章 市場估計與預測:依地區分類,2022-2035年
- 北美洲
- 美國
- 加拿大
- 歐洲
- 德國
- 英國
- 法國
- 西班牙
- 義大利
- 其他歐洲地區
- 亞太地區
- 中國
- 印度
- 日本
- 澳洲
- 韓國
- 亞太其他地區
- 拉丁美洲
- 巴西
- 墨西哥
- 阿根廷
- 其他拉丁美洲地區
- 中東和非洲
- 沙烏地阿拉伯
- 南非
- 阿拉伯聯合大公國
- 其他中東和非洲地區
第10章:公司簡介
- True Nutrition
- Plant fusion
- Glanbia Nutritionals
- Vegan Drink Company
- Garden of life
- Vega
- Sunwarrior
- Nuzest
- Orgain
- Strive
The Global Cultured Meat Market was valued at USD 85 million in 2025 and is estimated to grow at a CAGR of 39.8% to reach USD 2.5 billion by 2035.
The industry is transitioning from pilot-scale development toward early-stage commercialization as regulatory agencies in major economies begin granting approvals for consumer-facing product launches. Early approvals for poultry-derived cultivated products by authorities such as the FDA and USDA have strengthened confidence in product safety standards, encouraging greater investor participation and supporting capacity expansion across the sector. At the same time, environmental pressures are accelerating adoption, as lifecycle assessments consistently show that cultured meat can significantly reduce greenhouse gas emissions, land usage, and water consumption compared to conventional livestock production. These measurable sustainability benefits are reinforcing its long-term positioning within global protein markets. Technological progress is also reshaping cost structures, with advancements in serum-free media, improved cell line development, and high-throughput bioreactors steadily lowering production costs per kilogram and improving competitiveness against conventional meat. In addition, rising consumer interest in ethical, transparent, and safer protein alternatives is further strengthening demand momentum across both retail and foodservice channels.
| Market Scope | |
|---|---|
| Start Year | 2025 |
| Forecast Year | 2026-2035 |
| Start Value | $85 Million |
| Forecast Value | $2.5 Billion |
| CAGR | 39.8% |
The ground and minced product category accounted for USD 51 million in 2025. This segment leads due to its lower production complexity and faster scalability compared to structured meat cuts. It is easier to form into tissue structures, allowing producers to operate efficiently with smaller bioreactor capacities while maintaining texture and sensory quality. Its suitability for widely consumed formats such as burgers, meatballs, dumplings, and nuggets also supports broader consumer acceptance. These attributes enable manufacturers to target high-volume demand segments that can accommodate early-stage pricing levels while ensuring predictable consumption patterns.
The pet food segment reached USD 38.2 million in 2025. This category holds a meaningful position in the cultured meat market as companies initially prioritize human food applications and mainstream consumption channels. Early regulatory approvals, pilot tastings, and limited retail introductions have largely focused on human consumption to validate safety, flavor, and texture consistency at scale. This focus aligns with broader sustainability narratives and increasing consumer demand for ethical protein alternatives, supporting the establishment of cultured meat as a viable substitute for conventional animal-derived protein products.
North America Cultured Meat Market generated USD 27.2 million in 2025, supported by a strong ecosystem of cellular agriculture startups, substantial venture capital inflows, and early regulatory engagement from agencies such as the FDA and USDA. Regional growth is further driven by large-scale facility investments and ongoing pilot initiatives in foodservice environments, which are helping validate consumer acceptance and support the commercialization pathway.
Key players operating in the Global Cultured Meat Industry include Aleph Farms, Believer Meats (formerly Future Meat Technologies), Avant Meats, Mosa Meat, Upside Foods, Finless Foods, Meatable, Eat Just (GOOD Meat), HigherSteaks, BioFood Systems, Balletic Foods, Biotech Foods, and BlueNalu. Companies in the cultured meat market are focusing on strategic partnerships with food manufacturers, biotechnology firms, and research institutions to accelerate commercialization and scale production capabilities. They are investing heavily in bioprocess optimization, cost reduction technologies, and serum-free culture media innovations to improve efficiency. Many players are expanding pilot production facilities to validate large-scale manufacturing processes while ensuring regulatory compliance. Strong emphasis is placed on securing early regulatory approvals across multiple regions to facilitate market entry. Firms are also prioritizing consumer education and branding strategies to build trust around safety and sustainability. Additionally, targeted collaborations with foodservice operators and retail chains are helping strengthen distribution networks and enhance market visibility, while continuous R&D investments are improving texture, flavor, and product consistency.
Table of Contents
Chapter 1 Methodology & Scope
- 1.1 Market scope and definition
- 1.2 Research design
- 1.2.1 Research approach
- 1.2.2 Data collection methods
- 1.3 Data mining sources
- 1.3.1 Global
- 1.3.2 Regional/Country
- 1.4 Base estimates and calculations
- 1.4.1 Base year calculation
- 1.4.2 Key trends for market estimation
- 1.5 Primary research and validation
- 1.5.1 Primary sources
- 1.6 Forecast model
- 1.7 Research assumptions and limitations
Chapter 2 Executive Summary
- 2.1 Industry 360° synopsis
- 2.2 Key market trends
- 2.2.1 Regional
- 2.2.2 Type
- 2.2.3 Form
- 2.2.4 Source
- 2.2.5 Distribution Channel
- 2.3 TAM Analysis, 2026-2035
- 2.4 CXO perspectives: Strategic imperatives
- 2.4.1 Executive decision points
- 2.4.2 Critical success factors
- 2.5 Future Outlook and strategic recommendations
Chapter 3 Industry Insights
- 3.1 Industry ecosystem analysis
- 3.1.1 Supplier Landscape
- 3.1.2 Profit Margin
- 3.1.3 Value addition at each stage
- 3.1.4 Factor affecting the value chain
- 3.1.5 Disruptions
- 3.2 Industry impact forces
- 3.2.1 Growth drivers
- 3.2.1.1 Rising shift toward plant-based and flexitarian diets
- 3.2.1.2 Increasing demand for functional and protein-rich beverages
- 3.2.1.3 Convenience-driven consumption patterns
- 3.2.2 Industry pitfalls and challenges
- 3.2.2.1 High product cost and price sensitivity
- 3.2.2.2 Intense competition and brand differentiation pressure
- 3.2.3 Market opportunities
- 3.2.3.1 Expansion through emerging markets and affordability strategies
- 3.2.3.2 Innovation in functional blends and personalized nutrition
- 3.2.1 Growth drivers
- 3.3 Growth potential analysis
- 3.4 Regulatory landscape
- 3.4.1 North America
- 3.4.2 Europe
- 3.4.3 Asia Pacific
- 3.4.4 Latin America
- 3.4.5 Middle East & Africa
- 3.5 Porter's analysis
- 3.6 PESTEL analysis
- 3.6.1 Technology and innovation landscape
- 3.6.2 Current technological trends
- 3.6.3 Emerging technologies
- 3.7 Price trends
- 3.7.1 By region
- 3.7.2 By product type
- 3.8 Future market trends
- 3.9 Technology and Innovation Landscape
- 3.9.1 Current technological trends
- 3.9.2 Emerging technologies
- 3.10 Patent Landscape
- 3.11 Trade statistics (HS code) (Note: the trade statistics will be provided for key countries only)
- 3.11.1 Major importing countries
- 3.11.2 Major exporting countries
- 3.12 Sustainability and environmental aspects
- 3.12.1 Sustainable practices
- 3.12.2 Waste reduction strategies
- 3.12.3 Energy efficiency in production
- 3.12.4 Eco-friendly initiatives
- 3.13 Carbon Footprint Considerations
Chapter 4 Competitive Landscape, 2025
- 4.1 Introduction
- 4.2 Company market share analysis
- 4.2.1 By region
- 4.2.1.1 North America
- 4.2.1.2 Europe
- 4.2.1.3 Asia Pacific
- 4.2.1.4 LATAM
- 4.2.1.5 MEA
- 4.2.1 By region
- 4.3 Company matrix analysis
- 4.4 Competitive analysis of major market players
- 4.5 Competitive positioning matrix
- 4.6 Key developments
- 4.6.1 Mergers & acquisitions
- 4.6.2 Partnerships & collaborations
- 4.6.3 New product launches
- 4.6.4 Expansion plans
Chapter 5 Market Estimates and Forecast, By Type, 2022 - 2035 (USD Billion) (Kilo Tons)
- 5.1 Key trends
- 5.2 Protein Drink Mixes
- 5.3 Meal Replacement Mixes
- 5.4 Energy and Sports Drink Mixes
- 5.5 Functional Drink Mixes
Chapter 6 Market Estimates and Forecast, By Form, 2022 - 2035 (USD Billion) (Kilo Tons)
- 6.1 Key trends
- 6.2 Powder
- 6.3 Liquid
Chapter 7 Market Estimates and Forecast, By Source, 2022 - 2035 (USD Billion) (Kilo Tons)
- 7.1 Key trends
- 7.2 Soy-Based
- 7.3 Almond-Based
- 7.4 Pea-Based
- 7.5 Rice-Based
- 7.6 Hemp-Based
- 7.7 Mixed-Source
- 7.8 Coconut Based
- 7.9 Fruit based
Chapter 8 Market Estimates and Forecast, By Distribution Channel, 2022 - 2035 (USD Billion) (Kilo Tons)
- 8.1 Key trends
- 8.2 Online retail
- 8.3 Offline
- 8.3.1 Hypermarkets and Supermarkets
- 8.3.2 Convenience Stores
- 8.3.3 Specialty Stores
Chapter 9 Market Estimates and Forecast, By Region, 2022 - 2035 (USD Billion) (Kilo Tons)
- 9.1 Key trends
- 9.2 North America
- 9.2.1 U.S.
- 9.2.2 Canada
- 9.3 Europe
- 9.3.1 Germany
- 9.3.2 UK
- 9.3.3 France
- 9.3.4 Spain
- 9.3.5 Italy
- 9.3.6 Rest of Europe
- 9.4 Asia Pacific
- 9.4.1 China
- 9.4.2 India
- 9.4.3 Japan
- 9.4.4 Australia
- 9.4.5 South Korea
- 9.4.6 Rest of Asia Pacific
- 9.5 Latin America
- 9.5.1 Brazil
- 9.5.2 Mexico
- 9.5.3 Argentina
- 9.5.4 Rest of Latin America
- 9.6 Middle East and Africa
- 9.6.1 Saudi Arabia
- 9.6.2 South Africa
- 9.6.3 UAE
- 9.6.4 Rest of Middle East and Africa
Chapter 10 Company Profiles
- 10.1 True Nutrition
- 10.2 Plant fusion
- 10.3 Glanbia Nutritionals
- 10.4 Vegan Drink Company
- 10.5 Garden of life
- 10.6 Vega
- 10.7 Sunwarrior
- 10.8 Nuzest
- 10.9 Orgain
- 10.10 Strive
 培養肉市場規模、佔有率及成長分析:按肉類生物分類、生產和培育技術、最終烹飪形式、最終用途以及分銷和銷售管道分類——2026-2033年行業預測
 下一代肉類替代品市場預測至2034年—按產品類型、成分、形態、分銷管道和最終用戶分類的全球分析植物來源肉類和魚貝類替代品市場預測至2034年—按產品類型、蛋白質來源、加工技術、分銷管道和最終用戶分類的全球分析
 培養肉市場規模、佔有率和成長分析:按原料、產品形式、分銷管道和地區分類-2026-2033年產業預測2034年培養肉市場預測-全球原料、產品類型、形態、最終產品、生產技術、應用、最終用戶、通路與區域分析
 3D列印肉品市場:按產品類型、最終用途、營養成分、製造技術、價格範圍、文化和飲食偏好、環境影響和地區分類
 全球培養肉市場規模、佔有率、趨勢和成長分析報告(2026-2034年)
 培養肉市場-全球產業規模、佔有率、趨勢、機會和預測:按原料、最終用途、分銷通路、地區和競爭格局分類,2021-2031年2032年替代蛋白和培養肉市場預測:按產品、成分、分銷管道、技術、應用、最終用戶和地區分類的全球分析精準發酵和細胞培養食品市場預測至2032年:按產品類型、形態、生產方法、技術、應用、最終用戶和地區分類的全球分析