


 |
市場調查報告書
商品編碼
2038452
2026-2035年電機施工機械市場機會、成長要素、產業趨勢分析及預測Electric Construction Equipment Market Opportunity, Growth Drivers, Industry Trend Analysis, and Forecast 2026 - 2035 |
||||||
全球電動施工機械市場預計到 2025 年將達到 158 億美元,預計到 2035 年將達到 932 億美元,年複合成長率為 20.8%。
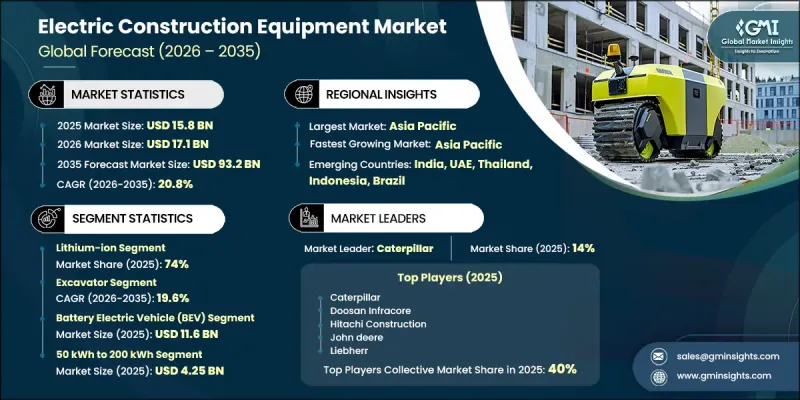
這一成長主要得益於更嚴格的環境法規、不斷擴大的財政獎勵,以及燃料消耗和維護需求降低所帶來的長期成本效益。建設產業正日益採用電動機械,以提高營運效率並符合永續性目標。快速充電系統、電池更換功能和數位化監控解決方案等技術進步正在提升設備的效能和易用性。此外,互聯技術的整合提高了設備管理和預測性維護的準確性。亞太地區預計將憑藉其對大規模基礎建設和電氣化的強大政策支持,成為市場的主要驅動力。電動機械的持續創新和對清潔建築技術的不斷增加投資,進一步鞏固了市場前景,電動施工機械正成為未來基礎設施建設的關鍵組成部分。
| 市場範圍 | |
|---|---|
| 開始年份 | 2025 |
| 預測期 | 2026-2035 |
| 上市時的市場規模 | 158億美元 |
| 預測金額 | 932億美元 |
| 複合年成長率 | 20.8% |
工程機械市場也受惠於對先進高效機械日益成長的需求,以滿足現代建築的要求。減少排放氣體和提高作業效率的日益重視正在推動建築工地對動力設備的採用。北美經濟成長,在更嚴格的排放氣體法規和對永續建築實踐日益重視的推動下,進一步促進了市場擴張。降低動力設備高昂初始成本的財政獎勵也促進了其普及。
預計到2025年,鋰離子電池市佔率將達到74%,並在2035年之前以21%的複合年成長率成長。這一主導地位主要得益於市場對高效能儲能解決方案日益成長的需求,這些解決方案具有更長的運作和更快的充電速度。鋰離子電池在提高大型和小型電動施工機械的效率和可靠性方面發揮著至關重要的作用。
預計到2025年,鑽機市佔率將達到57%,並在2026年至2035年間以19.6%的複合年成長率成長。電動鑽孔機的需求不斷成長,這得益於其柔軟性和對各種建設活動的適應性。此外,其低噪音和對環境影響小的特徵也進一步促進了其應用,尤其是在城市發展和基礎設施項目中。
預計2025年,中國電動施工機械市場規模將達24.7億美元。快速的都市化、大規模的基礎設施投資以及環保施工機械的日益普及,都為中國在該市場的強勁地位提供了有力支撐。政府旨在推廣清潔能源和減少排放的各項舉措,進一步加速了市場成長,並鞏固了中國在該地區的主導地位。
目錄
第1章:調查方法和範圍
第2章執行摘要
第3章業界考察
- 生態系分析
- 供應商情況
- 原物料供應商
- 零件製造商
- 電池製造商
- 設備製造商
- 銷售代理商和經銷商
- 售後市場供應商
- 成本結構
- 利潤率
- 每個階段增加的價值
- 垂直整合趨勢
- 顛覆者
- 供應商情況
- 影響因素
- 促進因素
- 嚴格的排放法規
- 降低電池成本
- 都市化和基礎設施發展
- 電池和動力傳動系統技術的進步
- 產業潛在風險與挑戰
- 電氣設備的初始成本高
- 充電基礎設施不足
- 市場機遇
- 擴大車隊向純電動車和混合動力汽車的轉型
- 遠端資訊處理和智慧車隊管理的整合
- 促進因素
- 技術趨勢與創新生態系統
- 目前技術
- 新興技術
- 成長潛力分析
- 監理情勢
- 北美洲
- 通貨膨脹控制法
- 空氣清淨法
- 歐洲
- 歐洲綠色新政
- 歐7排放氣體標準
- 亞太地區
- 新能源汽車(NEV)信用政策
- 汽車業標準 (AIS) 156
- 拉丁美洲
- 2030 年計畫概述
- 墨西哥的NOM排放標準
- 中東和非洲
- 阿拉伯聯合大公國2050年淨零排放策略
- 南非綠色交通戰略
- 北美洲
- 波特五力分析
- PESTEL 分析
- 專利分析(基於初步研究)
- 價格分析(基於初步調查)
- 對過去價格趨勢的分析
- 按玩家類型分類的定價策略
- 生產能力和生產趨勢(基於初步調查)
- 按地區和主要生產商分類的已安裝產能
- 設備運轉率和擴建計劃
- 交易數據分析(基於付費資料庫)
- 進出口量和進出口額的趨勢
- 主要貿易走廊及關稅的影響
- 永續性和環境方面
- 永續計劃
- 減少廢棄物策略
- 生產中的能源效率
- 具有環保意識的舉措
- 關於碳足跡的考量
- 人工智慧和生成式人工智慧對市場的影響
- 利用人工智慧改造現有經營模式
- 針對特定領域的生成式人工智慧應用案例和實施藍圖
- 風險、限制和監管考量
- 預測假設和情境分析(基於初步研究)
- 基本案例-驅動複合年成長率的關鍵宏觀經濟與產業變量
- 樂觀情境-宏觀經濟與產業的順風
- 悲觀情景-宏觀經濟放緩或產業逆風
第4章 競爭情勢
- 介紹
- 企業市佔率分析
- 主要市場公司的競爭分析
- 競爭定位矩陣
- 企業級分層基準測試
- 層級分類標準與選擇標準
- 按銷售額、地區和創新能力分類的層級定位矩陣。
- 主要進展
- 併購
- 夥伴關係和聯盟
- 新產品發布
- 業務拓展計劃及資金籌措
第5章 市場估價與預測:依車型分類,2022-2035年
- 挖土機
- 裝載機
- 推土機
- 起重機
- 自動卸貨卡車
- 滾筒
- 其他
第6章 市場估價與預測:依電池容量分類,2022-2035年
- 小於 50 千瓦時
- 50 kWh~200 kWh
- 超過 200 千瓦時
第7章 市場估計與預測:依電池技術分類,2022-2035年
- 鉛酸電池
- 鋰離子
- 鎳氫化物
第8章 市場估算與預測:依最終使用者分類,2022-2035年
- 建造
- 礦業
- 物料輸送
- 農業
- 其他
第9章 市場估計與預測:依動力來源,2022-2035年
- 電池式電動車(BEV)
- 插電式混合動力汽車(PHEV)
第10章 市場估價與預測:依地區分類,2022-2035年
- 北美洲
- 美國
- 加拿大
- 歐洲
- 英國
- 德國
- 法國
- 義大利
- 西班牙
- 比利時
- 荷蘭
- 瑞典
- 俄羅斯
- 亞太地區
- 中國
- 印度
- 日本
- 澳洲
- 新加坡
- 韓國
- 越南
- 印尼
- 拉丁美洲
- 巴西
- 墨西哥
- 阿根廷
- 中東和非洲(MEA)
- 南非
- 沙烏地阿拉伯
- 阿拉伯聯合大公國
第11章:公司簡介
- 世界公司
- Caterpillar
- CNH Industrial
- Hitachi Construction Machinery
- JCB
- John Deere
- Komatsu
- Kubota
- Liebherr
- Sandvik
- 當地公司
- Develon
- Doosan Infracore
- Hyundai Construction Equipment
- LiuGong Machinery
- Manitou
- Mecalac
- SDLG
- 新興企業
- Avant Tecno Oy
- Kramer-Werke
- Sunward Intelligent Equipment
- Zoomlion Heavy Industry Science & Technology
The Global Electric Construction Equipment Market was valued at USD 15.8 billion in 2025 and is estimated to grow at a CAGR of 20.8% to reach USD 93.2 billion by 2035.
Growth is driven by stricter environmental regulations, increasing financial incentives, and the long-term cost advantages associated with reduced fuel consumption and maintenance requirements. The construction sector is increasingly adopting electrified machinery to align with sustainability goals and improve operational efficiency. Technological advancements such as fast-charging systems, battery-swapping capabilities, and digital monitoring solutions are enhancing equipment performance and usability. In addition, the integration of connected technologies is enabling better equipment management and predictive maintenance. Asia-Pacific is expected to lead the market due to extensive infrastructure development and strong policy support for electrification. Continuous innovation in electric machinery and increasing investment in clean construction technologies are further strengthening the market outlook, positioning electric construction equipment as a key component of future infrastructure development.
| Market Scope | |
|---|---|
| Start Year | 2025 |
| Forecast Year | 2026-2035 |
| Start Value | $15.8 Billion |
| Forecast Value | $93.2 Billion |
| CAGR | 20.8% |
The electric construction equipment market is also benefiting from the growing demand for advanced and efficient machinery that supports modern construction requirements. Increasing focus on reducing emissions and improving operational productivity is encouraging the adoption of electrified equipment across job sites. Economic growth in North America is further supporting market expansion, driven by stricter emission standards and a growing emphasis on sustainable construction practices. Financial incentives aimed at reducing the high initial cost of electric equipment are also contributing to increased adoption.
The lithium-ion segment held a 74% share in 2025 and is expected to grow at a CAGR of 21% through 2035. This dominance is attributed to the increasing need for high-performance energy storage solutions that offer longer operational life and faster charging capabilities. These batteries play a critical role in enhancing the efficiency and reliability of both heavy-duty and compact electric construction equipment.
The excavator segment accounted for 57% share in 2025 and is projected to grow at a CAGR of 19.6% from 2026 to 2035. Demand for electric excavators is rising due to their flexibility and suitability for a wide range of construction activities. Their ability to operate with lower noise levels and reduced environmental impact further supports adoption, particularly in urban and infrastructure development projects.
China Electric Construction Equipment Market generated USD 2.47 billion in 2025. The country's strong position is supported by rapid urbanization, large-scale infrastructure investments, and increasing adoption of environmentally sustainable construction machinery. Government initiatives aimed at promoting clean energy and reducing emissions are further strengthening market growth, reinforcing China's leadership in the regional landscape.
Key companies operating in the Global Electric Construction Equipment Market include Komatsu, Caterpillar, Volvo Construction Equipment, Hitachi Construction Machinery, JCB, Liebherr, Hyundai Construction Equipment, Doosan Infracore, CNH Industrial, John Deere, and Kubota. Companies in the Electric Construction Equipment Market are focusing on innovation, electrification strategies, and strategic partnerships to strengthen their market position. They are investing in advanced battery technologies and energy management systems to improve performance and efficiency. Many players are expanding their product portfolios with fully electric and hybrid equipment to meet evolving regulatory and customer demands. Strategic collaborations with technology providers are enabling the integration of digital solutions such as remote monitoring and predictive maintenance. Additionally, companies are increasing production capacity and strengthening supply chains to support rising demand.
Table of Contents
Chapter 1 Methodology & Scope
- 1.1 Research approach
- 1.2 Quality Commitments
- 1.2.1 GMI AI policy & data integrity commitment
- 1.2.1.1 Source consistency protocol
- 1.2.1 GMI AI policy & data integrity commitment
- 1.3 Research Trail & Confidence Scoring
- 1.3.1 Research Trail Components
- 1.3.2 Scoring Components
- 1.4 Data Collection
- 1.4.1 Partial list of primary sources
- 1.5 Data mining sources
- 1.5.1 Paid sources
- 1.5.1.1 Sources, by region
- 1.5.1 Paid sources
- 1.6 Base estimates and calculations
- 1.6.1 Base year calculation for any one approach
- 1.7 Forecast
- 1.7.1 Quantified market impact analysis
- 1.7.1.1 Mathematical impact of growth parameters on forecast
- 1.7.1 Quantified market impact analysis
- 1.8 Research transparency addendum
- 1.8.1 Source attribution framework
- 1.8.2 Quality assurance metrics
- 1.8.3 Our commitment to trust
Chapter 2 Executive Summary
- 2.1 Industry 360° synopsis
- 2.2 Key market trends
- 2.2.1 Regional
- 2.2.2 Equipment
- 2.2.3 Battery Capacity
- 2.2.4 Battery Technology
- 2.2.5 End-User
- 2.2.6 Power Source
- 2.3 TAM Analysis, 2026-2035
- 2.4 CXO perspectives: Strategic imperatives
Chapter 3 Industry Insights
- 3.1 Industry ecosystem analysis
- 3.1.1 Supplier landscape
- 3.1.1.1 Raw material suppliers
- 3.1.1.2 Component manufacturers
- 3.1.1.3 Battery manufacturers
- 3.1.1.4 Equipment manufacturers
- 3.1.1.5 Distributors and dealers
- 3.1.1.6 Aftermarket suppliers
- 3.1.2 Cost structure
- 3.1.3 Profit margin
- 3.1.4 Value addition at each stage
- 3.1.5 Vertical integration trends
- 3.1.6 Disruptors
- 3.1.1 Supplier landscape
- 3.2 Impact on forces
- 3.2.1 Growth drivers
- 3.2.1.1 Stringent emission regulations
- 3.2.1.2 Declining battery costs
- 3.2.1.3 Urbanization & infrastructure development
- 3.2.1.4 Advancements in battery & powertrain technology
- 3.2.2 Industry pitfalls & challenges
- 3.2.2.1 High upfront cost of electric equipment
- 3.2.2.2 Limited charging infrastructure
- 3.2.3 Market opportunities
- 3.2.3.1 Growth in BEV and hybrid fleet transition
- 3.2.3.2 Integration of telematics & smart fleet management
- 3.2.1 Growth drivers
- 3.3 Technology trends & innovation ecosystem
- 3.3.1 Current technologies
- 3.3.2 Emerging technologies
- 3.4 Growth potential analysis
- 3.5 Regulatory landscape
- 3.5.1 North America
- 3.5.1.1 Inflation Reduction Act
- 3.5.1.2 Clean Air Act
- 3.5.2 Europe
- 3.5.2.1 European Green Deal
- 3.5.2.2 Euro 7 Emission Standards
- 3.5.3 Asia-Pacific
- 3.5.3.1 New Energy Vehicle (NEV) Credit Policy
- 3.5.3.2 Automotive Industry Standard (AIS) 156
- 3.5.4 Latin America
- 3.5.4.1 Programa Rota 2030
- 3.5.4.2 Mexican NOM Emissions Standards
- 3.5.5 Middle East & Africa
- 3.5.5.1 UAE Net Zero 2050 Strategy
- 3.5.5.2 South Africa Green Transport Strategy
- 3.5.1 North America
- 3.6 Porter's analysis
- 3.7 PESTEL analysis
- 3.8 Patent analysis (Driven by Primary Research)
- 3.9 Pricing Analysis (Driven by Primary Research)
- 3.9.1 Historical Price Trend Analysis
- 3.9.2 Pricing Strategy by Player Type
- 3.10 Capacity & Production Landscape (Driven by Primary Research)
- 3.10.1 Installed Capacity by Region & Key Producer
- 3.10.2 Capacity Utilization Rates & Expansion Pipelines
- 3.11 Trade Data Analysis (Driven by Paid Database)
- 3.11.1 Import/Export Volume & Value Trends
- 3.11.2 Key Trade Corridors & Tariff Impact
- 3.12 Sustainability and environmental aspects
- 3.12.1 Sustainable practices
- 3.12.2 Waste reduction strategies
- 3.12.3 Energy efficiency in production
- 3.12.4 Eco-friendly initiatives
- 3.12.5 Carbon footprint considerations
- 3.13 Impact of AI & generative AI on the market
- 3.13.1 AI-driven disruption of existing business models
- 3.13.2 GenAI use cases & adoption roadmap by segment
- 3.13.3 Risks, limitations & regulatory considerations
- 3.14 Forecast assumptions & scenario analysis (Driven by Primary Research)
- 3.14.1 Base Case - key macro & industry variables driving CAGR
- 3.14.2 Optimistic Scenarios - Favorable Macro and Industry Tailwinds
- 3.14.3 Pessimistic Scenario - Macroeconomic slowdown or industry headwinds
Chapter 4 Competitive Landscape, 2025
- 4.1 Introduction
- 4.2 Company market share analysis
- 4.2.1 North America
- 4.2.2 Europe
- 4.2.3 Asia Pacific
- 4.2.4 Latin America
- 4.2.5 MEA
- 4.3 Competitive analysis of major market players
- 4.4 Competitive positioning matrix
- 4.5 Company Tier Benchmarking
- 4.5.1 Tier Classification Criteria & Qualifying Thresholds
- 4.5.2 Tier Positioning Matrix by Revenue, Geography & Innovation
- 4.6 Key developments
- 4.6.1 Mergers & acquisitions
- 4.6.2 Partnerships & collaborations
- 4.6.3 New product launches
- 4.6.4 Expansion plans and funding
Chapter 5 Market Estimates & Forecast, By Equipment, 2022 - 2035 ($ Bn, Units)
- 5.1 Key trends
- 5.2 Excavators
- 5.3 Loaders
- 5.4 Bulldozers
- 5.5 Cranes
- 5.6 Dump Trucks
- 5.7 Roller
- 5.8 Others
Chapter 6 Market Estimates & Forecast, By Battery Capacity , 2022 - 2035 ($ Bn, Units)
- 6.1 Key trends
- 6.2 Less than 50 kWh
- 6.3 50 kWh to 200 kWh
- 6.4 More than 200 kWh
Chapter 7 Market Estimates & Forecast, By Battery Technology, 2022 - 2035 ($ Bn, Units)
- 7.1 Key trends
- 7.2 Lead-acid
- 7.3 Lithium-ion
- 7.4 Nickel-metal hydride
Chapter 8 Market Estimates & Forecast, By End-User, 2022 - 2035 ($ Bn, Units)
- 8.1 Key trends
- 8.2 Construction
- 8.3 Mining
- 8.4 Material Handling
- 8.5 Agriculture
- 8.6 Others
Chapter 9 Market Estimates & Forecast By Power Source, 2022 - 2035 ($ Bn, Units)
- 9.1 Key trends
- 9.2 Battery Electric Vehicles (BEV)
- 9.3 Plug-in Hybrid Electric Vehicles (PHEV)
Chapter 10 Market Estimates & Forecast, By Region, 2022 - 2035 ($ Bn, Units)
- 10.1 Key trends
- 10.2 North America
- 10.2.1 US
- 10.2.2 Canada
- 10.3 Europe
- 10.3.1 UK
- 10.3.2 Germany
- 10.3.3 France
- 10.3.4 Italy
- 10.3.5 Spain
- 10.3.6 Belgium
- 10.3.7 Netherlands
- 10.3.8 Sweden
- 10.3.9 Russia
- 10.4 Asia Pacific
- 10.4.1 China
- 10.4.2 India
- 10.4.3 Japan
- 10.4.4 Australia
- 10.4.5 Singapore
- 10.4.6 South Korea
- 10.4.7 Vietnam
- 10.4.8 Indonesia
- 10.5 Latin America
- 10.5.1 Brazil
- 10.5.2 Mexico
- 10.5.3 Argentina
- 10.6 MEA
- 10.6.1 South Africa
- 10.6.2 Saudi Arabia
- 10.6.3 UAE
Chapter 11 Company Profiles
- 11.1 Global players
- 11.1.1 Caterpillar
- 11.1.2 CNH Industrial
- 11.1.3 Hitachi Construction Machinery
- 11.1.4 JCB
- 11.1.5 John Deere
- 11.1.6 Komatsu
- 11.1.7 Kubota
- 11.1.8 Liebherr
- 11.1.9 Sandvik
- 11.2 Regional players
- 11.2.1 Develon
- 11.2.2 Doosan Infracore
- 11.2.3 Hyundai Construction Equipment
- 11.2.4 LiuGong Machinery
- 11.2.5 Manitou
- 11.2.6 Mecalac
- 11.2.7 SDLG
- 11.3 Emerging players
- 11.3.1 Avant Tecno Oy
- 11.3.2 Kramer-Werke
- 11.3.3 Sunward Intelligent Equipment
- 11.3.4 Zoomlion Heavy Industry Science & Technology
 電動施工機械市場分析及預測(至2035年):依類型、產品、服務、技術、組件、應用、最終用戶及功能分類
 電動工程機械和農業機械市場-全球產業規模、佔有率、趨勢、機會和預測:按電池容量、電力燃料類型、地區和競爭格局分類,2021-2031年
 電動施工機械市場:2026-2032年全球市場預測(按型號、電池類型、電池容量、功率輸出、驅動系統、銷售管道和應用分類)
 小型電動施工機械市場:按產品類型、運作重量、應用和地區分類
 電動施工機械市場-策略分析與預測(2026-2031)
 混合施工機械市場規模、佔有率及成長分析:按設備類型、推進系統、應用、最終用戶和地區分類-2026-2033年產業預測
 2026年全球電動施工機械市場報告
 電動施工機械市場規模、佔有率及成長分析(按型號、電池容量、電池技術、動力來源、應用和地區分類)-2026-2033年產業預測小型電動建築設備市場-全球產業規模、佔有率、趨勢、機會及預測,依產品(堆高機、裝載機、挖土機、高空作業平台)、噸位(5噸以下、6至8噸、8噸以上)、地區及競爭格局分類,2021-2031年預測
 零排放工程機械市場:依設備類型、動力來源、工作重量、最終用途產業、國家及地區分類-全球產業分析、市場規模、市場佔有率及2025-2032年預測