

 |
市場調查報告書
商品編碼
2038363
貿易展覽市場機會、成長要素、產業趨勢分析及 2026-2035 年預測。Exhibition Market Opportunity, Growth Drivers, Industry Trend Analysis, and Forecast 2026 - 2035 |
||||||
2025年全球貿易展市場價值463億美元,預計到2035年將以7.5%的複合年成長率成長至985億美元。
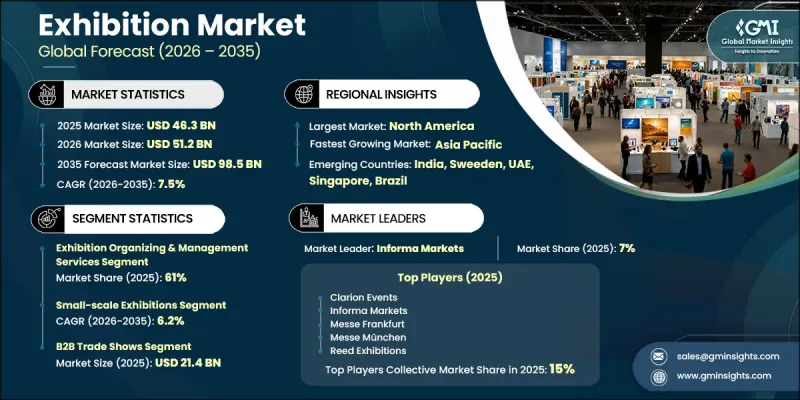
在全球商業活動日益活躍、展覽會參與度不斷提高以及對連接各行業買賣雙方的系統化網路平台的需求不斷成長的活性化,市場正穩步擴張。展會在提升產品知名度、建立商業性夥伴關係以及促進國內外市場知識交流方面繼續發揮核心作用。隨著體驗主導參與的日益普及,主辦單位被敦促設計更具互動性和數據驅動的活動形式。同時,混合型活動模式正被廣泛接受,透過實現線上線下相結合的參與方式,擴大了目標受眾範圍並提升了參與效果。國際旅行的復甦進一步促進了參展和觀眾數量的成長,增強了跨國商業機會。對永續性的期望也在改變活動設計,影響展位搭建、物流規劃和營運報告中使用的材料。全球主要城市場館的現代化改造正在增強基礎設施能力,以支持數位融合,提高連接性需求,並改善人流。基於分析的工具的廣泛應用正在幫助主辦單位展示可衡量的投資回報率,鞏固展會作為極具影響力的業務拓展管道的地位。
| 市場範圍 | |
|---|---|
| 開始年份 | 2025 |
| 預測期 | 2026-2035 |
| 上市時的市場規模 | 463億美元 |
| 預測金額 | 985億美元 |
| 複合年成長率 | 7.5% |
預計到2025年,展覽策劃與管理服務領域的市佔率將達到61%,並在2026年至2035年間以6.4%的複合年成長率成長。該領域的成長得益於其全面的服務組合,包括活動策劃、參展協調、內容開發和觀眾互動解決方案。數位化平台在註冊、觀眾追蹤和績效分析方面的整合,提高了營運效率,並提升了活動績效評估的準確性。反過來,這也有助於提高客戶維繫和產生收入。
預計到2025年,小規模貿易展市佔率將達到45%,並在2026年至2035年間以6.2%的複合年成長率成長。這類展會通常參展有限,在場地空間緊湊、展期較短的時間內吸引適量的參觀者。這種形式有利於深入交流、與目標買家互動,且參與成本低廉,因此對於尋求直接業務互動的細分行業和區域市場而言,是一種理想的選擇。
預計到2025年,美國會展市場規模將達168億美元。該市場的優勢得益於完善的會展生態系統、企業買家和賣家的積極參與,以及包括物流、技術和活動支援公司在內的成熟服務供應商網路。企業持續的行銷投入,加上遍佈多個城市的完善場館基礎設施,確保了即使在經濟情勢波動的情況下,會展活動仍能維持高水準。
目錄
第1章:調查方法和範圍
第2章執行摘要
第3章業界考察
- 生態系分析
- 供應商情況
- 解決方案供應商和平台供應商
- 實施夥伴和系統整合商
- 技術基礎設施和基礎設施供應商
- 託管服務供應商
- 最終使用者組織
- 成本結構
- 利潤率
- 每個階段增加的價值
- 垂直整合趨勢
- 顛覆者
- 供應商情況
- 影響因素
- 促進因素
- 對面對面商務人脈拓展和交易達成的需求日益成長。
- 產業專用的展覽會和細分領域展覽會的成長
- 擴大對新興市場的進入
- 疫情後的強勁復甦以及延期事件的累積
- 產業潛在風險與挑戰
- 高昂的營運成本和參與成本
- 與數位行銷和虛擬活動的競爭
- 市場機遇
- 過渡到混合展覽形式
- 擴巨量資料分析和人工智慧的應用,以提高參與者的參與度。
- 體驗式與身臨其境型展覽形式的成長
- 展覽管理在永續性方面的實際應用
- 促進因素
- 成長潛力分析
- 監理情勢
- 北美洲
- 美國殘障人士法案(ADA)
- 網路安全與基礎設施安全局(CISA)
- 歐洲
- 一般資料保護規則(GDPR)
- NIS2 指令
- 亞太地區
- 中國的網路安全法
- 數位印度及智慧城市/活動基礎設施政策
- 拉丁美洲
- 巴西國家基礎設施現代化計劃
- 墨西哥能源和工業合規標準(NOM框架)
- 中東和非洲
- 阿拉伯聯合大公國2050年淨零排放策略
- 沙烏地阿拉伯2030願景工業數位化計劃
- 北美洲
- 波特五力分析
- PESTEL 分析
- 技術趨勢與創新生態系統
- 目前技術
- 新興技術
- 專利分析(基於初步研究)
- 價格分析(基於初步調查)
- 對過去價格趨勢的分析
- 按玩家類型分類的定價策略
- 基本案例狀況
- 用例
- 永續性和環境方面
- 永續計劃
- 減少廢棄物策略
- 生產中的能源效率
- 具有環保意識的舉措
- 關於碳足跡的考量
- 人工智慧和生成式人工智慧對市場的影響
- 利用人工智慧改造現有經營模式
- 按細分市場分類的生成式人工智慧用例和部署藍圖
- 風險、限制和監管考量
- 預測假設和情境分析(基於初步研究)
- 基本案例-驅動複合年成長率的關鍵宏觀經濟與產業變量
- 樂觀情境-宏觀經濟與產業的順風
- 悲觀情景-宏觀經濟放緩或產業逆風
第4章 競爭情勢
- 介紹
- 企業市佔率分析
- 主要市場公司的競爭分析
- 競爭定位矩陣
- 企業級分層基準測試
- 層級分類標準與選擇標準
- 按銷售額、地區和創新能力分類的層級定位矩陣。
- 主要進展
- 併購
- 夥伴關係和聯盟
- 新產品發布
- 業務拓展計劃及資金籌措
第5章 市場估計與預測:依服務業分類,2022-2035年
- 展覽營運及管理服務
- 展位設計和製造服務
- 展覽支援服務
- 其他
第6章 市場估價與預測:依展覽會分類,2022-2035年
- B2B展覽會
- B2C消費者貿易展
- 混合展覽
第7章 市場估價與預測:依展覽規模分類,2022-2035年
- 小規模展覽
- 中型展覽
- 大型/大展覽
第8章 市場估計與預測:依應用領域分類,2022-2035年
- 技術與電子
- 汽車和交通運輸
- 醫療保健和醫療設備
- 工業和製造業
- 消費品和零售
- 藝術、文化、教育
- 其他
第9章 市場估計與預測:依地區分類,2022-2035年
- 北美洲
- 美國
- 加拿大
- 歐洲
- 英國
- 德國
- 法國
- 義大利
- 西班牙
- 比利時
- 荷蘭
- 瑞典
- 俄羅斯
- 亞太地區
- 中國
- 印度
- 日本
- 澳洲
- 新加坡
- 韓國
- 越南
- 印尼
- 拉丁美洲
- 巴西
- 墨西哥
- 阿根廷
- 中東和非洲(MEA)
- 南非
- 沙烏地阿拉伯
- 阿拉伯聯合大公國
第10章:公司簡介
- 世界公司
- Informa Markets(Informa)
- Reed Exhibitions
- Messe Frankfurt
- Messe Dusseldorf
- Messe Munchen
- Clarion Events
- Emerald Expositions
- 本地球員
- China Foreign Trade Centre
- Comexposium
- GL events Exhibitions
- COEX
- KINTEX
- KOTRA
- Viparis
- VNU Exhibitions Asia
- 新興企業
- Bizzabo
- Diversified Communications
- Hopin
- MCH
- RX Japan
The Global Exhibition Market was valued at USD 46.3 billion in 2025 and is estimated to grow at a CAGR of 7.5% to reach USD 98.5 billion by 2035.
The market is expanding steadily due to increasing global business activity, rising participation in trade shows, and growing demand for structured networking platforms that connect buyers and sellers across industries. Exhibitions continue to play a central role in enabling product visibility, commercial partnerships, and knowledge exchange across domestic and international markets. The growing emphasis on experience-driven engagement is encouraging organizers to design more interactive and data-enabled event formats. At the same time, hybrid event models are becoming widely accepted, allowing both physical and virtual participation, which expands audience reach and improves engagement outcomes. Recovery in international travel is further supporting exhibitor and visitor inflows, strengthening cross-border business opportunities. Sustainability expectations are also reshaping event design, influencing materials used in booth construction, logistics planning, and operational reporting. Venue modernization across key global cities is enhancing infrastructure capabilities to support digital integration, higher connectivity demands, and improved visitor navigation. Increasing use of analytics-based tools is helping organizers demonstrate measurable ROI, reinforcing exhibitions as a high-impact channel for business development.
| Market Scope | |
|---|---|
| Start Year | 2025 |
| Forecast Year | 2026-2035 |
| Start Value | $46.3 Billion |
| Forecast Value | $98.5 Billion |
| CAGR | 7.5% |
The exhibition organizing and management services segment accounted for 61% share in 2025 and is expected to grow at a CAGR of 6.4% from 2026 to 2035. Growth in this segment is supported by comprehensive service offerings that include event planning, exhibitor coordination, content development, and audience engagement solutions. The integration of digital platforms for registration, visitor tracking, and performance analysis is improving operational efficiency and enabling better measurement of event outcomes, which is strengthening client retention and revenue generation.
The small-scale exhibitions segment held 45% share in 2025 and is projected to grow at a CAGR of 6.2% between 2026 and 2035. These events typically operate with a limited number of exhibitors and attract a moderate visitor base within compact venue spaces over short durations. Their format supports focused networking, targeted buyer engagement, and cost-efficient participation, making them a preferred option for niche industries and regional markets seeking direct business interactions.
U.S. Exhibition Market captured USD 16.8 billion in 2025. Market strength is supported by a well-established exhibition ecosystem, strong participation from corporate buyers and sellers, and a mature network of service providers, including logistics, technology, and event support companies. Consistent marketing investments by enterprises, combined with extensive venue infrastructure across multiple cities, continue to sustain high levels of exhibition activity even during fluctuating economic conditions.
Key companies operating in the Global Exhibition Market include Informa Markets, Messe Frankfurt, GL events Exhibitions, Clarion Events, Messe Munchen, Reed Exhibitions, Messe Dusseldorf, Comexposium, China Foreign Trade Centre, and Emerald Expositions. Companies in the exhibition market are focusing on digital transformation, hybrid event integration, and enhanced attendee engagement to strengthen their market position. Many organizers are investing in data analytics, AI-driven matchmaking tools, and digital registration platforms to improve exhibitor and visitor experiences. Expansion of hybrid and virtual event capabilities is helping companies increase global reach and participation flexibility. Strategic partnerships with venues, technology providers, and logistics firms are enhancing operational efficiency and service delivery. Firms are also emphasizing sustainability by adopting eco-friendly event materials and reducing logistical footprints. In addition, personalization of attendee experiences through data-driven insights and targeted networking solutions is becoming a key competitive strategy to improve retention and maximize event ROI.
Table of Contents
Chapter 1 Methodology & Scope
- 1.1 Research approach
- 1.2 Quality Commitments
- 1.2.1 GMI AI policy & data integrity commitment
- 1.2.1.1 Source consistency protocol
- 1.2.1 GMI AI policy & data integrity commitment
- 1.3 Research Trail & Confidence Scoring
- 1.3.1 Research Trail Components
- 1.3.2 Scoring Components
- 1.4 Data Collection
- 1.4.1 Partial list of primary sources
- 1.5 Data mining sources
- 1.5.1 Paid sources
- 1.5.1.1 Sources, by region
- 1.5.1 Paid sources
- 1.6 Base estimates and calculations
- 1.6.1 Base year calculation for any one approach
- 1.7 Forecast
- 1.7.1 Quantified market impact analysis
- 1.7.1.1 Mathematical impact of growth parameters on forecast
- 1.7.1 Quantified market impact analysis
- 1.8 Research transparency addendum
- 1.8.1 Source attribution framework
- 1.8.2 Quality assurance metrics
- 1.8.3 Our commitment to trust
Chapter 2 Executive Summary
- 2.1 Industry 360° synopsis
- 2.2 Key market trends
- 2.2.1 Service
- 2.2.2 Exhibition
- 2.2.3 Exhibition Scale
- 2.2.4 End-Use
- 2.2.5 Regional
- 2.3 TAM Analysis, 2026-2035
- 2.4 CXO perspectives: Strategic imperatives
Chapter 3 Industry Insights
- 3.1 Industry ecosystem analysis
- 3.1.1 Supplier landscape
- 3.1.1.1 Solution providers & platform vendors
- 3.1.1.2 Implementation partners & system integrators
- 3.1.1.3 Technology enablers & infrastructure providers
- 3.1.1.4 Managed service providers
- 3.1.1.5 End-use organizations
- 3.1.2 Cost structure
- 3.1.3 Profit margin
- 3.1.4 Value addition at each stage
- 3.1.5 Vertical integration trends
- 3.1.6 Disruptors
- 3.1.1 Supplier landscape
- 3.2 Impact on forces
- 3.2.1 Growth drivers
- 3.2.1.1 Rising demand for face-to-face business networking and deal-making
- 3.2.1.2 Growth in industry-specific trade shows and niche exhibitions
- 3.2.1.3 Expansion of emerging market participation
- 3.2.1.4 Strong recovery and backlog of postponed events post-pandemic
- 3.2.2 Industry pitfalls & challenges
- 3.2.2.1 High operational and participation costs
- 3.2.2.2 Competition from digital marketing and virtual events
- 3.2.3 Market opportunities
- 3.2.3.1 Shift toward hybrid exhibition formats
- 3.2.3.2 Increasing use of data analytics and AI for attendee engagement
- 3.2.3.3 Growth of experience-driven and immersive exhibition formats
- 3.2.3.4 Sustainability-focused exhibition practices
- 3.2.1 Growth drivers
- 3.3 Growth potential analysis
- 3.4 Regulatory landscape
- 3.4.1 North America
- 3.4.1.1 U.S. Americans with Disabilities Act (ADA)
- 3.4.1.2 Cybersecurity and Infrastructure Security Agency (CISA)
- 3.4.2 Europe
- 3.4.2.1 General Data Protection Regulation (GDPR)
- 3.4.2.2 NIS2 Directive
- 3.4.3 Asia-Pacific
- 3.4.3.1 China Cybersecurity Law
- 3.4.3.2 Digital India & Smart City/Event Infrastructure Policies
- 3.4.4 Latin America
- 3.4.4.1 Brazil National Infrastructure Modernization Program
- 3.4.4.2 Mexico Energy & Industrial Compliance Standards (NOM Framework)
- 3.4.5 Middle East & Africa
- 3.4.5.1 UAE Net Zero 2050 Strategy
- 3.4.5.2 Saudi Vision 2030 Industrial Digitalization Program
- 3.4.1 North America
- 3.5 Porter's analysis
- 3.6 PESTEL analysis
- 3.7 Technology trends & innovation ecosystem
- 3.7.1 Current technologies
- 3.7.2 Emerging technologies
- 3.8 Patent analysis (Driven by Primary Research)
- 3.9 Pricing Analysis (Driven by Primary Research)
- 3.9.1 Historical Price Trend Analysis
- 3.9.2 Pricing Strategy by Player Type
- 3.10 Base case scenarios
- 3.11 Use cases
- 3.12 Sustainability and environmental aspects
- 3.12.1 Sustainable practices
- 3.12.2 Waste reduction strategies
- 3.12.3 Energy efficiency in production
- 3.12.4 Eco-friendly initiatives
- 3.12.5 Carbon footprint considerations
- 3.13 Impact of AI & generative AI on the market
- 3.13.1 AI-driven disruption of existing business models
- 3.13.2 GenAI use cases & adoption roadmap by segment
- 3.13.3 Risks, limitations & regulatory considerations
- 3.14 Forecast assumptions & scenario analysis (Driven by Primary Research)
- 3.14.1 Base Case - key macro & industry variables driving CAGR
- 3.14.2 Optimistic Scenarios - Favorable Macro and Industry Tailwinds
- 3.14.3 Pessimistic Scenario - Macroeconomic slowdown or industry headwinds
Chapter 4 Competitive Landscape, 2025
- 4.1 Introduction
- 4.2 Company market share analysis
- 4.2.1 North America
- 4.2.2 Europe
- 4.2.3 Asia Pacific
- 4.2.4 Latin America
- 4.2.5 MEA
- 4.3 Competitive analysis of major market players
- 4.4 Competitive positioning matrix
- 4.5 Company Tier Benchmarking
- 4.5.1 Tier Classification Criteria & Qualifying Thresholds
- 4.5.2 Tier Positioning Matrix by Revenue, Geography & Innovation
- 4.6 Key developments
- 4.6.1 Mergers & acquisitions
- 4.6.2 Partnerships & collaborations
- 4.6.3 New product launches
- 4.6.4 Expansion plans and funding
Chapter 5 Market Estimates & Forecast, By Service, 2022 - 2035 ($Bn)
- 5.1 Key trends
- 5.2 Exhibition Organizing & Management Services
- 5.3 Booth Design & Fabrication Services
- 5.4 Exhibition Support Services
- 5.5 Others
Chapter 6 Market Estimates & Forecast, By Exhibition, 2022 - 2035 ($Bn)
- 6.1 Key trends
- 6.2 B2B Trade Shows
- 6.3 B2C Consumer Shows
- 6.4 Hybrid Exhibitions
Chapter 7 Market Estimates & Forecast, By Exhibition Scale, 2022 - 2035 ($Bn)
- 7.1 Key trends
- 7.2 Small-Scale Exhibitions
- 7.3 Medium-Scale Exhibitions
- 7.4 Large-Scale/Mega Exhibitions
Chapter 8 Market Estimates & Forecast, By End-Use, 2022 - 2035 ($Bn)
- 8.1 Key trends
- 8.2 Technology & Electronics
- 8.3 Automotive & Transportation
- 8.4 Healthcare & Medical Devices
- 8.5 Industrial & Manufacturing
- 8.6 Consumer Goods & Retail
- 8.7 Art, Culture & Education
- 8.8 Others
Chapter 9 Market Estimates & Forecast, By Region, 2022 - 2035 ($Bn)
- 9.1 Key trends
- 9.2 North America
- 9.2.1 US
- 9.2.2 Canada
- 9.3 Europe
- 9.3.1 UK
- 9.3.2 Germany
- 9.3.3 France
- 9.3.4 Italy
- 9.3.5 Spain
- 9.3.6 Belgium
- 9.3.7 Netherlands
- 9.3.8 Sweden
- 9.3.9 Russia
- 9.4 Asia Pacific
- 9.4.1 China
- 9.4.2 India
- 9.4.3 Japan
- 9.4.4 Australia
- 9.4.5 Singapore
- 9.4.6 South Korea
- 9.4.7 Vietnam
- 9.4.8 Indonesia
- 9.5 Latin America
- 9.5.1 Brazil
- 9.5.2 Mexico
- 9.5.3 Argentina
- 9.6 MEA
- 9.6.1 South Africa
- 9.6.2 Saudi Arabia
- 9.6.3 UAE
Chapter 10 Company Profiles
- 10.1 Global players
- 10.1.1 Informa Markets (Informa)
- 10.1.2 Reed Exhibitions
- 10.1.3 Messe Frankfurt
- 10.1.4 Messe Dusseldorf
- 10.1.5 Messe Munchen
- 10.1.6 Clarion Events
- 10.1.7 Emerald Expositions
- 10.2 Regional players
- 10.2.1 China Foreign Trade Centre
- 10.2.2 Comexposium
- 10.2.3 GL events Exhibitions
- 10.2.4 COEX
- 10.2.5 KINTEX
- 10.2.6 KOTRA
- 10.2.7 Viparis
- 10.2.8 VNU Exhibitions Asia
- 10.3 Emerging players
- 10.3.1 Bizzabo
- 10.3.2 Diversified Communications
- 10.3.3 Hopin
- 10.3.4 MCH
- 10.3.5 RX Japan
 全球活動市場規模、佔有率、趨勢和成長分析報告(2026-2034)
 2026-2030年全球活動產業市場
 K-POP市場規模、佔有率和成長分析:按收入來源、藝人類型、目標受眾、平台、分銷管道和地區分類-2026-2033年產業預測全球貿易展覽市場規模、佔有率、趨勢和成長分析報告(2026-2034)
 音樂活動市場分析及預測(至2035年):類型、產品、服務、技術、組件、應用、最終用戶、形式
 音樂活動市場規模、佔有率和成長分析(按活動類型、流派、收入來源、受眾類型、場地類型和地區分類)-2026-2033年產業預測
 活動產業市場規模、佔有率和成長分析(按參與者居住、收入來源、組織者、年齡層、類型、地點和地區分類)—產業預測(2026-2033 年)
 體驗式行銷服務:全球市場佔有率和排名、總收入和需求預測(2025-2031年)活動產業市場:企業活動、社交及娛樂活動、展覽及展覽會(按地區分類),2026 年至 2032 年
 全球活動產業市場