

 |
市場調查報告書
商品編碼
2038301
電子紙顯示器控制器市場機會、成長要素、產業趨勢分析及2026-2035年預測E-Paper Display Controller Market Opportunity, Growth Drivers, Industry Trend Analysis, and Forecast 2026 - 2035 |
||||||

全球電子紙顯示器控制器市場預計到 2025 年將達到 5.925 億美元,預計到 2035 年將達到 16 億美元,年複合成長率為 10.6%。
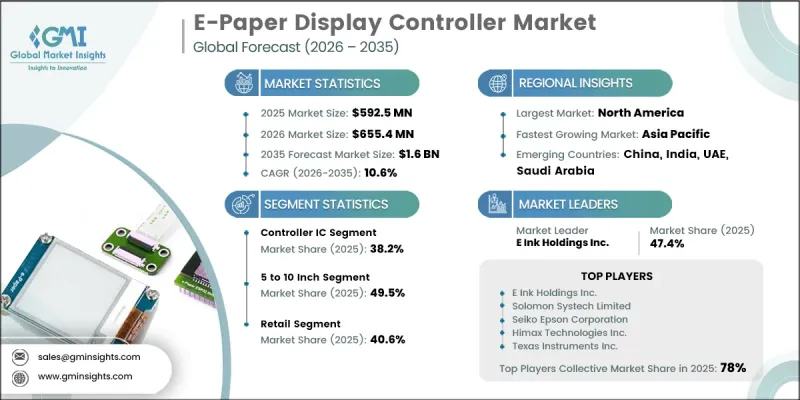
電子紙顯示器在多個行業的廣泛應用,以及對延長設備壽命的節能解決方案日益成長的需求,共同推動了電子紙顯示控制器行業的成長。互聯生態系的擴展和智慧設備使用量的增加,進一步強化了對能夠提供高效性能的先進控制器組件的需求。控制器IC架構和顯示管理技術的持續改進也促進了市場擴張。此外,對高可靠性、高清晰度和低維護成本的顯示系統的需求不斷成長,推動了電子紙顯示控制器在各種應用場景中的普及,從而提升了電子紙顯示器控制器行業的長期成長前景。
| 市場範圍 | |
|---|---|
| 開始年份 | 2025 |
| 預測期 | 2026-2035 |
| 上市時的市場規模 | 5.925億美元 |
| 預計金額 | 16億美元 |
| 複合年成長率 | 10.6% |
該市場的成長趨勢主要得益於歐洲、亞太和北美等全球主要地區對數位顯示系統和標籤技術的日益普及。企業越來越重視營運的準確性、自動化和效率,加速了電子紙解決方案的採用。同時,交通運輸和醫療保健等領域的應用場景不斷擴展,也推動了市場需求,因為這些領域需要既能提供清晰影像又能最大限度降低功耗的顯示器。此外,物聯網設備的持續普及也增加了對能夠應對頻繁更新而不增加能耗的控制器積體電路的需求。
預計到2025年,控制器IC市佔率將達到38.2%。這一主導地位源自於控制器IC在管理影像渲染、刷新週期和功耗最佳化等關鍵顯示功能方面發揮的重要作用。對數位基礎設施投資的增加以及對高效顯示性能日益成長的需求,正在推動控制器IC在各種應用領域中得到更廣泛的應用。
預計到2025年,零售領域將佔據40.6%的市場。這主要得益於自動化展示技術的快速普及,這些技術旨在簡化業務流程並提高定價準確性。企業正在利用這些系統來簡化流程、減少人工操作並提高整體效率,從而顯著提升了該領域的需求。
預計到2025年,北美電子紙顯示器控制器市佔率將達到31.2%。該地區的成長主要得益於技術的積極應用、自動化投資的增加以及智慧基礎設施的廣泛部署。各公司正致力於透過先進的顯示技術提升營運可視性和效率,而互聯系統的持續發展也進一步推動了區域市場的成長。
目錄
第1章:調查方法和範圍
第2章執行摘要
第3章業界考察
- 生態系分析
- 供應商情況
- 利潤率
- 成本結構
- 每個階段增加的價值
- 影響價值鏈的因素
- 中斷
- 影響產業的因素
- 促進因素
- 零售自動化領域電子貨架標籤(ESL)的普及應用日益廣泛。
- 物聯網設備對超低功耗顯示技術的需求日益成長
- 智慧物流和供應鏈數位化進程的擴展。
- 電子紙顯示器在家用電器和穿戴式裝置的應用正在不斷推進。
- 顯示驅動IC和控制器整合技術的進步
- 產業潛在風險與挑戰
- 電子紙顯示器生態系統和整合方面的高昂初始成本
- 與LCD/LED顯示器相比,刷新率和效能方面存在限制。
- 市場機遇
- 智慧交通和公共資訊系統的擴展
- 電子紙在醫療和工業監測系統中的應用
- 促進因素
- 成長潛力分析
- 監理情勢
- 波特五力分析
- PESTEL 分析
- 科技與創新趨勢
- 當前技術趨勢
- 新興技術
- 價格趨勢
- 按地區
- 依產品
- 定價策略
- 新興經營模式
- 合規要求
- 專利和智慧財產權分析
第4章 競爭情勢
- 介紹
- 企業市佔率分析
- 按地區
- 市場集中度分析
- 主要公司的競爭標竿分析
- 財務績效比較
- 銷售量
- 利潤率
- 研究與發展(R&D)
- 產品系列比較
- 產品線寬度
- 科技
- 創新
- 區域擴張比較
- 全球擴張分析
- 服務網路覆蓋
- 按地區分類的市場滲透率
- 競爭定位矩陣
- 領導者
- 挑戰者
- 追蹤者
- 小眾玩家
- 戰略展望矩陣
- 財務績效比較
- 主要進展
- 併購
- 夥伴關係和聯盟
- 技術進步
- 業務拓展與投資策略
- 數位轉型計劃
- 新興/新創競爭對手的發展趨勢
第5章 市場估算與預測:依積體電路類型分類,2022-2035年
- 控制器IC
- 閘極驅動器積體電路
- 源極驅動IC
- 系統晶片(SoC)
第6章 市場估價與預測:依面板尺寸分類,2022-2035年
- 小於5英寸
- 5-10英寸
- 超過10英寸
第7章 市場估計與預測:依最終用途產業分類,2022-2035年
- 家用電子電器
- 個人閱讀設備
- 家庭自動化和智慧家庭顯示器
- 消費級穿戴裝置
- 其他
- 零售
- 用於店內銷售的電子貨架標籤
- POS顯示器
- 零售廣告和促銷
- 其他
- 衛生保健
- 診斷設備顯示器
- 病患監測設備
- 醫院資訊系統
- 其他
- 運輸
- 政府/國防
- 工業應用
- 媒體與娛樂
- 其他
第8章 市場估計與預測:依地區分類,2022-2035年
- 北美洲
- 美國
- 加拿大
- 歐洲
- 德國
- 英國
- 法國
- 西班牙
- 義大利
- 荷蘭
- 亞太地區
- 中國
- 印度
- 日本
- 澳洲
- 韓國
- 拉丁美洲
- 巴西
- 墨西哥
- 阿根廷
- 中東和非洲
- 南非
- 沙烏地阿拉伯
- 阿拉伯聯合大公國
第9章:公司簡介
- 全球主要公司
- E Ink Holdings Inc.
- Seiko Epson Corporation
- Texas Instruments Inc.
- MediaTek Inc.
- NXP Semiconductors NV
- STMicroelectronics NV
- Silicon Labs
- ROHM Semiconductor
- 當地公司
- Solomon Systech Limited
- Himax Technologies Inc.
- UltraChip Inc.
- ITE Tech Inc.
- Novatek Microelectronics Corp.
- FITIPOWER Integrated Technology Inc.
- Local Players
- DAVICOM Semiconductor Inc.
- Jadard Technology Inc.
- Geniatech Inc.
The Global E-Paper Display Controller Market was valued at USD 592.5 million in 2025 and is estimated to grow at a CAGR of 10.6% to reach USD 1.6 billion by 2035.
Growth is supported by the widespread integration of electronic paper displays across multiple sectors, alongside a rising preference for energy-saving solutions that extend device lifespan. The expansion of connected ecosystems and the growing reliance on intelligent devices are further strengthening demand for advanced controller components capable of efficient performance. Continuous improvements in controller IC architecture and display management technologies are also contributing to market expansion. In addition, the rising need for reliable, readable, and low-maintenance display systems is encouraging adoption across diverse use cases, reinforcing long-term growth prospects for the e-paper display controller industry.
| Market Scope | |
|---|---|
| Start Year | 2025 |
| Forecast Year | 2026-2035 |
| Start Value | $592.5 Million |
| Forecast Value | $1.6 Billion |
| CAGR | 10.6% |
The market's upward trajectory is supported by the growing deployment of digital display systems and labeling technologies across key global regions, including Europe, Asia Pacific, and North America. Businesses are increasingly prioritizing operational accuracy, automation, and efficiency, which is accelerating the implementation of e-paper-based solutions. At the same time, expanding use cases in sectors such as transportation and healthcare are strengthening demand, as these environments require displays that offer clarity while consuming minimal power. The continued rise of IoT-enabled devices is also driving the need for controller ICs that can handle frequent updates without increasing energy consumption.
The controller ICs segment held a 38.2% share in 2025. This dominance is attributed to their essential role in managing key display functions, including image rendering, refresh cycles, and power optimization. Their growing adoption across a wide range of applications is being fueled by increasing investments in digital infrastructure and the need for efficient display performance.
The retail segment held a 40.6% share in 2025, driven by the rapid adoption of automated display technologies designed to enhance operational workflows and improve pricing accuracy. Businesses are leveraging these systems to streamline processes, reduce manual intervention, and improve overall efficiency, which is significantly boosting demand within the segment.
North America E-Paper Display Controller Market held a 31.2% share in 2025. The region's growth is being supported by strong technological adoption, increased investments in automation, and the widespread implementation of smart infrastructure. Organizations are focusing on improving operational visibility and efficiency through advanced display technologies, while ongoing advancements in connected systems continue to strengthen regional market expansion.
Key companies operating in the Global E-Paper Display Controller Market include Amcor, Biomass Packaging, Biopak, DS Smith, Elopak, Genpak, Huhtamaki, International Paper, Karl Knauer, Mondi, Nordic Paper, PacknWood, Smurfit Kappa, Sonoco Products, Stora Enso, Sulapac, Tetra Pak, TIPA, Vegware, and WestRock. Companies in the e-paper display controller market are actively adopting strategies focused on innovation, partnerships, and geographic expansion to strengthen their market position. They are investing heavily in research and development to enhance controller efficiency, reduce power consumption, and improve display performance. Strategic collaborations with technology providers and system integrators are helping firms expand their product capabilities and reach new customer segments. Many players are also focusing on expanding their presence in emerging markets to tap into growing demand. Additionally, companies are emphasizing product differentiation through advanced features and customized solutions, while optimizing supply chains and production processes to maintain competitiveness and improve profit margins.
Table of Contents
Chapter 1 Methodology and Scope
- 1.1 Market scope and definition
- 1.2 Research design
- 1.2.1 Research approach
- 1.2.2 Data collection methods
- 1.3 Data mining sources
- 1.3.1 Global
- 1.3.2 Regional/Country
- 1.4 Base estimates and calculations
- 1.4.1 Base year calculation
- 1.4.2 Key trends for market estimation
- 1.5 Primary research and validation
- 1.5.1 Primary sources
- 1.6 Forecast model
- 1.7 Research assumptions and limitations
Chapter 2 Executive Summary
- 2.1 Industry 360° synopsis, 2022 - 2035
- 2.2 Key market trends
- 2.2.1 IC Type trends
- 2.2.2 Panel Size trends
- 2.2.3 Application trends
- 2.2.4 End-user Industry trends
- 2.2.5 Regional trends
- 2.3 TAM Analysis, 2026-2035
- 2.4 CXO perspectives: Strategic imperatives
Chapter 3 Industry Insights
- 3.1 Industry ecosystem analysis
- 3.1.1 Supplier Landscape
- 3.1.2 Profit Margin
- 3.1.3 Cost structure
- 3.1.4 Value addition at each stage
- 3.1.5 Factor affecting the value chain
- 3.1.6 Disruptions
- 3.2 Industry impact forces
- 3.2.1 Growth drivers
- 3.2.1.1 Rising adoption of electronic shelf labels (ESLs) in retail automation
- 3.2.1.2 Increasing demand for ultra-low power display technologies in IoT devices
- 3.2.1.3 Expansion of smart logistics and supply chain digitization
- 3.2.1.4 Growing integration of e-paper displays in consumer electronics and wearables
- 3.2.1.5 Advancements in display driver ICs and controller integration technologies
- 3.2.2 Industry pitfalls and challenges
- 3.2.2.1 High initial cost of e-paper display ecosystems and integration
- 3.2.2.2 Limited refresh rate and performance constraints compared to LCD/LED displays
- 3.2.3 Market opportunities
- 3.2.3.1 Expansion of Smart Transportation and Public Information Systems
- 3.2.3.2 Adoption of E-Paper in Healthcare and Industrial Monitoring Systems
- 3.2.1 Growth drivers
- 3.3 Growth potential analysis
- 3.4 Regulatory landscape
- 3.4.1 North America
- 3.4.2 Europe
- 3.4.3 Asia Pacific
- 3.4.4 Latin America
- 3.4.5 Middle East & Africa
- 3.5 Porter's analysis
- 3.6 PESTEL analysis
- 3.7 Technology and Innovation landscape
- 3.7.1 Current technological trends
- 3.7.2 Emerging technologies
- 3.8 Price trends
- 3.8.1 By region
- 3.8.2 By product
- 3.9 Pricing Strategies
- 3.10 Emerging Business Models
- 3.11 Compliance Requirements
- 3.12 Patent and IP analysis
Chapter 4 Competitive Landscape, 2025
- 4.1 Introduction
- 4.2 Company market share analysis
- 4.2.1 By region
- 4.2.1.1 North America
- 4.2.1.2 Europe
- 4.2.1.3 Asia Pacific
- 4.2.1.4 Latin America
- 4.2.1.5 Middle East & Africa
- 4.2.2 Market concentration analysis
- 4.2.1 By region
- 4.3 Competitive benchmarking of key players
- 4.3.1 Financial performance comparison
- 4.3.1.1 Revenue
- 4.3.1.2 Profit margin
- 4.3.1.3 R&D
- 4.3.2 Product portfolio comparison
- 4.3.2.1 Product range breadth
- 4.3.2.2 Technology
- 4.3.2.3 Innovation
- 4.3.3 Geographic presence comparison
- 4.3.3.1 Global footprint analysis
- 4.3.3.2 Service network coverage
- 4.3.3.3 Market penetration by region
- 4.3.4 Competitive positioning matrix
- 4.3.4.1 Leaders
- 4.3.4.2 Challengers
- 4.3.4.3 Followers
- 4.3.4.4 Niche players
- 4.3.5 Strategic outlook matrix
- 4.3.1 Financial performance comparison
- 4.4 Key developments
- 4.4.1 Mergers and acquisitions
- 4.4.2 Partnerships and collaborations
- 4.4.3 Technological advancements
- 4.4.4 Expansion and investment strategies
- 4.4.5 Digital transformation initiatives
- 4.5 Emerging/ startup competitors landscape
Chapter 5 Market Estimates and Forecast, By IC Type, 2022 - 2035 (USD Million)
- 5.1 Key trends
- 5.2 Controller IC
- 5.3 Gate driver IC
- 5.4 Source driver IC
- 5.5 System-on-Chip (SoC)
Chapter 6 Market Estimates and Forecast, By Panel Size, 2022 - 2035 (USD Million)
- 6.1 Key trends
- 6.2 Less than 5 inch
- 6.3 5 to 10 inch
- 6.4 Greater than 10 inch
Chapter 7 Market Estimates and Forecast, By End-use Industry, 2022 - 2035 (USD Million)
- 7.1 Key trends
- 7.2 Consumer electronics
- 7.2.1 Personal reading devices
- 7.2.2 Home automation & smart home displays
- 7.2.3 Consumer wearables
- 7.2.4 Others
- 7.3 Retail
- 7.3.1 In-store electronic shelf labels
- 7.3.2 Point-of-sale displays
- 7.3.3 Retail advertising & promotion
- 7.3.4 Others
- 7.4 Healthcare
- 7.4.1 Diagnostic equipment displays
- 7.4.2 Patient monitoring devices
- 7.4.3 Hospital information systems
- 7.4.4 Others
- 7.5 Transportation
- 7.6 Government & defense
- 7.7 Industrial applications
- 7.8 Media & entertainment
- 7.9 Others
Chapter 8 Market Estimates and Forecast, By Region, 2022 - 2035 (USD Million)
- 8.1 Key trends
- 8.2 North America
- 8.2.1 U.S.
- 8.2.2 Canada
- 8.3 Europe
- 8.3.1 Germany
- 8.3.2 UK
- 8.3.3 France
- 8.3.4 Spain
- 8.3.5 Italy
- 8.3.6 Netherlands
- 8.4 Asia Pacific
- 8.4.1 China
- 8.4.2 India
- 8.4.3 Japan
- 8.4.4 Australia
- 8.4.5 South Korea
- 8.5 Latin America
- 8.5.1 Brazil
- 8.5.2 Mexico
- 8.5.3 Argentina
- 8.6 Middle East and Africa
- 8.6.1 South Africa
- 8.6.2 Saudi Arabia
- 8.6.3 UAE
Chapter 9 Company Profiles
- 9.1 Global Key Players
- 9.1.1 E Ink Holdings Inc.
- 9.1.2 Seiko Epson Corporation
- 9.1.3 Texas Instruments Inc.
- 9.1.4 MediaTek Inc.
- 9.1.5 NXP Semiconductors N.V.
- 9.1.6 STMicroelectronics N.V.
- 9.1.7 Silicon Labs
- 9.1.8 ROHM Semiconductor
- 9.2 Regional Players
- 9.2.1 Solomon Systech Limited
- 9.2.2 Himax Technologies Inc.
- 9.2.3 UltraChip Inc.
- 9.2.4 ITE Tech Inc.
- 9.2.5 Novatek Microelectronics Corp.
- 9.2.6 FITIPOWER Integrated Technology Inc.
- 9.3 Local Players
- 9.3.1 DAVICOM Semiconductor Inc.
- 9.3.2 Jadard Technology Inc.
- 9.3.3 Geniatech Inc.

 2026-2030年全球音訊驅動IC市場
 CXL訊號調理/重定時器IC:市場佔有率分析、產業趨勢與統計資料、成長預測(2026-2031年)
 2026年全球電子顯示器市場報告
 顯示控制器市場 - 全球產業規模、佔有率、趨勢、機會、預測:按類型、應用、地區和競爭格局分類,2021-2031年2026年第二代觸控和顯示驅動整合(TDDI)控制器全球市場報告
 電子顯示器市場:依技術、應用、終端使用者產業及地區分類
 全球顯示控制器市場規模、佔有率、趨勢和成長分析報告(2026-2034)驅動IC市場:依產品類型、應用和地區分類
 ADSL驅動器和接收器市場規模、佔有率和成長分析:按產品類型、技術、整合類型、通道類型、資料速率、電源類型、應用、地區和行業預測,2026-2033年
 顯示控制器市場分析及預測(至2035年):按類型、產品類型、技術、組件、應用、形狀、材質、設備、最終用戶和功能分類