

 |
市場調查報告書
商品編碼
2038285
連貫光學市場:商業機會、成長要素、產業趨勢分析及2026-2035年預測Coherent Optical Equipment Market Opportunity, Growth Drivers, Industry Trend Analysis, and Forecast 2026 - 2035 |
||||||
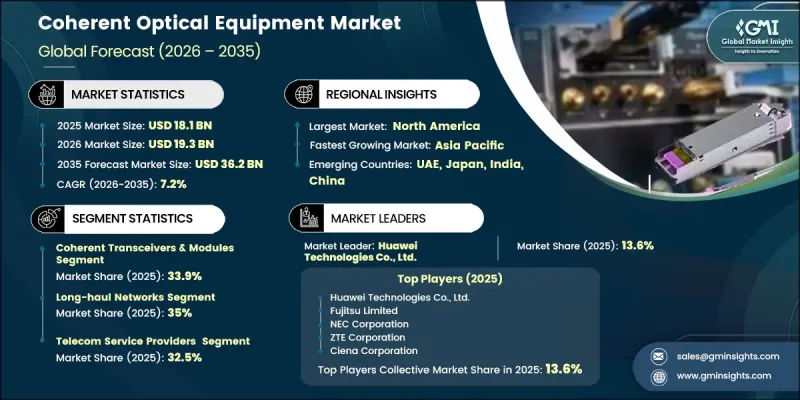
全球連貫光學市場預計到 2025 年將達到 181 億美元,預計到 2035 年將以 7.2% 的複合年成長率成長至 362 億美元。
隨著對高容量數據傳輸和高效網路效能的需求不斷成長,連貫通訊產業正穩步擴張。雲端運算的快速發展、下一代通訊網路的廣泛部署以及全球資料中心部署的持續成長是推動這一擴張的主要因素。對低延遲和高速連接日益成長的需求正迫使網路營運商採用先進的光子技術。通訊業者和政府機構為骨幹網路基礎設施現代化而進行的大力投資進一步促進了市場發展。此外,向開放且靈活的光纖網路架構的轉變正在改變部署策略,從而提高互通性並降低對單一供應商的依賴。軟體定義網路 (SDN) 方法的日益普及提高了營運效率和擴充性,使連貫光通訊技術成為面向未來的通訊生態系統的關鍵組成部分。
| 市場範圍 | |
|---|---|
| 開始年份 | 2025 |
| 預測期 | 2026-2035 |
| 上市時的市場規模 | 181億美元 |
| 預測市場規模 | 362億美元 |
| 複合年成長率 | 7.2% |
受光纖容量最大化和網路整體效率提升需求不斷成長的推動,分波多工(WDM) 設備市場預計到 2035 年將以 7.7% 的複合年成長率成長。該技術能夠透過單根光纖同時傳輸多個資料流,從而最佳化頻寬利用率。光纖基礎設施投資的增加以及先進通訊網路中大規模資料傳輸的需求,進一步加速了該市場的成長。
預計到2025年,通訊服務供應商市場佔有率將達到32.5%,這主要得益於為滿足日益成長的數據流量和不斷擴大的連接需求而對網路基礎設施進行大量升級投資。這些供應商在長途和都會區網路應用中依賴連貫光技術,從而確保可靠且高容量的通訊效能。持續的網路現代化努力以及對更快連接速度日益成長的需求,正在鞏固該領域的主導地位。
預計到2025年,北美連貫光元件市佔率將達到31.1%。這主要得益於對高頻寬連接的強勁需求以及通訊基礎設施的持續升級。該地區持續增加對先進光元件技術的投資,以滿足不斷成長的數據流量和不斷發展的數位應用需求,從而推動市場持續成長。
目錄
第1章:調查方法和範圍
第2章執行摘要
第3章業界考察
- 生態系分析
- 供應商情況
- 利潤率
- 成本結構
- 每個階段增加的價值
- 影響價值鏈的因素
- 中斷
- 影響產業的因素
- 促進因素
- 高容量資料中心互連(DCI)網路的需求日益成長
- 5G和下一代通訊基礎設施的快速擴張
- 雲端運算和超大規模資料中心的日益普及
- 人工智慧/機器學習工作負載的不斷成長正在推動對高速光纖傳輸的需求。
- 連貫光收發器技術的不斷進步
- 產業潛在風險與挑戰
- 連貫光解決方案的實施和系統整合成本高昂
- 先進光纖網路的技術複雜性與電力消耗限制
- 市場機遇
- 資料中心互連中可插拔連貫光學模組的擴展
- 開放式 ROADM 與碎片化光纖網路架構的成長
- 促進因素
- 成長潛力分析
- 監理情勢
- 北美洲
- 歐洲
- 亞太地區
- 拉丁美洲
- 中東和非洲
- 波特五力分析
- PESTEL 分析
- 科技與創新趨勢
- 當前技術趨勢
- 新興技術
- 價格趨勢(基於付費資料庫)
- 歷史價格分析(2022-2025)
- 影響價格趨勢的因素
- 區域價格波動
- 價格預測(2026-2035)
- 貿易數據分析(基於初步調查)
- 進出口量及進口額趨勢
- 主要貿易路線及關稅的影響
- 人工智慧和生成式人工智慧對市場的影響
- 利用人工智慧改造現有經營模式
- 針對特定領域的生成式人工智慧應用案例和實施藍圖
- 風險、限制和監管考量
- 生產能力和生產趨勢(基於初步調查)
- 按地區和主要生產商分類的設備產能
- 運轉率和擴張計劃
第4章 競爭情勢
- 介紹
- 企業市佔率分析
- 按地區
- 北美洲
- 歐洲
- 亞太地區
- 拉丁美洲
- 中東和非洲
- 市場集中度分析
- 按地區
- 主要市場公司的競爭分析
- 競爭定位矩陣
- 主要進展
- 併購
- 夥伴關係和聯盟
- 新產品發布
- 業務拓展計劃及資金籌措
- 企業級分層基準測試
- 層級分類標準與選擇標準
- 按收入、地區和創新能力分類的層級定位矩陣。
第5章 市場估計與預測:依組件分類,2022-2035年
- 連貫收發器和模組
- 分波多工(WDM)
- 光放大器
- 光開關
- 其他
第6章 市場估計與預測:依技術分類,2022-2035年
- 100G
- 200G
- 400G+
- 400G ZR
- 800G
- 其他
第7章 市場估計與預測:依應用領域分類,2022-2035年
- 長途網路
- 都會區網路
- 資料中心互連 (DCI)
- 潛水艇網路
第8章 市場估算與預測:依最終使用者分類,2022-2035年
- 電信服務供應商
- 資料中心營運商和雲端服務供應商
- 公司
- 其他
第9章 市場估計與預測:依地區分類,2022-2035年
- 北美洲
- 美國
- 加拿大
- 歐洲
- 德國
- 英國
- 法國
- 西班牙
- 義大利
- 荷蘭
- 亞太地區
- 中國
- 印度
- 日本
- 澳洲
- 韓國
- 拉丁美洲
- 巴西
- 墨西哥
- 阿根廷
- 中東和非洲
- 南非
- 沙烏地阿拉伯
- 阿拉伯聯合大公國
第10章:公司簡介
- 全球主要公司
- Ciena Corporation
- Huawei Technologies Co., Ltd.
- Nokia Corporation
- Cisco Systems, Inc.
- ZTE Corporation
- Fujitsu Limited
- NEC Corporation
- Juniper Networks
- Broadcom Inc.
- Marvell Technology, Inc.
- 區域擴張公司
- Ribbon Communications Operating Company, Inc.
- Adtran
- Coherent Corp.
- Lumentum
- NeoPhotonics Corporation
- 本地公司
- ZHONGJI INNOLIGHT
- Accelink Technologies
The Global Coherent Optical Equipment Market was valued at USD 18.1 billion in 2025 and is estimated to grow at a CAGR of 7.2% to reach USD 36.2 billion by 2035.
The coherent optical equipment industry is expanding steadily as demand intensifies for high-capacity data transmission and efficient network performance. Rapid growth in cloud computing, widespread rollout of next-generation communication networks, and the continuous rise in global data center deployments are key factors driving this expansion. Increasing requirements for low-latency and high-speed connectivity are pushing network operators to adopt advanced optical communication technologies. Strong investments from both telecom operators and government bodies aimed at modernizing backbone infrastructure are further supporting market development. In addition, the shift toward open and flexible optical network architectures is transforming deployment strategies, enabling greater interoperability and reduced dependence on single vendors. The growing adoption of software-defined networking approaches enhances operational efficiency and scalability, positioning coherent optical technologies as a critical component in future-ready communication ecosystems.
| Market Scope | |
|---|---|
| Start Year | 2025 |
| Forecast Year | 2026-2035 |
| Start Value | $18.1 Billion |
| Forecast Value | $36.2 Billion |
| CAGR | 7.2% |
The wavelength-division multiplexers segment is anticipated to grow at a CAGR of 7.7% through 2035, supported by rising demand for maximizing fiber capacity while improving overall network efficiency. This technology enables multiple data streams to be transmitted simultaneously through a single optical fiber, optimizing bandwidth utilization. Increased investments in optical infrastructure and the need to support large-scale data transmission across advanced communication networks are further accelerating segment growth.
The telecom service providers segment accounted for a share of 32.5% in 2025, driven by substantial investments in upgrading network infrastructure to handle increasing data traffic and expanding connectivity requirements. These providers rely on coherent optical technologies for long-distance and metro network applications, ensuring reliable and high-capacity communication performance. Continuous network modernization efforts and rising demand for faster connectivity are reinforcing the segment's leadership position.
North America Coherent Optical Equipment Market held a 31.1% share in 2025, supported by strong demand for high-bandwidth connectivity and ongoing upgrades to communication infrastructure. The region continues to witness significant investments in advanced optical technologies to support growing data traffic and evolving digital applications, contributing to sustained market growth.
Key players operating in the Global Coherent Optical Equipment Industry include Accelink Technologies, Adtran, Broadcom Inc., Ciena Corporation, Cisco Systems, Inc., Coherent Corp., Fujitsu Limited, Huawei Technologies Co., Ltd., Juniper Networks, Lumentum, Marvell Technology, Inc., NEC Corporation, NeoPhotonics Corporation, Nokia Corporation, Ribbon Communications Operating Company, Inc., ZHONGJI INNOLIGHT, and ZTE Corporation. Companies in the Coherent Optical Equipment Market are focusing on innovation, strategic alliances, and technology integration to strengthen their competitive position. They are investing in advanced optical technologies to enhance data transmission speed, capacity, and energy efficiency. Collaborations with telecom operators and cloud service providers are enabling faster deployment of next-generation network solutions. Firms are also expanding their product portfolios to support evolving network requirements and improve scalability. Additionally, companies are adopting open architecture approaches to improve interoperability and reduce vendor dependency.
Table of Contents
Chapter 1 Methodology and Scope
- 1.1 Market scope and definition
- 1.2 Research design
- 1.2.1 Research approach
- 1.2.2 Data collection methods
- 1.3 Data mining sources
- 1.3.1 Global
- 1.3.2 Regional/Country
- 1.4 Base estimates and calculations
- 1.4.1 Base year calculation
- 1.4.2 Key trends for market estimation
- 1.5 Primary research and validation
- 1.5.1 Primary sources
- 1.6 Forecast model
- 1.7 Research assumptions and limitations
Chapter 2 Executive Summary
- 2.1 Industry 360° synopsis, 2022 - 2035
- 2.2 Key market trends
- 2.2.1 Component trends
- 2.2.2 Technology trends
- 2.2.3 Application trends
- 2.2.4 End-user trends
- 2.2.5 Regional trends
- 2.3 CXO perspectives: Strategic imperatives
Chapter 3 Industry Insights
- 3.1 Industry ecosystem analysis
- 3.1.1 Supplier Landscape
- 3.1.2 Profit Margin
- 3.1.3 Cost structure
- 3.1.4 Value addition at each stage
- 3.1.5 Factor affecting the value chain
- 3.1.6 Disruptions
- 3.2 Industry impact forces
- 3.2.1 Growth drivers
- 3.2.1.1 Rising demand for high-capacity data center interconnect (DCI) networks
- 3.2.1.2 Rapid expansion of 5G and next-generation telecom infrastructure
- 3.2.1.3 Increasing adoption of cloud computing and hyperscale data centers
- 3.2.1.4 Growing AI/ML workloads driving high-speed optical transmission needs
- 3.2.1.5 Continuous advancements in coherent optical transceiver technologies
- 3.2.2 Industry pitfalls and challenges
- 3.2.2.1 High deployment and system integration costs of coherent optical solutions
- 3.2.2.2 Technical complexity and power consumption limitations in advanced optical networks
- 3.2.3 Market opportunities
- 3.2.3.1 Expansion of pluggable coherent optical modules in data center interconnect
- 3.2.3.2 Growth in Open ROADM and disaggregated optical network architectures
- 3.2.1 Growth drivers
- 3.3 Growth potential analysis
- 3.4 Regulatory landscape
- 3.4.1 North America
- 3.4.2 Europe
- 3.4.3 Asia Pacific
- 3.4.4 Latin America
- 3.4.5 Middle East & Africa
- 3.5 Porter's analysis
- 3.6 PESTEL analysis
- 3.7 Technology and Innovation landscape
- 3.7.1 Current technological trends
- 3.7.2 Emerging technologies
- 3.8 Price trends (Based on paid Database)
- 3.8.1 Historical Price Analysis (2022-2025)
- 3.8.2 Price Trend Drivers
- 3.8.3 Regional Price Variations
- 3.8.4 Price Forecast (2026-2035)
- 3.9 Trade Data Analysis (Driven by Primary Research)
- 3.9.1 Import/Export Volume & Value Trends
- 3.9.2 Key Trade Corridors & Tariff Impact
- 3.10 Impact of AI & Generative AI on the Market
- 3.10.1 AI-Driven Disruption of Existing Business Models
- 3.10.2 GenAI Use Cases & Adoption Roadmap by Segment
- 3.10.3 Risks, Limitations & Regulatory Considerations
- 3.11 Capacity & Production Landscape (Driven by Primary Research)
- 3.11.1 Installed Capacity by Region & Key Producer
- 3.11.2 Capacity Utilization Rates & Expansion Pipelines
Chapter 4 Competitive Landscape, 2025
- 4.1 Introduction
- 4.2 Company market share analysis
- 4.2.1 By region
- 4.2.1.1 North America
- 4.2.1.2 Europe
- 4.2.1.3 Asia Pacific
- 4.2.1.4 Latin America
- 4.2.1.5 Middle East & Africa
- 4.2.2 Market concentration analysis
- 4.2.1 By region
- 4.3 Competitive analysis of major market players
- 4.4 Competitive positioning matrix
- 4.5 Key developments
- 4.5.1 Mergers & acquisitions
- 4.5.2 Partnerships & collaborations
- 4.5.3 New product launches
- 4.5.4 Expansion plans and funding
- 4.6 Company tier benchmarking
- 4.6.1 Tier classification criteria & qualifying thresholds
- 4.6.2 Tier positioning matrix by revenue, geography & innovation
Chapter 5 Market Estimates and Forecast, By Component, 2022-2035 (USD Million)
- 5.1 Key trends
- 5.2 Coherent transceivers & modules
- 5.3 Wavelength-division Multiplexers (WDM)
- 5.4 Optical Amplifiers
- 5.5 Optical Switches
- 5.6 Others
Chapter 6 Market Estimates and Forecast, By Technology, 2022-2035 (USD Million)
- 6.1 Key trends
- 6.2 100G
- 6.3 200G
- 6.4 400G+
- 6.5 400G ZR
- 6.6 800G
- 6.7 Others
Chapter 7 Market Estimates and Forecast, By Application, 2022-2035 (USD Million)
- 7.1 Key trends
- 7.2 Long-haul networks
- 7.3 Metro networks
- 7.4 Data Center Interconnect (DCI)
- 7.5 Submarine networks
Chapter 8 Market Estimates and Forecast, By End User, 2022-2035 (USD Million)
- 8.1 Key trends
- 8.2 Telecom service providers
- 8.3 Data center operators & cloud service providers
- 8.4 Enterprises
- 8.5 Others
Chapter 9 Market Estimates and Forecast, By Region, 2022-2035 (USD Million)
- 9.1 Key trends
- 9.2 North America
- 9.2.1 U.S.
- 9.2.2 Canada
- 9.3 Europe
- 9.3.1 Germany
- 9.3.2 UK
- 9.3.3 France
- 9.3.4 Spain
- 9.3.5 Italy
- 9.3.6 Netherlands
- 9.4 Asia Pacific
- 9.4.1 China
- 9.4.2 India
- 9.4.3 Japan
- 9.4.4 Australia
- 9.4.5 South Korea
- 9.5 Latin America
- 9.5.1 Brazil
- 9.5.2 Mexico
- 9.5.3 Argentina
- 9.6 Middle East and Africa
- 9.6.1 South Africa
- 9.6.2 Saudi Arabia
- 9.6.3 UAE
Chapter 10 Company Profiles
- 10.1 Global Key Players
- 10.1.1 Ciena Corporation
- 10.1.2 Huawei Technologies Co., Ltd.
- 10.1.3 Nokia Corporation
- 10.1.4 Cisco Systems, Inc.
- 10.1.5 ZTE Corporation
- 10.1.6 Fujitsu Limited
- 10.1.7 NEC Corporation
- 10.1.8 Juniper Networks
- 10.1.9 Broadcom Inc.
- 10.1.10 Marvell Technology, Inc.
- 10.2 Regional Players
- 10.2.1 Ribbon Communications Operating Company, Inc.
- 10.2.2 Adtran
- 10.2.3 Coherent Corp.
- 10.2.4 Lumentum
- 10.2.5 NeoPhotonics Corporation
- 10.3 Local Players
- 10.3.1 ZHONGJI INNOLIGHT
- 10.3.2 Accelink Technologies
 連貫光學市場報告:按技術、設備、應用、最終用戶和地區分類(2026-2034 年)
 美國出口限制擴大帶來的光連接模組供應鏈重組與機會
 全球連貫光學市場規模、佔有率、趨勢和成長分析報告(2026-2034)
 連貫光學設備市場規模、佔有率及成長分析(按組件、技術、設備、應用、最終用戶和地區分類)-2026-2033年產業預測
 連貫光纖通訊設備:全球市佔率及排名、總收入及需求預測(2025-2031年)
 IP-over-DWDM可插拔市場報告:至2031年的趨勢、預測與競爭分析
 全球連貫光學市場全球連貫光學儀器市場規模(按儀器、應用、最終用戶、地區、範圍和預測)