

 |
市場調查報告書
商品編碼
2027585
2026 年至 2035 年嬰幼兒玩具市場的商業機會、成長要素、產業趨勢與預測。Infants and Toddlers Toy Market Opportunity, Growth Drivers, Industry Trend Analysis, and Forecast 2026 - 2035 |
||||||
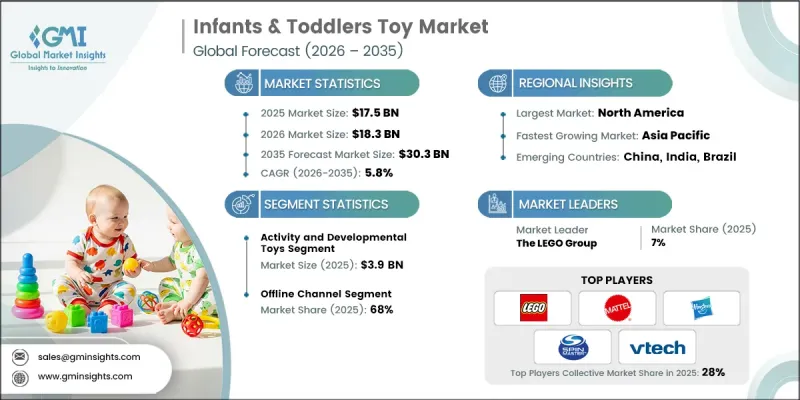
全球嬰幼兒玩具市場預計到 2025 年價值 175 億美元,預計到 2035 年將達到 303 億美元,年複合成長率為 5.8%。
玩具產業正經歷變革,傳統玩具正逐漸被旨在支援兒童早期發展的連網互動解決方案所取代。製造商們在產品中融入了增強兒童參與度的數位化功能,同時優先考慮安全性和易用性。行動連線的日益普及使家長能夠監控孩子的使用情況,並更有效地管理他們的遊戲體驗。此外,智慧開發工具的興起也反映了現代家庭對寓教於樂產品的日益成長的需求。改良的產品設計,加上以安全為中心的創新,正在增強消費者的信心。隨著互聯技術的日益普及,各公司正利用這些進步開發差異化產品,以吸引那些見多識廣、精通技術的消費者,最終推動市場的長期成長。
| 市場範圍 | |
|---|---|
| 開始年份 | 2025 |
| 預測期 | 2026-2035 |
| 初始市場規模 | 175億美元 |
| 預測金額 | 303億美元 |
| 複合年成長率 | 5.8% |
互聯技術的日益普及正在改變嬰幼兒玩具市場。製造商不斷推出提升易用性、沉浸感和安全性的功能。玩具擴大整合安全的數位系統,在保護使用者資料的同時,也能妥善管理內容存取權限。這些創新有助於緩解家長對隱私和過度接觸數位內容的擔憂。智慧功能透過提供產品使用情況的即時洞察和最佳化遊戲時間管理,提升了整體使用者體驗。此外,它們還透過與數位平台的整合,為早期學習提供系統化和互動式的參與機會。隨著互聯生態系統在消費品領域日益普及,智慧益智玩具作為高階產品正受到越來越多的關注,為瞄準高所得消費群體的公司創造了巨大的成長機會。
益智玩具佔22.2%的市場佔有率,預計2025年市場規模將達到39億美元。這類產品旨在支持幼兒早期發展的各個階段,並適用於廣泛的年齡層。家長們希望找到既能帶來長期發展益處又符合嚴格安全標準的玩具,這推動了此類玩具的強勁需求。此外,這類玩具的互動性也使其持續受到關注,因為它們能夠促進感官參與和身體活動。
2025年,線下通路將佔據68%的市場。消費者仍然更傾向於在實體店購物,因為他們可以在購買前親身檢查產品的品質、材質和安全特性。實體店在提供個人化建議、幫助消費者選擇符合其年齡需求和安全疑慮的產品方面,仍然發揮著至關重要的作用。
美國嬰幼兒玩具市場佔82.2%的市場佔有率,預計2025年市場規模將達33億美元。該地區憑藉其完善的分銷體系和教育技術的高普及率,在全球市場中保持著強勁的地位。消費者對產品安全和品質標準的重視持續影響他們的購買決策,尤其是在高階市場。法律規範和認證要求進一步推動了玩具市場向技術先進且注重安全性的方向發展。
目錄
第1章:調查方法和範圍
第2章執行摘要
第3章業界考察
- 生態系分析
- 供應商情況
- 利潤率
- 每個階段增加的價值
- 影響價值鏈的因素
- 影響產業的因素
- 促進因素
- 對環保和永續玩具的需求日益成長
- 「智慧」遊戲的技術進步
- 都市化過程和對幼兒教育的重視
- 產業潛在風險與挑戰
- 高階教育模式的初始成本相對較高。
- 科技快速過時
- 機會
- 拓展線上銷售管道
- 整合智慧功能(藍牙、感測器)
- 促進因素
- 成長潛力分析
- 未來市場趨勢
- 科技與創新趨勢
- 當前技術趨勢
- 新興技術
- 價格趨勢
- 過去價格趨勢分析(基於初步調查)(2019-2024 年)
- 根據業務類型(高階/經濟/預算)制定定價策略(基於初步調查)
- 區域價格波動和購買力平價(基於初步調查)
- 原物料成本對零售價格的影響(基於初步調查)
- 監理情勢
- 標準和合規要求
- 區域法規結構
- 認證標準
- 專利趨勢(基於初步調查)
- 按技術類別分類的專利申請趨勢(基於初步調查)
- 主要專利擁有者和創新領導者(基於初步調查)
- 專利活動的地理分佈(基於初步調查)
- 新興專利叢集(智慧玩具、環保材料)(基於初步研究)
- 波特五力分析
- PESTEL 分析
- 交易數據分析(基於初步調查)
- 按HS編碼分類的進出口量和進口額趨勢(基於初步調查)
- 主要貿易走廊和關稅的影響(基於初步調查)
- 主要出口國(中國、越南、泰國)(根據初步調查)
- 主要進口國(美國、英國、德國、澳洲)(基於初步調查)
- 人工智慧和生成式人工智慧對市場的影響
- 利用人工智慧革新傳統玩具的設計與開發
- GenAI 應用案例(個人化玩具、語音互動式學習、自適應遊戲)
- 針對特定產品區隔的推廣藍圖(教育玩具 vs. 娛樂玩具)
- 風險、限制和監管方面的考量(資料隱私、螢幕時間問題)
- 分銷基礎設施和通路滲透狀況(基於初步調查)
- 按地區和類型(現代零售與傳統零售)分類的通路覆蓋率(基於初步調查)
- 最後一公里基礎設施差異和新管道(D2C、社交電商)的轉變(基於初步研究)
第4章 競爭情勢
- 介紹
- 企業市佔率分析
- 按地區
- 企業矩陣分析
- 主要市場公司的競爭分析
- 競爭定位矩陣
- 主要進展
- 併購
- 夥伴關係與合作
- 新產品發布
- 業務拓展計劃
第5章 市場估算與預測:依產品類型分類,2022-2035年
- 教育玩具
- 絨毛玩具
- 活動和益智玩具
- 搭乘用玩具
- 組裝玩具
- 洗澡玩具
- 其他(磨牙玩具、拉扯玩具)
第6章 市場估計與預測:依材料分類,2022-2035年
- 塑膠
- 木製的
- 布料/紡織品
- 矽膠/橡膠
- 環保材料(例如竹子、再生材料)
第7章 市場估計與預測:依年齡層別分類,2022-2035年
- 0-6個月
- 6-12個月大
- 1-2歲
- 2-4歲
第8章 市場估計與預測:依價格分類,2022-2035年
- 低的
- 中等的
- 高的
第9章 市場估價與預測:依通路分類,2022-2035年
- 線上
- 電子商務平台
- 品牌官方網站
- 離線
- 超級市場/大賣場
- 玩具店
- 百貨公司
第10章 市場估價與預測:依地區分類,2022-2035年
- 北美洲
- 美國
- 加拿大
- 歐洲
- 德國
- 英國
- 法國
- 義大利
- 西班牙
- 亞太地區
- 中國
- 日本
- 印度
- 澳洲
- 韓國
- 拉丁美洲
- 巴西
- 墨西哥
- 阿根廷
- 中東和非洲
- 南非
- 沙烏地阿拉伯
- 阿拉伯聯合大公國
第11章:公司簡介
- Chicco(Artsana Group)
- Clementoni SpA
- Hape International
- Hasbro, Inc.
- JAKKS Pacific, Inc.
- Janod(Juratoys Group)
- Little Tikes(MGA Entertainment)
- Mattel, Inc.
- Melissa & Doug
- Playmobil(geobra Brandstatter)
- Ravensburger AG
- Spin Master Corp.
- The LEGO Group
- Tomy International
- VTech Holdings Ltd.
The Global Infants and Toddlers Toy Market was valued at USD 17.5 billion in 2025 and is estimated to grow at a CAGR of 5.8% to reach USD 30.3 billion by 2035.
The industry is transforming traditional toys are increasingly being replaced by connected and interactive solutions designed to support early development. Manufacturers are incorporating digital features that enhance engagement while prioritizing safety and usability. The rising adoption of mobile-enabled functionality is allowing parents to monitor usage and manage play experiences more effectively. In addition, the shift toward smart developmental tools reflects growing demand from modern households seeking products that combine education and entertainment. Enhanced product design, coupled with safety-focused innovation, is strengthening consumer confidence. As connected technologies become more prevalent, companies are leveraging these advancements to create differentiated offerings that appeal to a more informed and technology-oriented customer base, ultimately driving long-term market expansion.
| Market Scope | |
|---|---|
| Start Year | 2025 |
| Forecast Year | 2026-2035 |
| Start Value | $17.5 Billion |
| Forecast Value | $30.3 Billion |
| CAGR | 5.8% |
The growing influence of connected technology is reshaping the infant and toddler toy market, as manufacturers introduce features that improve usability, engagement, and safety. Toys are increasingly equipped with secure digital systems that protect user data while ensuring controlled access to content. These innovations are helping address parental concerns around privacy and excessive digital exposure. Smart functionalities are enhancing the overall user experience by providing real-time insights into product usage and enabling better management of playtime. Integration with digital platforms is also supporting early learning by delivering structured and interactive engagement opportunities. As connected ecosystems become more common across consumer products, smart developmental toys are gaining traction as premium offerings, creating significant growth opportunities for companies targeting higher-income consumer segments.
The activity and developmental toys accounted for 22.2% share, generating USD 3.9 billion in 2025. These products are designed to support various stages of early growth, making them highly relevant across multiple age groups. Their strong demand is driven by parents seeking toys that offer long-term developmental benefits while adhering to stringent safety requirements. These toys continue to attract attention due to their interactive nature, which encourages sensory engagement and physical activity.
The offline distribution channels segment held a 68% share in 2025. Consumers continue to prefer in-store purchasing due to the ability to physically examine product quality, materials, and safety features before making a decision. Physical retail outlets remain important for offering personalized guidance and helping buyers select products that align with age-specific needs and safety considerations.
United States Infants and Toddlers Toy Market held an 82.2% share, generating USD 3.3 billion in 2025. The region maintains a strong position in the global market due to its well-developed distribution infrastructure and high adoption of educational technologies. A strong emphasis on product safety and quality standards continues to influence purchasing decisions, particularly in the premium segment. Regulatory frameworks and certification requirements are further supporting the transition toward technologically advanced and safety-focused toy solutions.
Key companies operating in the Infants and Toddlers Toy Market include VTech Holdings Ltd., The LEGO Group, Mattel, Inc., Hasbro, Inc., Spin Master Corp., Chicco (Artsana Group), Ravensburger AG, Melissa & Doug, Hape International, Clementoni S.p.A., Playmobil (geobra Brandstatter), Tomy International, JAKKS Pacific, Inc., Janod (Juratoys Group), and Little Tikes (MGA Entertainment). Companies in the Infants and Toddlers Toy Market are strengthening their market position by focusing on innovation, safety, and digital integration. They are investing in smart technologies to develop interactive and connected toys that align with modern parenting expectations. Product differentiation is being achieved through enhanced design, improved functionality, and compliance with strict safety standards. Many companies are expanding their digital presence and leveraging e-commerce platforms to reach a wider audience. Strategic collaborations and brand partnerships are also being used to enhance product portfolios and market visibility. Additionally, firms are prioritizing sustainability and high-quality materials to meet evolving consumer preferences while maintaining long-term brand loyalty.
Table of Contents
Chapter 1 Methodology and Scope
- 1.1 Market scope and definition
- 1.2 Research design
- 1.2.1 Research approach
- 1.2.2 Data collection methods
- 1.3 Data mining sources
- 1.3.1 Global
- 1.3.2 Regional/Country
- 1.4 Base estimates and calculations
- 1.4.1 Base year calculation
- 1.4.2 Key trends for market estimation
- 1.5 Primary research and validation
- 1.5.1 Primary sources
- 1.6 Forecast model
- 1.7 Research assumptions and limitations
Chapter 2 Executive Summary
- 2.1 Industry 360° synopsis
- 2.2 Key market trends
- 2.2.1 Regional
- 2.2.2 Product Type
- 2.2.3 Material Type
- 2.2.4 Age Group
- 2.2.5 Price
- 2.2.6 Distribution channel
- 2.3 CXO perspectives: Strategic imperatives
- 2.3.1 Key decision points for industry executives
- 2.3.2 Critical success factors for market players
- 2.4 Future outlook and strategic recommendations
Chapter 3 Industry Insights
- 3.1 Industry ecosystem analysis
- 3.1.1 Supplier landscape
- 3.1.2 Profit margin
- 3.1.3 Value addition at each stage
- 3.1.4 Factor affecting the value chain
- 3.2 Industry impact forces
- 3.2.1 Growth drivers
- 3.2.1.1 Rising demand for eco-friendly & sustainable toys
- 3.2.1.2 Technological advancements in "Smart" play
- 3.2.1.3 Growing urbanization & focus on early education
- 3.2.2 Industry pitfalls & challenges
- 3.2.2.1 High initial cost of premium educational models
- 3.2.2.2 Rapid technological obsolescence
- 3.2.3 Opportunities
- 3.2.3.1 Expansion of online sales channels
- 3.2.3.2 Integration of smart features (Bluetooth, sensors)
- 3.2.1 Growth drivers
- 3.3 Growth potential analysis
- 3.4 Future market trends
- 3.5 Technology and innovation landscape
- 3.5.1 Current technological trends
- 3.5.2 Emerging technologies
- 3.6 Price trends
- 3.6.1 Historical Price Trend Analysis (Driven by Primary Research) (2019-2024)
- 3.6.2 Pricing Strategy by Player Type (Premium/Value/Budget) (Driven by Primary Research)
- 3.6.3 Regional Price Variation & Purchasing Power Parity (Driven by Primary Research)
- 3.6.4 Impact of Material Costs on Retail Pricing (Driven by Primary Research)
- 3.7 Regulatory landscape
- 3.7.1 Standards and compliance requirements
- 3.7.2 Regional regulatory frameworks
- 3.7.3 Certification standards
- 3.8 Patent Landscape (Driven by Primary Research)
- 3.8.1 Patent Filing Trends by Technology Category (Driven by Primary Research)
- 3.8.2 Leading Patent Holders & Innovation Leaders (Driven by Primary Research)
- 3.8.3 Geographic Distribution of Patent Activity (Driven by Primary Research)
- 3.8.4 Emerging Patent Clusters (Smart Toys, Eco-Materials) (Driven by Primary Research)
- 3.9 Porter's analysis
- 3.10 PESTEL analysis
- 3.11 Trade Data Analysis (Driven by Primary Research)
- 3.11.1 Import/Export Volume & Value Trends by HS Code (Driven by Primary Research)
- 3.11.2 Key Trade Corridors & Tariff Impact (Driven by Primary Research)
- 3.11.3 Major Exporting Countries (China, Vietnam, Thailand) (Driven by Primary Research)
- 3.11.4 Major Importing Countries (US, UK, Germany, Australia) (Driven by Primary Research)
- 3.12 Impact of AI & Generative AI on the Market
- 3.12.1 AI-Driven Disruption of Traditional Toy Design & Development
- 3.12.2 GenAI Use Cases (Personalized Toys, Voice-Interactive Learning, Adaptive Play)
- 3.12.3 Adoption Roadmap by Product Segment (Educational vs. Entertainment Toys)
- 3.12.4 Risks, Limitations & Regulatory Considerations (Data Privacy, Screen Time Concerns)
- 3.13 Distribution Infrastructure & Channel Penetration Landscape (Driven by Primary Research)
- 3.13.1 Channel Coverage by Region & Format (Modern Trade vs. Traditional Retail) (Driven by Primary Research)
- 3.13.2 Last-Mile Infrastructure Gaps & Emerging Channel Shifts (D2C, Social Commerce) (Driven by Primary Research)
Chapter 4 Competitive Landscape, 2025
- 4.1 Introduction
- 4.2 Company market share analysis
- 4.2.1 By region
- 4.2.1.1 North America
- 4.2.1.2 Europe
- 4.2.1.3 Asia Pacific
- 4.2.1.4 Latin America
- 4.2.1.5 Middle East and Africa
- 4.2.1 By region
- 4.3 Company matrix analysis
- 4.4 Competitive analysis of major market players
- 4.5 Competitive positioning matrix
- 4.6 Key developments
- 4.6.1 Mergers & acquisitions
- 4.6.2 Partnerships & collaborations
- 4.6.3 New product launches
- 4.6.4 Expansion plans
Chapter 5 Market Estimates & Forecast, By Product Type, 2022 - 2035, (USD Billion) (Thousand Units)
- 5.1 Key trends
- 5.2 Educational toys
- 5.3 Soft toys
- 5.4 Activity and developmental toys
- 5.5 Ride-on toys
- 5.6 Building sets
- 5.7 Bath toys
- 5.8 Others (Teething toys, Pull-along toys)
Chapter 6 Market Estimates & Forecast, By Material Type, 2022 - 2035, (USD Billion) (Thousand Units)
- 6.1 Key trends
- 6.2 Plastic
- 6.3 Wooden
- 6.4 Fabric/Cloth
- 6.5 Silicone/Rubber
- 6.6 Eco-friendly materials (e.g., bamboo, recycled materials)
Chapter 7 Market Estimates & Forecast, By Age Group, 2022 - 2035, (USD Billion) (Thousand Units)
- 7.1 Key trends
- 7.2 0-6 Months
- 7.3 6-12 Months
- 7.4 1-2 Years
- 7.5 2-4 Years
Chapter 8 Market Estimates & Forecast, By Price, 2022 - 2035, (USD Billion) (Thousand Units)
- 8.1 Key trends
- 8.2 Low
- 8.3 Medium
- 8.4 High
Chapter 9 Market Estimates & Forecast, By Distribution Channel, 2022 - 2035, (USD Billion) (Thousand Units)
- 9.1 Key trends
- 9.2 Online
- 9.2.1 E-commerce platforms
- 9.2.2 Brand websites
- 9.3 Offline
- 9.3.1 Supermarkets/Hypermarkets
- 9.3.2 Specialty toy stores
- 9.3.3 Department stores
Chapter 10 Market Estimates and Forecast, By Region, 2022 - 2035 (USD Billion) (Thousand Units)
- 10.1 Key trends
- 10.2 North America
- 10.2.1 U.S.
- 10.2.2 Canada
- 10.3 Europe
- 10.3.1 Germany
- 10.3.2 UK
- 10.3.3 France
- 10.3.4 Italy
- 10.3.5 Spain
- 10.4 Asia Pacific
- 10.4.1 China
- 10.4.2 Japan
- 10.4.3 India
- 10.4.4 Australia
- 10.4.5 South Korea
- 10.5 Latin America
- 10.5.1 Brazil
- 10.5.2 Mexico
- 10.5.3 Argentina
- 10.6 Middle East and Africa
- 10.6.1 South Africa
- 10.6.2 Saudi Arabia
- 10.6.3 UAE
Chapter 11 Company Profiles
- 11.1 Chicco (Artsana Group)
- 11.2 Clementoni S.p.A.
- 11.3 Hape International
- 11.4 Hasbro, Inc.
- 11.5 JAKKS Pacific, Inc.
- 11.6 Janod (Juratoys Group)
- 11.7 Little Tikes (MGA Entertainment)
- 11.8 Mattel, Inc.
- 11.9 Melissa & Doug
- 11.10 Playmobil (geobra Brandstatter)
- 11.11 Ravensburger AG
- 11.12 Spin Master Corp.
- 11.13 The LEGO Group
- 11.14 Tomy International
- 11.15 VTech Holdings Ltd.
 2026-2030年全球科學、技術、工程和數學(STEM)玩具市場
 STEM玩具市場報告:趨勢、預測與競爭分析(至2035年)
 教育玩具市場:商機、成長要素、產業趨勢分析及2026-2035年預測教育玩具市場報告:趨勢、預測與競爭分析(至2035年)
 教育玩具市場:2026-2032年全球市場預測(依產品類型、年齡層、價格範圍及銷售管道)
 全球STEM玩具市場規模、佔有率、趨勢和成長分析報告(2026-2034年)
 教育玩具市場分析及預測(至2035年):依類型、產品、技術、組件、應用、材料類型、最終用戶及功能分類全球教育玩具市場規模、佔有率、趨勢和成長分析報告(2026-2034)全球教育玩具市場:規模、佔有率、成長率、按類型和應用分類的全球產業分析、區域趨勢以及2026-2034年預測
 全球兒童認知發展技術市場:預測(至2034年)-依經營模式、年齡層、通路、技術、應用和地區進行分析