


 |
市場調查報告書
商品編碼
2027576
壓力控制設備市場商機、成長要素、產業趨勢分析及2026-2035年預測。Pressure Control Equipment Market Opportunity, Growth Drivers, Industry Trend Analysis, and Forecast 2026 - 2035 |
||||||
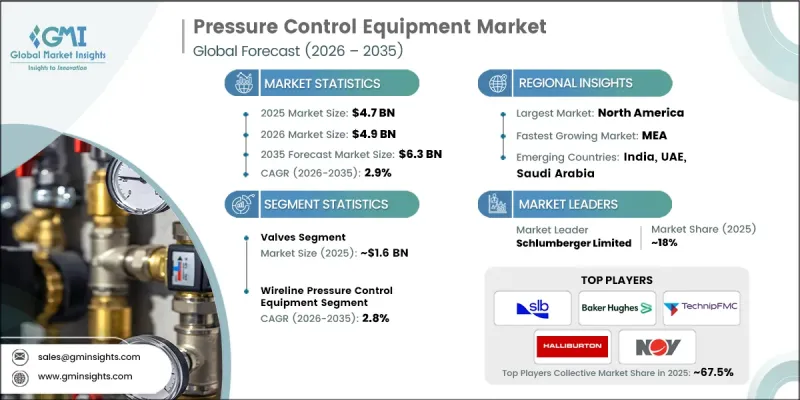
2025年全球壓力控制設備市場價值為47億美元,預計2035年將達到63億美元,年複合成長率為2.9%。
市場成長主要受石油和天然氣探勘與生產活動加速發展的推動,而維護油井健康和營運安全至關重要。壓力控制系統在管理高壓環境、確保高效鑽井和開採過程中發揮關鍵作用。隨著探勘擴展到更複雜和嚴苛的環境,對先進可靠設備的需求持續成長。除了能源產業,化工、發電和製造業的持續工業化也推動了穩定的需求。這些產業需要精確的壓力調節來維持製程效率、穩定產品品質並符合安全標準。對營運可靠性的日益重視,以及不斷成長的全球能源需求,正在推動對先進壓力控制技術的投資,這些技術不僅支持上游產業的活動,也適用於廣泛的工業應用。
| 市場範圍 | |
|---|---|
| 開始年份 | 2025 |
| 預測期 | 2026-2035 |
| 上市時的市場規模 | 47億美元 |
| 預計金額 | 63億美元 |
| 複合年成長率 | 2.9% |
預計到2025年,閥門市場規模將達到16億美元,並在2035年之前以2.7%的複合年成長率成長。閥門市場之所以能保持主導地位,是因為其在各種應用中發揮調節流動流量和維持穩定壓力水平的關鍵作用。閥門被廣泛用於確保系統安全、防止運作以及在高壓環境下實現高效運作。閥門的耐用性、適應性和長運作使其成為新安裝和維護活動中不可或缺的組件。日益嚴格的監管要求以及對可靠壓力管理解決方案不斷成長的需求,持續推動閥門系統的強勁需求。
預計到2025年,纜線壓力控制設備市佔率將達到64.4%,並在預測期內以2.8%的複合年成長率成長。該細分市場的主導地位源於其在井口干預和維護作業中的專業作用,在這些作業中,精確的壓力控制至關重要。這些系統旨在高壓條件下運作,同時確保安全地進入地下環境。其高效性、可靠性和柔軟性使其成為複雜井口作業營運商的首選,從而鞏固了其市場領先地位。
美國壓力控制設備市場規模達14億美元,預計2026年至2035年將以2.7%的複合年成長率成長。該國市場成長的主要驅動力是廣泛的探勘和生產活動,以及對先進鑽井技術的持續投資。嚴格的監管標準和對營運效率的需求進一步推動了對可靠、高性能壓力控制系統的需求。包括自動化和遠端操作設備在內的技術進步正在提高安全性並減少停機時間。完善的基礎設施、技術嫻熟的勞動力以及對能源開發的持續投資進一步增強了該地區的市場前景。
目錄
第1章:調查方法和範圍
第2章執行摘要
第3章業界考察
- 生態系分析
- 供應商情況
- 利潤率
- 每個階段增加的價值
- 影響價值鏈的因素
- 影響產業的因素
- 促進因素
- 擴大石油和天然氣探勘和生產活動
- 化工、電力和製造業的工業化。
- 高壓作業需遵守嚴格的安全和監管標準。
- 陷阱與挑戰
- 先進壓力控制設備的初始成本較高
- 複雜的安裝和維護要求
- 機會
- 擴大數位化和物聯網壓力監測系統的應用。
- 可再生能源和替代燃料產業的成長
- 促進因素
- 成長潛力分析
- 未來市場趨勢
- 科技與創新趨勢
- 當前技術趨勢
- 新興技術
- 監理情勢
- 標準和合規要求
- 區域法規結構
- 認證標準
- 波特五力分析
- PESTEL 分析
- 價格分析(基於初步調查)
- 對過去價格趨勢的分析(基於初步研究)
- 根據業務類型分類的定價策略(高階/價值/成本加成)(基於初步調查)
- 原物料成本對設備價格的影響
- 貿易數據分析(基於付費資料庫)
- 進出口量和進口額趨勢(基於付費資料庫)
- 主要貿易走廊及關稅影響(基於付費資料庫)
- 區域貿易流量趨勢與出口競爭力
- 人工智慧和生成式人工智慧對市場的影響
- 人工智慧正在改變傳統的控制系統和操作方式。
- 按行業分類的生成式人工智慧應用案例和實施藍圖
- 風險、限制和監管考量
- 目前製造能力和生產基礎設施狀況(基於初步調查)
- 按地區和主要生產商分類的製造能力(基於初步調查)
- 運轉率和擴張計劃(基於初步調查)
第4章 競爭情勢
- 介紹
- 企業市佔率分析
- 按地區
- 企業矩陣分析
- 主要市場公司的競爭分析
- 競爭定位矩陣
- 主要進展
- 併購
- 夥伴關係與合作
- 新產品發布
- 業務拓展計劃
第5章 市場估計與預測:依組件分類,2022-2035年
- 閥門
- 控制頭
- 井口法蘭
- 適配器法蘭
- 快速聯盟
- 軟管
- 其他
第6章 市場估計與預測:依類別分類,2022-2035年
- 纜線壓力控制設備
- 撓曲油管壓力控制設備
第7章 市場估計與預測:依價格區間分類,2022-2035年
- 低價位
- 中價位
- 高的
第8章 市場估計與預測:依應用領域分類,2022-2035年
- 離岸
- 陸上
第9章 市場估計與預測:依最終用途分類,2022-2035年
- 石油和天然氣
- 化學
- 能源與公共產業
- 製造業
- 礦業
- 紙漿和造紙
- 其他
第10章 市場估價與預測:依通路分類,2022-2035年
- 直接地
- 間接
第11章 市場估價與預測:按地區分類,2022-2035年
- 北美洲
- 美國
- 加拿大
- 歐洲
- 德國
- 英國
- 法國
- 義大利
- 西班牙
- 亞太地區
- 中國
- 印度
- 日本
- 韓國
- 澳洲
- 拉丁美洲
- 巴西
- 墨西哥
- 阿根廷
- 中東和非洲(MEA)
- 沙烏地阿拉伯
- 阿拉伯聯合大公國
- 南非
第12章:公司簡介
- Aker Solutions ASA
- Baker Hughes Company
- Cactus Inc.
- Curtiss-Wright Corporation
- Dril-Quip, Inc.
- Forum Energy Technologies
- Halliburton Company
- Hunting PLC
- National Oilwell Varco
- Oil States International
- Schlumberger Limited
- Schneider Electric SE
- TechnipFMC plc
- The Weir Group PLC
- Weatherford International
The Global Pressure Control Equipment Market was valued at USD 4.7 billion in 2025 and is estimated to grow at a CAGR of 2.9% to reach USD 6.3 billion by 2035.
Market growth is driven by the increasing pace of oil and gas exploration and production activities, where maintaining well integrity and operational safety is critical. Pressure control systems play a vital role in managing high-pressure environments and ensuring efficient drilling and extraction processes. As exploration expands into more complex and demanding environments, the need for advanced and reliable equipment continues to rise. In addition to the energy sector, ongoing industrialization across chemical processing, power generation, and manufacturing industries is contributing to steady demand. These sectors require precise pressure regulation to maintain process efficiency, ensure product consistency, and meet safety standards. The growing emphasis on operational reliability, combined with rising global energy demand, is encouraging investments in advanced pressure control technologies that support both upstream activities and broader industrial applications.
| Market Scope | |
|---|---|
| Start Year | 2025 |
| Forecast Year | 2026-2035 |
| Start Value | $4.7 Billion |
| Forecast Value | $6.3 Billion |
| CAGR | 2.9% |
The valves segment generated USD 1.6 billion in 2025 and is expected to grow at a CAGR of 2.7% through 2035. This segment maintains a leading position due to its critical function in regulating fluid flow and maintaining stable pressure levels across various applications. Valves are widely used for ensuring system safety, preventing operational disruptions, and supporting efficient performance in high-pressure environments. Their durability, adaptability, and long operational lifespan make them essential components in both new installations and maintenance activities. Increasing regulatory requirements and the need for dependable pressure management solutions continue to support strong demand for valve systems.
The wireline pressure control equipment segment accounted for 64.4% share in 2025 and is projected to grow at a CAGR of 2.8% over the forecast period. This segment dominates due to its specialized role in well intervention and maintenance operations, where precise pressure management is essential. These systems are designed to operate in high-pressure conditions while enabling safe access to subsurface environments. Their efficiency, reliability, and flexibility make them a preferred choice for operators managing complex well operations, contributing to sustained market leadership.
United States Pressure Control Equipment Market accounted for USD 1.4 billion and is expected to grow at a CAGR of 2.7% from 2026 to 2035. Market growth in the country is supported by extensive exploration and production activities, along with continued investment in advanced drilling technologies. The demand for reliable and high-performance pressure control systems is reinforced by strict regulatory standards and the need for operational efficiency. Technological advancements, including automated and remotely operated equipment, are improving safety and reducing downtime. Strong infrastructure, a skilled workforce, and ongoing investments in energy development further strengthen the market outlook in the region.
Key players operating in the Global Pressure Control Equipment Market include Schlumberger Limited, Baker Hughes Company, Halliburton Company, TechnipFMC plc, Aker Solutions ASA, National Oilwell Varco, Weatherford International, The Weir Group PLC, Curtiss-Wright Corporation, Oil States International, Forum Energy Technologies, Dril-Quip, Inc., Hunting PLC, Schneider Electric SE, and Cactus Inc. Companies in the pressure control equipment market are focusing on technological innovation and product enhancement to strengthen their competitive position. Investments in research and development are enabling the creation of advanced systems with improved safety, automation, and operational efficiency. Firms are expanding their global presence through strategic partnerships, collaborations, and acquisitions to access new markets and strengthen distribution networks. Emphasis on compliance with stringent regulatory standards and the development of high-performance equipment ensures reliability and customer trust. Additionally, companies are enhancing after-sales services and maintenance support while integrating digital monitoring and predictive maintenance technologies to improve equipment performance and long-term value.
Table of Contents
Chapter 1 Methodology & Scope
- 1.1 Market scope and definition
- 1.2 Research design
- 1.2.1 Research approach
- 1.2.2 Data collection methods
- 1.3 Data mining sources
- 1.3.1 Global
- 1.3.2 Regional/Country
- 1.4 Base estimates and calculations
- 1.4.1 Base year calculation
- 1.4.2 Key trends for market estimation
- 1.5 Primary research and validation
- 1.5.1 Primary sources
- 1.6 Forecast model
- 1.7 Research assumptions and limitations
Chapter 2 Executive Summary
- 2.1 Industry 360° synopsis
- 2.2 Key market trends
- 2.2.1 Regional
- 2.2.2 Component
- 2.2.3 Category
- 2.2.4 Price Range
- 2.2.5 Application
- 2.2.6 End Use
- 2.2.7 Distribution channel
Chapter 3 Industry Insights
- 3.1 Industry ecosystem analysis
- 3.1.1 Supplier landscape
- 3.1.2 Profit margin
- 3.1.3 Value addition at each stage
- 3.1.4 Factor affecting the value chain
- 3.2 Industry impact forces
- 3.2.1 Growth drivers
- 3.2.1.1 Expansion of oil and gas exploration and production activities
- 3.2.1.2 Growing industrialization across chemical, power, and manufacturing sectors
- 3.2.1.3 Stringent safety and regulatory standards in high-pressure operations
- 3.2.2 Pitfalls & Challenges
- 3.2.2.1 High initial cost of advanced pressure control equipment
- 3.2.2.2 Complex installation and maintenance requirements
- 3.2.3 Opportunities
- 3.2.3.1 Increasing adoption of digital and IoT-enabled pressure monitoring systems
- 3.2.3.2 Growth of renewable energy and alternative fuel industries
- 3.2.1 Growth drivers
- 3.3 Growth potential analysis
- 3.4 Future market trends
- 3.5 Technology and innovation landscape
- 3.5.1 Current technological trends
- 3.5.2 Emerging technologies
- 3.6 Regulatory landscape
- 3.6.1 Standards and compliance requirements
- 3.6.2 Regional regulatory frameworks
- 3.6.3 Certification standards
- 3.7 Porter's analysis
- 3.8 PESTEL analysis
- 3.9 Pricing Analysis (Driven by Primary Research)
- 3.9.1 Historical Price Trend Analysis (Driven by Primary Research)
- 3.9.2 Pricing Strategy by Player Type (Premium / Value / Cost-plus) (Driven by Primary Research)
- 3.9.3 Impact of Raw Material Costs on Equipment Pricing
- 3.10 Trade Data Analysis (Driven by paid data base)
- 3.10.1 Import/Export Volume & Value Trends (Driven by paid data base)
- 3.10.2 Key Trade Corridors & Tariff Impact (Driven by paid data base)
- 3.10.3 Regional Trade Flow Patterns & Export Competitiveness
- 3.11 Impact of AI & Generative AI on the Market
- 3.11.1 AI-Driven Disruption of Traditional Control Systems & Operations
- 3.11.2 GenAI Use Cases & Adoption Roadmap by Industry Segment
- 3.11.3 Risks, Limitations & Regulatory Considerations
- 3.12 Manufacturing Capacity & Production Infrastructure Landscape (Driven by Primary Research)
- 3.13 Installed Manufacturing Capacity by Region & Key Producer (Driven by Primary Research)
- 3.14 Capacity Utilization Rates & Expansion Pipelines (Driven by Primary Research)
Chapter 4 Competitive Landscape, 2025
- 4.1 Introduction
- 4.2 Company market share analysis
- 4.2.1 By Region
- 4.2.1.1 North America
- 4.2.1.2 Europe
- 4.2.1.3 Asia Pacific
- 4.2.1.4 Latin America
- 4.2.1.5 Middle East & Africa
- 4.2.1 By Region
- 4.3 Company matrix analysis
- 4.4 Competitive analysis of major market players
- 4.5 Competitive positioning matrix
- 4.6 Key developments
- 4.6.1 Mergers & acquisitions
- 4.6.2 Partnerships & collaborations
- 4.6.3 New product launches
- 4.6.4 Expansion plans
Chapter 5 Market Estimates & Forecast, By Component, 2022 - 2035, (USD Billion) (Thousand Units)
- 5.1 Key trends
- 5.2 Valves
- 5.3 Control Head
- 5.4 Wellhead Flange
- 5.5 Adapter Flange
- 5.6 Quick Unions
- 5.7 Flexible Hoses
- 5.8 Others
Chapter 6 Market Estimates & Forecast, By Category, 2022 - 2035, (USD Billion) (Thousand Units)
- 6.1 Key trends
- 6.2 Wireline Pressure Control Equipment
- 6.3 Coiled Tubing Pressure Control Equipment
Chapter 7 Market Estimates & Forecast, By Price Range, 2022 - 2035, (USD Billion) (Thousand Units)
- 7.1 Key trends
- 7.2 Low
- 7.3 Medium
- 7.4 High
Chapter 8 Market Estimates & Forecast, By Application, 2022 - 2035, (USD Billion) (Thousand Units)
- 8.1 Key trends
- 8.2 Offshore
- 8.3 Onshore
Chapter 9 Market Estimates & Forecast, By End-Use, 2022 - 2035, (USD Billion) (Thousand Units)
- 9.1 Key trends
- 9.2 Oil & Gas
- 9.3 Chemicals
- 9.4 Energy & Utilities
- 9.5 Manufacturing
- 9.6 Mining
- 9.7 Pulp & Paper
- 9.8 Others
Chapter 10 Market Estimates & Forecast, By Distribution Channel, 2022 - 2035, (USD Billion) (Thousand Units)
- 10.1 Key trends
- 10.2 Direct
- 10.3 Indirect
Chapter 11 Market Estimates & Forecast, By Region, 2022 - 2035, (USD Billion) (Thousand Units)
- 11.1 Key trends
- 11.2 North America
- 11.2.1 U.S.
- 11.2.2 Canada
- 11.3 Europe
- 11.3.1 Germany
- 11.3.2 UK
- 11.3.3 France
- 11.3.4 Italy
- 11.3.5 Spain
- 11.4 Asia Pacific
- 11.4.1 China
- 11.4.2 India
- 11.4.3 Japan
- 11.4.4 South Korea
- 11.4.5 Australia
- 11.5 Latin America
- 11.5.1 Brazil
- 11.5.2 Mexico
- 11.5.3 Argentina
- 11.6 MEA
- 11.6.1 Saudi Arabia
- 11.6.2 UAE
- 11.6.3 South Africa
Chapter 12 Company Profiles
- 12.1 Aker Solutions ASA
- 12.2 Baker Hughes Company
- 12.3 Cactus Inc.
- 12.4 Curtiss-Wright Corporation
- 12.5 Dril-Quip, Inc.
- 12.6 Forum Energy Technologies
- 12.7 Halliburton Company
- 12.8 Hunting PLC
- 12.9 National Oilwell Varco
- 12.10 Oil States International
- 12.11 Schlumberger Limited
- 12.12 Schneider Electric SE
- 12.13 TechnipFMC plc
- 12.14 The Weir Group PLC
- 12.15 Weatherford International


