


 |
市場調查報告書
商品編碼
2019214
2026 年至 2035 年釀造添加劑的市場機會、成長要素、產業趨勢分析與預測。Brewing Additives Market Opportunity, Growth Drivers, Industry Trend Analysis, and Forecast 2026 - 2035 |
||||||
2025年全球釀造添加劑市場價值44億美元,預計2035年將以5.9%的複合年成長率成長至78億美元。
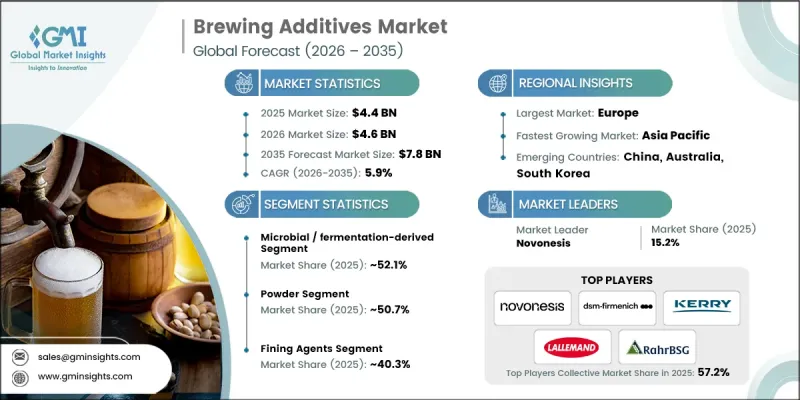
消費者對高品質啤酒和葡萄酒的需求日益成長,這些產品口感更佳、澄清度更高、保存期限更長,從而推動了這個市場的發展。精釀和高階酒精飲料的日益普及促使生產商最佳化生產效率並採用創新添加劑來提高產品品質穩定性。消費者強烈偏好天然、永續和潔淨標示的原料,這推動了環保釀造解決方案的發展。澄清劑、穩定劑、消泡劑和固色劑釀造添加劑對於改善飲料的澄清度、風味和穩定性至關重要。商業啤酒廠和家庭釀酒師都依賴這些原料來釀造始終如一的高品質飲品。釀造技術的進步以及低酒精和無酒精飲料需求的成長進一步促進了這一成長,從而形成了一個以產品創新為中心的競爭環境。
| 市場範圍 | |
|---|---|
| 開始年份 | 2025 |
| 預測期 | 2026-2035 |
| 初始市場規模 | 44億美元 |
| 預測金額 | 78億美元 |
| 複合年成長率 | 5.9% |
到2025年,微生物和發酵衍生的配料將佔據52.1%的市場。這些天然、永續且用途廣泛的添加劑備受青睞,因為它們能夠加速發酵、增強風味,並滿足消費者對潔淨標示產品的需求。隨著釀酒商不斷追求卓越的發酵性能和風味穩定性,這一領域正推動著產品的持續創新。
預計到 2025 年,澄清劑市佔率將達到 40.3%,到 2035 年將以 6.1% 的複合年成長率成長。這些添加劑對於去除不需要的顆粒、蛋白質和多酚,保持飲料的澄清度和穩定性,以及生產外觀吸引人、高品質的最終產品至關重要。
預計2026年至2035年,北美釀造添加劑市場將以5.6%的複合年成長率成長。在精釀啤酒和高級啤酒日益成長的推動下,釀酒商正在採用創新添加劑來增強風味、延長保存期限並提高產品穩定性。該地區正經歷活躍的產品研發,製造商致力於提供獨特的味覺體驗和現代化的釀造解決方案。
目錄
第1章:調查方法和範圍
第2章執行摘要
第3章業界考察
- 生態系分析
- 供應商情況
- 利潤率
- 每個階段增加的價值
- 影響價值鏈的因素
- 中斷
- 影響產業的因素
- 促進因素
- 高階和精釀飲品的需求不斷成長
- 釀造製程的技術進步
- 家庭釀造和精釀啤酒廠的發展
- 產業潛在風險與挑戰
- 原料供應波動
- 市場機遇
- 消費者對天然和有機成分的偏好日益成長
- 擴大具有功能性和健康促進作用的釀造添加劑的種類
- 促進因素
- 成長潛力分析
- 監理情勢
- 北美洲
- 歐洲
- 亞太地區
- 拉丁美洲
- 中東和非洲
- 波特五力分析
- PESTEL 分析
- 價格趨勢
- 按地區
- 按類型
- 未來市場趨勢
- 科技與創新趨勢
- 當前技術趨勢
- 新興技術
- 專利趨勢
- 貿易統計(HS編碼)
- 主要進口國
- 主要出口國
- 永續性和環境方面
- 永續計劃
- 減少廢棄物策略
- 生產中的能源效率
- 環保意識的舉措
- 考慮碳足跡
第4章 競爭情勢
- 介紹
- 企業市佔率分析
- 按地區
- 北美洲
- 歐洲
- 亞太地區
- 拉丁美洲
- 中東和非洲
- 按地區
- 主要市場公司的競爭分析
- 競爭定位矩陣
- 主要進展
- 併購
- 夥伴關係與合作
- 新產品發布
- 業務拓展計劃
第5章 市場估計與預測:依來源分類,2022-2035年
- 微生物來源/發酵來源
- 植物來源
- 動物源性
- 合成/化學
第6章 市場估計與預測:依類型分類,2022-2035年
- 液體
- 粉末
- 藥片
- 凝膠
第7章 市場估計與預測:依類型分類,2022-2035年
- 澄清劑
- 消泡劑
- 穩定器
- 固色劑
- 其他
第8章 市場估計與預測:依應用領域分類,2022-2035年
- 葡萄酒
- 啤酒
- 其他
第9章 市場估計與預測:依地區分類,2022-2035年
- 北美洲
- 美國
- 加拿大
- 歐洲
- 德國
- 英國
- 法國
- 西班牙
- 義大利
- 其他歐洲地區
- 亞太地區
- 中國
- 印度
- 日本
- 澳洲
- 韓國
- 亞太其他地區
- 拉丁美洲
- 巴西
- 墨西哥
- 阿根廷
- 其他拉丁美洲地區
- 中東和非洲
- 沙烏地阿拉伯
- 南非
- 阿拉伯聯合大公國
- 其他中東和非洲地區
第10章:公司簡介
- AEB Brewing
- Agrovin
- ATPGroup
- DSM-Firmenich
- Enartis Srl
- General Filtration
- Kerry Group
- Lallemand Brewing
- Novonesis
- RahrBSG
- White Labs
The Global Brewing Additives Market was valued at USD 4.4 billion in 2025 and is estimated to grow at a CAGR of 5.9% to reach USD 7.8 billion by 2035.
The market is benefiting from growing consumer demand for high-quality beers and wines that offer superior taste, improved visual clarity, and longer shelf life. The increasing popularity of craft beverages and premium alcoholic drinks is prompting manufacturers to adopt innovative additives that optimize production efficiency and enhance product consistency. Consumers are showing a strong preference for natural, sustainable, and clean-label ingredients, driving the development of eco-friendly brewing solutions. Brewing additives, including fining agents, stabilizers, antifoaming agents, and color enhancers, are critical for improving beverage clarity, flavor, and stability. Both commercial breweries and home brewers rely on these ingredients to deliver consistent, high-quality beverages. The growth is further supported by advancements in brewing technologies and the rising demand for low-alcohol and non-alcoholic options, creating a competitive environment focused on product innovation.
| Market Scope | |
|---|---|
| Start Year | 2025 |
| Forecast Year | 2026-2035 |
| Start Value | $4.4 Billion |
| Forecast Value | $7.8 Billion |
| CAGR | 5.9% |
The microbial and fermentation-derived ingredients segment held a 52.1% share in 2025. These natural, sustainable, and versatile additives are preferred for their ability to enhance fermentation, improve taste, and meet consumer demand for clean-label products. The segment drives ongoing product innovation as brewers seek superior fermentation performance and flavor consistency.
The fining agents segment accounted for 40.3% share in 2025 and is expected to grow at a CAGR of 6.1% through 2035. These additives are essential for maintaining beverage clarity and stability by removing unwanted particles, proteins, and polyphenols, producing visually appealing and high-quality final products.
North America Brewing Additives Market is projected to grow at a CAGR of 5.6% from 2026 to 2035. Rising interest in craft and premium beers is encouraging brewers to adopt innovative additives that enhance flavor, extend shelf life, and improve product stability. The region is seeing active product development as manufacturers focus on delivering unique taste experiences and modern brewing solutions.
Key players in the Global Brewing Additives Market include White Labs, DSM-Firmenich, Novonesis, Lallemand Brewing, RahrBSG, General Filtration, AEB Brewing, Agrovin, Enartis S.r.l., Kerry Group, and ATPGroup. Companies in the brewing additives market are strengthening their presence by investing in research and development to create natural, sustainable, and versatile additives that align with consumer demand for clean-label beverages. Strategic partnerships with breweries and beverage producers help expand market reach, while innovation in flavor, clarity, and stability solutions improves product differentiation. Manufacturers are also focusing on eco-friendly production methods, improving quality control, and offering technical support to enhance customer satisfaction, maintain brand loyalty, and establish a strong foothold in competitive global markets.
Table of Contents
Chapter 1 Methodology & Scope
- 1.1 Market scope and definition
- 1.2 Research design
- 1.2.1 Research approach
- 1.2.2 Data collection methods
- 1.3 Data mining sources
- 1.3.1 Global
- 1.3.2 Regional/Country
- 1.4 Base estimates and calculations
- 1.4.1 Base year calculation
- 1.4.2 Key trends for market estimation
- 1.5 Primary research and validation
- 1.5.1 Primary sources
- 1.6 Forecast model
- 1.7 Research assumptions and limitations
Chapter 2 Executive Summary
- 2.1 Industry 360° synopsis
- 2.2 Key market trends
- 2.2.1 Regional
- 2.2.2 Source
- 2.2.3 Form
- 2.2.4 Type
- 2.2.5 Application
- 2.3 TAM Analysis, 2026-2035
- 2.4 CXO perspectives: Strategic imperatives
Chapter 3 Industry Insights
- 3.1 Industry ecosystem analysis
- 3.1.1 Supplier landscape
- 3.1.2 Profit margin
- 3.1.3 Value addition at each stage
- 3.1.4 Factor affecting the value chain
- 3.1.5 Disruptions
- 3.2 Industry impact forces
- 3.2.1 Growth drivers
- 3.2.1.1 Increasing demand for premium and craft beverages
- 3.2.1.2 Technological advancements in brewing processes
- 3.2.1.3 Growth in home brewing and microbreweries
- 3.2.2 Industry pitfalls and challenges
- 3.2.2.1 Fluctuations in raw material availability
- 3.2.3 Market opportunities
- 3.2.3.1 Increasing consumer preference for natural and organic ingredients
- 3.2.3.2 Expansion of functional and health-enhancing brewing additives
- 3.2.1 Growth drivers
- 3.3 Growth potential analysis
- 3.4 Regulatory landscape
- 3.4.1 North America
- 3.4.2 Europe
- 3.4.3 Asia Pacific
- 3.4.4 Latin America
- 3.4.5 Middle East & Africa
- 3.5 Porter's analysis
- 3.6 PESTEL analysis
- 3.7 Price trends
- 3.7.1 By region
- 3.7.2 By type
- 3.8 Future market trends
- 3.9 Technology and innovation landscape
- 3.9.1 Current technological trends
- 3.9.2 Emerging technologies
- 3.10 Patent Landscape
- 3.11 Trade statistics (HS code)
- 3.11.1 Major importing countries
- 3.11.2 Major exporting countries
- 3.12 Sustainability and environmental aspects
- 3.12.1 Sustainable practices
- 3.12.2 Waste reduction strategies
- 3.12.3 Energy efficiency in production
- 3.12.4 Eco-friendly initiatives
- 3.13 Carbon footprint consideration
Chapter 4 Competitive Landscape, 2025
- 4.1 Introduction
- 4.2 Company market share analysis
- 4.2.1 By region
- 4.2.1.1 North America
- 4.2.1.2 Europe
- 4.2.1.3 Asia Pacific
- 4.2.1.4 LATAM
- 4.2.1.5 MEA
- 4.2.1 By region
- 4.3 Competitive analysis of major market players
- 4.4 Competitive positioning matrix
- 4.5 Key developments
- 4.5.1 Mergers & acquisitions
- 4.5.2 Partnerships & collaborations
- 4.5.3 New Product Launches
- 4.5.4 Expansion Plans
Chapter 5 Market Estimates and Forecast, By Source, 2022-2035 (USD Billion) (Kilo Tons)
- 5.1 Key trends
- 5.2 Microbial / fermentation-derived
- 5.3 Plant-derived
- 5.4 Animal-derived
- 5.5 Synthetic / chemical
Chapter 6 Market Estimates and Forecast, By Form, 2022-2035 (USD Billion) (Kilo Tons)
- 6.1 Key trends
- 6.2 Liquid
- 6.3 Powder
- 6.4 Tablets
- 6.5 Gel
Chapter 7 Market Estimates and Forecast, By Type, 2022-2035 (USD Billion) (Kilo Tons)
- 7.1 Key trends
- 7.2 Fining agents
- 7.3 Antifoaming agents
- 7.4 Stabilizers
- 7.5 Color enhancers
- 7.6 Others
Chapter 8 Market Estimates and Forecast, By Application, 2022-2035 (USD Billion) (Kilo Tons)
- 8.1 Key trends
- 8.2 Wine
- 8.3 Beer
- 8.4 Others
Chapter 9 Market Estimates and Forecast, By Region, 2022-2035 (USD Billion) (Kilo Tons)
- 9.1 Key trends
- 9.2 North America
- 9.2.1 U.S.
- 9.2.2 Canada
- 9.3 Europe
- 9.3.1 Germany
- 9.3.2 UK
- 9.3.3 France
- 9.3.4 Spain
- 9.3.5 Italy
- 9.3.6 Rest of Europe
- 9.4 Asia Pacific
- 9.4.1 China
- 9.4.2 India
- 9.4.3 Japan
- 9.4.4 Australia
- 9.4.5 South Korea
- 9.4.6 Rest of Asia Pacific
- 9.5 Latin America
- 9.5.1 Brazil
- 9.5.2 Mexico
- 9.5.3 Argentina
- 9.5.4 Rest of Latin America
- 9.6 Middle East and Africa
- 9.6.1 Saudi Arabia
- 9.6.2 South Africa
- 9.6.3 UAE
- 9.6.4 Rest of Middle East and Africa
Chapter 10 Company Profiles
- 10.1 AEB Brewing
- 10.2 Agrovin
- 10.3 ATPGroup
- 10.4 DSM-Firmenich
- 10.5 Enartis S.r.l.
- 10.6 General Filtration
- 10.7 Kerry Group
- 10.8 Lallemand Brewing
- 10.9 Novonesis
- 10.10 RahrBSG
- 10.11 White Labs


