


 |
市場調查報告書
商品編碼
2019176
瓜爾膠複合物市場機會、成長要素、產業趨勢分析及2026-2035年預測Guar Complex Market Opportunity, Growth Drivers, Industry Trend Analysis, and Forecast 2026 - 2035 |
||||||
預計到 2025 年,全球瓜爾膠複合物市場價值將達到 13.1 億美元,年複合成長率為 3.3%,到 2035 年將達到 18.2 億美元。
瓜爾膠複合市場涵蓋了一條完整的價值鏈,從瓜爾豆的種植和供應開始,一直延伸到瓜爾膠、瓜爾豆片和瓜爾豆粉等衍生產品的加工。由於瓜爾豆需水量低且能耐受惡劣的氣候條件,因此主要種植在半乾旱地區,從而保證了原料的穩定供應。瓜爾膠複合產業因其作為天然增稠劑和粘合劑的功能,在多個行業中發揮著至關重要的作用。瓜爾膠衍生產品因其能夠調節配方黏度、提高穩定性並增強保水性而廣受認可。這些功能優勢使其在各種工業應用中廣泛應用。近年來,加工技術的進步顯著提高了產品品質和營運效率。製造商擴大採用最新的研磨、精煉和黏度控制技術,以滿足特定應用的需求。自動化和先進的品質監控系統也有助於減少廢棄物並提高品質一致性。人們對植物來源和可生物分解材料日益成長的興趣,進一步推動了瓜爾膠複合市場的需求成長。
| 市場範圍 | |
|---|---|
| 開始年份 | 2025 |
| 預測期 | 2026-2035 |
| 上市時的市場規模 | 13.1億美元 |
| 預測金額 | 18.2億美元 |
| 複合年成長率 | 3.3% |
預計到2025年,瓜爾膠市場規模將達到9.516億美元。瓜爾膠具有優異的增稠和穩定性能,應用廣泛,適用於許多工業領域的各種用途。市場趨勢日益關注產品性能的穩定性、特定應用的功能性以及潔淨標示的要求。此外,瓜爾膠的營養價值和成本效益使其在飼料相關應用領域持續保持強勁的需求。瓜爾豆的種植和加工與下游產品的可靠性密切相關,這些產品能夠確保各個終端使用者領域穩定的供應和應用效能。
預計到2025年,食品領域市場規模將達到4.659億美元。該領域的需求主要源於產品配方中對有效質地控制、穩定性和水分管理的需求。製造商越來越注重實現均勻一致的稠度和可靠的加工效果。黏度控制、結構穩定性和耐溫性等功能性要求是產品開發的重要考量。在加工和儲存過程中保持產品特性的一致性至關重要,這也持續推動著瓜爾膠衍生原料的應用。在確保穩定性和均勻性的同時提升配方性能的能力,仍然是推動食品相關應用採用瓜爾膠的關鍵因素。
預計北美瓜爾膠複合物市場規模將從2025年的2.494億美元成長至2035年的3.191億美元,並在整個預測期內保持穩定成長。這一區域成長主要得益於食品加工、工業和個人護理行業的持續需求。可靠的供應鏈、穩定的產品品質和技術支援是推動市場動態的因素。消費者對檢驗性能標準的植物來源材料的日益偏好也影響市場需求。在美國,買家優先考慮黏度穩定、符合既定品質標準並能保證及時交貨的產品。穩定的籌資策略和庫存管理有助於維持市場平衡,而對加工產品的持續需求則支撐著瓜爾膠複合物市場的整體成長。
目錄
第1章:調查方法和範圍
第2章執行摘要
第3章業界考察
- 生態系分析
- 供應商情況
- 利潤率
- 每個階段增加的價值
- 影響價值鏈的因素
- 中斷
- 影響產業的因素
- 促進因素
- 整個產業對天然增稠劑的需求日益成長
- 擴大油田應用以支持瓜爾豆消費成長
- 消費者對植物來源功能性成分的偏好日益成長。
- 陷阱與挑戰
- 由於季節性供應變化導致的價格波動頻繁發生。
- 儲存基礎設施不足正在影響原料的品質水準。
- 機會
- 它在加工食品中的應用正在全球範圍內穩步擴大。
- 產品客製化以滿足不同工業應用的需求。
- 促進因素
- 成長潛力分析
- 監理情勢
- 波特五力分析
- PESTEL 分析
- 科技與創新趨勢
- 當前技術趨勢
- 新興技術
- 價格趨勢
- 按地區
- 按類型
- 未來市場趨勢
- 科技與創新趨勢
- 當前技術趨勢
- 新興技術
- 專利趨勢
- 貿易統計(HS編碼)
- 主要進口國
- 主要出口國
- 永續性和環境方面
- 永續計劃
- 減少廢棄物策略
- 生產中的能源效率
- 環保意識的舉措
- 考慮碳足跡
第4章 競爭情勢
- 介紹
- 企業市佔率分析
- 按地區
- 北美洲
- 歐洲
- 亞太地區
- 拉丁美洲
- 中東和非洲
- 按地區
- 企業矩陣分析
- 主要市場公司的競爭分析
- 競爭定位矩陣
- 主要進展
- 併購
- 夥伴關係與合作
- 新產品發布
- 業務拓展計劃
第5章 市場估計與預測:依類型分類,2022-2035年
- 瓜爾膠
- 瓜米爾
- 瓜爾豆
第6章 市場估計與預測:依類型分類,2022-2035年
- 粉末
- 顆粒
- 液體
第7章 市場估計與預測:依應用領域分類,2022-2035年
- 食品工業
- 麵包糖果甜點
- 乳製品和冷凍甜點
- 調味醬料
- 飲料業
- 其他
第8章 市場估算與預測:依通路分類,2022-2035年
- 直銷
- 間接銷售
- 線上零售
- 專賣店
- 超級市場/大賣場
- 其他
第9章 市場估計與預測:依地區分類,2022-2035年
- 北美洲
- 美國
- 加拿大
- 歐洲
- 德國
- 英國
- 法國
- 西班牙
- 義大利
- 其他歐洲地區
- 亞太地區
- 中國
- 印度
- 日本
- 澳洲
- 韓國
- 亞太其他地區
- 拉丁美洲
- 巴西
- 墨西哥
- 阿根廷
- 其他拉丁美洲地區
- 中東和非洲
- 沙烏地阿拉伯
- 南非
- 阿拉伯聯合大公國
- 其他中東和非洲地區
第10章:公司簡介
- Agro Gums
- Ashland Global Holdings Inc.
- Dabur India Ltd.
- Hindustan Gum and Chemicals Limited(HGCL)
- Vikas WSP Limited
- Guar Resources LLC
- India Glycols Limited
- Jai Bharat Gum and Chemicals Ltd.
- Lamberti SpA
- Lucid Group
- Neelkanth Polymers
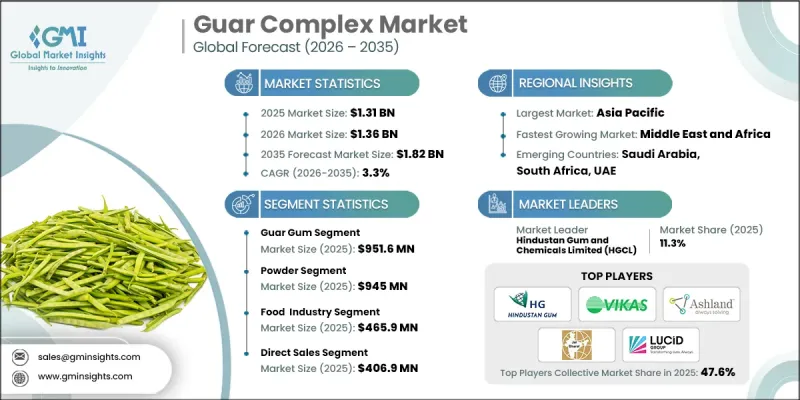
The Global Guar Complex Market was valued at USD 1.31 billion in 2025 and is estimated to grow at a CAGR of 3.3% to reach USD 1.82 billion by 2035.
The guar complex market encompasses a structured value chain that begins with the cultivation and supply of guar seeds and extends to the processing of derivatives such as guar gum, splits, and powder. The crop is primarily cultivated in semi-arid regions due to its low water requirements and ability to withstand harsh climatic conditions, which supports consistent raw material availability. The guar complex industry plays a vital role across multiple sectors due to its functionality as a natural thickening and binding agent. Guar-derived products are widely recognized for their ability to regulate viscosity, improve stability, and enhance water retention in formulations. These functional benefits support their widespread use across diverse industrial applications. In recent years, advancements in processing technologies have significantly improved product quality and operational efficiency. Manufacturers are increasingly adopting modern milling, purification, and viscosity control techniques to meet application-specific requirements. Automation and enhanced quality monitoring systems are also contributing to reduced waste and improved consistency. Growing emphasis on plant-based and biodegradable materials is further accelerating demand within the guar complex market.
| Market Scope | |
|---|---|
| Start Year | 2025 |
| Forecast Year | 2026-2035 |
| Start Value | $1.31 Billion |
| Forecast Value | $1.82 Billion |
| CAGR | 3.3% |
The guar gum segment accounted for USD 951.6 million in 2025. Its widespread utilization is driven by its strong thickening and stabilizing properties, making it suitable for a variety of applications across multiple industries. Market trends are increasingly focused on achieving consistent product performance, tailored functional attributes, and alignment with clean-label requirements. In addition, guar meals continue to generate demand due to their nutritional profile and cost-effectiveness, supporting their use in feed-related applications. The cultivation and processing of guar crops remain closely linked to the need for reliable downstream products that support consistent supply and application performance across different end-use sectors.
The food segment reached USD 465.9 million in 2025. Demand within this segment is driven by the need for effective texture control, stabilization, and moisture management in product formulations. Manufacturers are increasingly focusing on achieving uniform consistency and reliable processing outcomes. Functional requirements such as viscosity control, structural stability, and resistance to temperature variations are key considerations in product development. Maintaining consistent product characteristics during processing and storage is essential, which continues to support the use of guar-based ingredients. The ability to enhance formulation performance while ensuring stability and uniformity remains a key factor driving adoption across food-related applications.
North America Guar Complex Market is projected to grow from USD 249.4 million in 2025 to USD 319.1 million by 2035, reflecting steady expansion over the forecast period. Growth in the region is supported by sustained demand across food processing, industrial applications, and personal care sectors. Market dynamics are influenced by the need for reliable supply chains, consistent product quality, and technical support. Demand is also shaped by increasing preference for plant-based materials with verified performance standards. In the United States, buyers prioritize products that maintain consistent viscosity, meet defined quality specifications, and ensure timely delivery. Stable sourcing strategies and inventory management practices are contributing to balanced market conditions, while continued demand for processed goods supports overall growth in the guar complex market.
Key companies operating in the Global Guar Complex Market include Agro Gums, Ashland Global Holdings Inc., Dabur India Ltd., Hindustan Gum and Chemicals Limited (HGCL), Vikas WSP Limited, Guar Resources LLC, India Glycols Limited, Jai Bharat Gum and Chemicals Ltd., Lamberti S.p.A., Lucid Group, and Neelkanth Polymers. Companies in the guar complex market are focusing on strengthening their market position through investments in advanced processing technologies and quality enhancement initiatives. Many players are prioritizing product innovation to develop customized solutions that meet specific industry requirements. Strategic collaborations and long-term supply agreements are being used to secure raw material availability and expand market reach. Companies are also improving operational efficiency by adopting automation and advanced quality control systems. In addition, there is a growing emphasis on sustainable practices, including the promotion of plant-based and biodegradable products. Expanding distribution networks and maintaining consistent product standards are further supporting customer retention and long-term growth.
Table of Contents
Chapter 1 Methodology & Scope
- 1.1 Market scope and definition
- 1.2 Research design
- 1.2.1 Research approach
- 1.2.2 Data collection methods
- 1.3 Data mining sources
- 1.3.1 Global
- 1.3.2 Regional/Country
- 1.4 Base estimates and calculations
- 1.4.1 Base year calculation
- 1.4.2 Key trends for market estimation
- 1.5 Primary research and validation
- 1.5.1 Primary sources
- 1.6 Forecast model
- 1.7 Research assumptions and limitations
Chapter 2 Executive Summary
- 2.1 Industry 360° synopsis
- 2.2 Key market trends
- 2.2.1 Type
- 2.2.2 Form
- 2.2.3 Application
- 2.2.4 Distribution Channel
- 2.2.5 Regional
- 2.3 TAM Analysis, 2026-2035
- 2.4 CXO perspectives: Strategic imperatives
- 2.5 Future outlook and strategic recommendations
Chapter 3 Industry Insights
- 3.1 Industry ecosystem analysis
- 3.1.1 Supplier landscape
- 3.1.2 Profit margin
- 3.1.3 Value addition at each stage
- 3.1.4 Factor affecting the value chain
- 3.1.5 Disruptions
- 3.2 Industry impact forces
- 3.2.1 Growth drivers
- 3.2.1.1 Growing demand for natural thickening agents across industries
- 3.2.1.2 Expansion of oilfield applications supporting guar consumption growth
- 3.2.1.3 Increasing preference for plant based functional ingredients
- 3.2.2 Pitfalls/challenge
- 3.2.2.1 Price volatility due to seasonal supply variations frequently
- 3.2.2.2 Limited storage infrastructure impacting raw material quality levels
- 3.2.3 Opportunities
- 3.2.3.1 Growing use in processed food applications worldwide steadily
- 3.2.3.2 Product customization for diverse industrial application requirements needs
- 3.2.1 Growth drivers
- 3.3 Growth potential analysis
- 3.4 Regulatory landscape
- 3.4.1 North America
- 3.4.2 Europe
- 3.4.3 Asia Pacific
- 3.4.4 Latin America
- 3.4.5 Middle East & Africa
- 3.5 Porter's analysis
- 3.6 PESTEL analysis
- 3.7 Technology and innovation landscape
- 3.7.1 Current technological trends
- 3.7.2 Emerging technologies
- 3.8 Price trends
- 3.8.1 By region
- 3.8.2 By type
- 3.9 Future market trends
- 3.10 Technology and innovation landscape
- 3.10.1 Current technological trends
- 3.10.2 Emerging technologies
- 3.11 Patent landscape
- 3.12 Trade statistics (HS code)
- 3.12.1 Major importing countries
- 3.12.2 Major exporting countries
- 3.13 Sustainability and environmental aspects
- 3.13.1 Sustainable practices
- 3.13.2 Waste reduction strategies
- 3.13.3 Energy efficiency in production
- 3.13.4 Eco-friendly initiatives
- 3.14 Carbon footprint consideration
Chapter 4 Competitive Landscape, 2025
- 4.1 Introduction
- 4.2 Company market share analysis
- 4.2.1 By region
- 4.2.1.1 North America
- 4.2.1.2 Europe
- 4.2.1.3 Asia Pacific
- 4.2.1.4 LATAM
- 4.2.1.5 MEA
- 4.2.1 By region
- 4.3 Company matrix analysis
- 4.4 Competitive analysis of major market players
- 4.5 Competitive positioning matrix
- 4.6 Key developments
- 4.6.1 Mergers & acquisitions
- 4.6.2 Partnerships & collaborations
- 4.6.3 New product launches
- 4.6.4 Expansion plans
Chapter 5 Market Estimates and Forecast, By Type, 2022-2035 (USD Million) (Kilo Tons)
- 5.1 Key trends
- 5.2 Guar gum
- 5.3 Guar meal
- 5.4 Guar seeds
Chapter 6 Market Estimates and Forecast, By Form, 2022-2035 (USD Million) (Kilo Tons)
- 6.1 Key trends
- 6.2 Powder
- 6.3 Granules
- 6.4 Liquid
Chapter 7 Market Estimates and Forecast, By Application, 2022-2035 (USD Million) (Kilo Tons)
- 7.1 Key trends
- 7.2 Food Industry
- 7.3 Bakery & Confectionery
- 7.4 Dairy & Frozen Desserts
- 7.5 Sauces & Dressings
- 7.6 Beverages Industry
- 7.7 Others
Chapter 8 Market Estimates and Forecast, By Distribution Channel, 2022-2035 (USD Million) (Kilo Tons)
- 8.1 Key trends
- 8.2 Direct sales
- 8.3 Indirect sales
- 8.4 Online retail
- 8.5 Specialty stores
- 8.6 Supermarkets/hypermarkets
- 8.7 Others
Chapter 9 Market Estimates and Forecast, By Region, 2022-2035 (USD Million) (Kilo Tons)
- 9.1 Key trends
- 9.2 North America
- 9.2.1 U.S.
- 9.2.2 Canada
- 9.3 Europe
- 9.3.1 Germany
- 9.3.2 UK
- 9.3.3 France
- 9.3.4 Spain
- 9.3.5 Italy
- 9.3.6 Rest of Europe
- 9.4 Asia Pacific
- 9.4.1 China
- 9.4.2 India
- 9.4.3 Japan
- 9.4.4 Australia
- 9.4.5 South Korea
- 9.4.6 Rest of Asia Pacific
- 9.5 Latin America
- 9.5.1 Brazil
- 9.5.2 Mexico
- 9.5.3 Argentina
- 9.5.4 Rest of Latin America
- 9.6 Middle East and Africa
- 9.6.1 Saudi Arabia
- 9.6.2 South Africa
- 9.6.3 UAE
- 9.6.4 Rest of Middle East and Africa
Chapter 10 Company Profiles
- 10.1 Agro Gums
- 10.2 Ashland Global Holdings Inc.
- 10.3 Dabur India Ltd.
- 10.4 Hindustan Gum and Chemicals Limited (HGCL)
- 10.5 Vikas WSP Limited
- 10.6 Guar Resources LLC
- 10.7 India Glycols Limited
- 10.8 Jai Bharat Gum and Chemicals Ltd.
- 10.9 Lamberti S.p.A.
- 10.10 Lucid Group
- 10.11 Neelkanth Polymers
 瓜爾膠衍生複合劑市場規模、佔有率和成長分析:按產品類型、應用、最終用途、通路和地區分類-2026-2033年產業預測
 全球瓜爾膠複合物市場規模、佔有率、趨勢和成長分析報告(2026-2034年)
 瓜爾膠市場 - 全球產業規模、佔有率、趨勢、機會及預測(按功能、應用、等級、地區和競爭格局分類,2021-2031年)
 瓜爾膠市場規模、佔有率和成長分析(按等級、功能、應用和地區分類)-2026-2033年產業預測
 瓜爾膠複合物的全球市場
 部分水解瓜爾膠市場機會、成長動力、產業趨勢分析及2025-2034年預測瓜爾膠市場:未來預測(2025-2030)