


 |
市場調查報告書
商品編碼
1755257
部分水解瓜爾膠市場機會、成長動力、產業趨勢分析及2025-2034年預測Partially Hydrolyzed Guar Gum Market Opportunity, Growth Drivers, Industry Trend Analysis, and Forecast 2025 - 2034 |
||||||
2024年,全球部分水解瓜爾膠市場價值為2.511億美元,預計到2034年將以6%的複合年成長率成長,達到4.475億美元,這得益於全球對消化健康產品、清潔標籤營養品和富含益生元食品的需求激增。部分水解瓜爾膠(PHGG)經過酵素水解,成為一種低黏度、水溶性纖維,非常適合多種應用。它在不同pH值和溫度下保持穩定,可與多種食品體系相容,包括功能性食品、飲料和膳食補充劑。隨著人們日益轉向植物性、無過敏原成分,PHGG也成為配製健康消費品的首選成分。
尋求消化緩解的消費者推動了對營養保健品中PHGG的需求,其益生元益處有助於維持腸道菌叢平衡,並緩解胃腸道疾病症狀。由於易於添加且功能多樣,這種成分擴大出現在烘焙食品、植物性替代品、強化零食和治療配方中。它具有清潔標籤的吸引力、優異的溶解性和溫和的口感,非常適合注重健康的消費者,他們希望在不影響口感或風味的情況下增加每日纖維攝取量。
| 市場範圍 | |
|---|---|
| 起始年份 | 2024 |
| 預測年份 | 2025-2034 |
| 起始值 | 2.511億美元 |
| 預測值 | 4.475億美元 |
| 複合年成長率 | 6% |
2024年,食品級細分市場的收入為1.25億美元。由於PHGG的溶解性和促進健康的特性,它在日常食品中的廣泛應用使該細分市場受益匪淺。 PHGG能夠在不影響風味和質地的情況下提供功能性纖維,這促使其被整合到富含纖維的飲料、穀物和餐棒中。 PHGG在增強飽足感和消化舒適度方面的作用,使其成為尋求清潔標籤、注重健康的產品的消費者的理想選擇。
2024年,製藥業產值達7,090萬美元,預計到2034年將達到1.164億美元。 PHGG在臨床營養領域廣受認可,可用於治療腸躁症(IBS)和便秘等消化系統疾病。其低黏度和跨年齡層耐受性使其適合用於長期飲食支援。隨著臨床資料越來越證實其有效性,PHGG在結腸保健補充劑和治療性纖維干預措施中的應用日益廣泛,尤其是在全球老年人和注重健康的人群中。
2024年,美國部分水解瓜爾膠市場產值達5,550萬美元,食品和製藥業對此表現出巨大的吸引力。其應用領域正在迅速擴展,涵蓋治療性飲食應用、醫學營養,甚至寵物和個人護理領域,尤其在老齡化人群中,需求不斷成長。該成分能夠支持消化系統健康、調節血糖反應並有助於控制體重,是健康產品開發中不可或缺的功能性要素。配方師也正在探索部分水解瓜爾膠與補充品、臨床營養配方和老年人膳食需求的兼容性。
部分水解瓜爾膠市場的主要參與者包括巴斯夫 SE、Ingredion Incorporated(及其子公司 Tic Gums, Inc.)、CP Kelco US, Inc.、Ashland Global Holdings Inc. 和嘉吉公司。這些公司正在積極促進市場創新和擴張。出於策略重點,部分水解瓜爾膠領域的領先公司正在大力投資研發,以開發針對藥品、功能性食品和清潔標籤應用的專用 PHGG 變體。許多參與者正在擴大生產能力,以滿足日益成長的全球需求,尤其是在北美和亞洲。與食品和營養保健品製造商的策略合作正在幫助公司拓寬分銷網路。監管部門的批准和臨床驗證也是市場進入和信譽的關鍵,促使公司優先考慮科學研究和安全認證。
目錄
第1章:方法論與範圍
第2章:執行摘要
第3章:行業洞察
- 市場介紹
- 產業價值鏈分析
- 產品概述
- Phgg:定義與組成
- 生產過程和酵素水解
- 物理化學性質
- 營養成分和健康益處
- 益生元特性與腸道健康影響
- 與天然瓜爾膠的比較
- 與其他膳食纖維的比較
- 市場動態
- 市場促進因素
- 對消化健康和益生元的需求不斷成長
- 功能性食品和營養保健品的成長
- 清潔標籤和植物成分偏好
- 市場促進因素
- 市場限制
- 生產加工成本高
- 新興市場消費者意識有限
- 跨地區監管的複雜性
- 市場機會
- 腸道健康功能成分需求不斷成長
- 擴大在營養保健品和食品領域的應用
- 低 FODMAP 膳食纖維日益受到關注
- 產業衝擊力
- 成長潛力分析
- 產業陷阱與挑戰
- 監管框架和標準
- 食品添加物法規
- 膳食纖維定義
- 健康聲明法規
- 品質和安全標準
- 有機和非基因改造認證
- 製造流程分析
- 瓜爾膠提取
- 酶水解過程
- 淨化技術
- 乾燥和研磨
- 品質控制程式
- 原料分析與採購策略
- 定價分析
- 永續性和環境影響評估
- 杵分析
- 波特五力分析
- 貿易分析:進出口情景
- 川普政府關稅分析
- 對貿易的影響
- 貿易量中斷
- 報復措施
- 對產業的影響
- 供給側影響(原料)
- 主要材料價格波動
- 供應鏈重組
- 生產成本影響
- 需求面影響(售價)
- 價格傳導至終端市場
- 市佔率動態
- 消費者反應模式
- 受影響的主要公司
- 策略產業反應
- 供應鏈重組
- 定價和產品策略
- 政策參與
- 貿易統計(HS編碼)
- 2021-2024年主要出口國
- 美國
- 日本
- 韓國
- 2021-2024年主要進口國
- 印度
- 俄羅斯
- 美國
- 2021-2024年主要出口國
- 供給側影響(原料)
- 對貿易的影響
註:以上貿易統計僅針對重點國家。
第4章:競爭格局
- 市佔率分析
- 戰略框架
- 併購
- 合資與合作
- 新產品開發
- 擴張策略
- 競爭基準測試
- 供應商格局
- 競爭定位矩陣
- 戰略儀表板
- 專利分析與創新評估
- 新參與者的市場進入策略
- 配電網路分析
第5章:市場估計與預測:依等級,2021 - 2034 年
- 主要趨勢
- 食品級
- 標準
- 優質的
- 製藥
- 工業的
- 其他
第6章:市場估計與預測:依形式 2021 - 2034
- 主要趨勢
- 粉末
- 美好的
- 粗
- 顆粒
- 其他
第7章:市場估計與預測:按生產方法,2021 - 2034 年
- 主要趨勢
- 酵素水解
- 批次
- 連續的
- 化學水解
- 其他生產
第8章:市場估計與預測:按應用 2021 - 2034
- 主要趨勢
- 食品和烘焙食品
- 烘焙和糖果
- 乳製品和冷凍甜點
- 飲料
- 早餐穀物和能量棒
- 醬汁、調味品和佐料
- 肉類和家禽產品
- 其他食品應用
- 膳食補充劑
- 纖維補充劑
- 體重管理補充劑
- 消化健康補充劑
- 其他補充劑類型
- 製藥
- 固體劑型
- 液體製劑
- 其他醫藥應用
- 個人護理和化妝品
- 動物飼料
- 其他應用
第9章:市場估計與預測:按功能,2021 - 2034 年
- 主要趨勢
- 膳食纖維強化
- 益生元作用
- 紋理修改
- 穩定
- 增稠
- 脂肪替代
- 其他功能
第 10 章:市場估計與預測:依最終用途,2021 年至 2034 年
- 主要趨勢
- 食品和飲料業
- 大型食品生產商
- 中小型食品加工機
- 特色食品生產商
- 營養保健品產業
- 製藥業
- 大型製藥公司
- 學名藥製造商
- 合約製造組織(cmos)
- 個人護理行業
- 動物飼料業
- 其他最終用途產業
第 11 章:市場估計與預測:按配銷通路,2021 年至 2034 年
- 主要趨勢
- 直銷
- 分銷商和批發商
- 線上通路
- 其他
第 12 章:市場估計與預測:按地區,2021 年至 2034 年
- 主要趨勢
- 北美洲
- 美國
- 加拿大
- 歐洲
- 德國
- 英國
- 法國
- 西班牙
- 義大利
- 俄羅斯
- 歐洲其他地區
- 亞太地區
- 中國
- 印度
- 日本
- 澳洲
- 韓國
- 亞太其他地區
- 拉丁美洲
- 巴西
- 墨西哥
- 阿根廷
- 拉丁美洲其他地區
- 中東和非洲
- 沙烏地阿拉伯
- 南非
- 阿拉伯聯合大公國
- MEA 其餘地區
第13章:公司簡介
- Altrafine Gums
- Ashland Global Holdings Inc.
- BASF SE
- Cargill, Incorporated
- CP Kelco US, Inc.
- Dabur India Ltd.
- Deosen Biochemical Ltd.
- DuPont de Nemours, Inc.
- Fufeng Group
- Guangrao Liuhe Chemical Co., Ltd.
- Hindustan Gum & Chemicals Ltd.
- Ingredion Incorporated
- Jingkun Chemistry Company
- Kerry Group plc
- Lonza Group AG
- Lotus Gums & Chemicals
- Lucid Colloids Ltd.
- Meihua Holdings Group Co., Ltd.
- Neelkanth Polymers
- Nexira
- Polygal AG
- Rama Industries
- Shandong Yuansheng Chemical Co., Ltd.
- Shree Ram Gum Chemicals
- Sunita Hydrocolloids Pvt. Ltd.
- Taiyo International, Inc.
- Tic Gums, Inc. (Ingredion)
- Vikas WSP Limited
- Wuxi Jinxin Science & Technology Co., Ltd.
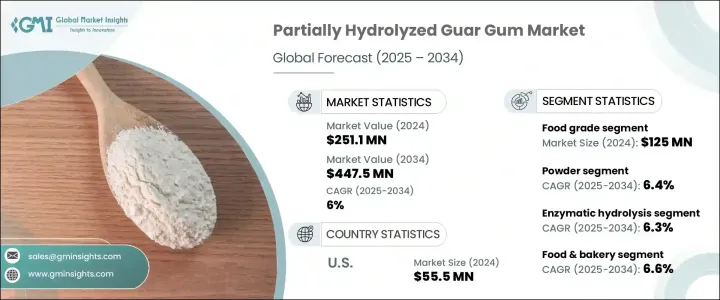
The Global Partially Hydrolyzed Guar Gum Market was valued at USD 251.1 million in 2024 and is estimated to grow at a CAGR of 6% to reach USD 447.5 million by 2034, driven by the global surge in demand for digestive health products, clean-label nutrition, and prebiotic-enriched foods. PHGG undergoes enzymatic hydrolysis, making it a low-viscosity, water-soluble fiber ideal for several applications. It maintains stability across varying pH levels and temperatures, offering compatibility with diverse food systems including functional foods, beverages, and dietary supplements. The increasing shift toward plant-based, allergen-free ingredients has also positioned PHGG as a preferred component in formulating health-focused consumer products.
Consumers seeking digestive relief are fueling the demand for PHGG in nutraceuticals, where its prebiotic benefits support gut microbiota balance and alleviate symptoms of gastrointestinal disorders. The ingredients are increasingly found in bakery goods, plant-based alternatives, fortified snacks, and therapeutic formulations due to ease of incorporation and functional versatility. It offers clean-label appeal, excellent solubility, and a mild taste, making it ideal for health-conscious consumers looking to boost daily fiber intake without compromising texture or flavor.
| Market Scope | |
|---|---|
| Start Year | 2024 |
| Forecast Year | 2025-2034 |
| Start Value | $251.1 Million |
| Forecast Value | $447.5 Million |
| CAGR | 6% |
The food-grade segment generated USD 125 million in 2024. This segment benefits from the broad usage of PHGG in everyday food items due to its solubility and health-promoting qualities. PHGG's ability to deliver functional fiber without compromising flavor or texture has driven its integration into fiber-enriched beverages, cereals, and meal bars. Its role in promoting satiety and digestive comfort makes it ideal for consumers seeking clean-label, wellness-oriented products.
The pharmaceutical segment generated USD 70.9 million in 2024 and is projected to reach USD 116.4 million by 2034. PHGG is well-recognized in clinical nutrition for managing digestive ailments such as IBS and constipation. Its low viscosity and tolerance across age groups make it suitable for long-term dietary support. As clinical data increasingly affirms its efficacy, PHGG is finding wider use in colon health supplements and therapeutic fiber-based interventions, especially in geriatric and health-conscious populations worldwide.
United States Partially Hydrolyzed Guar Gum Market generated USD 55.5 million in 2024 witnessing substantial traction from the food and pharma sectors. Use cases are expanding rapidly across therapeutic dietary applications, medical nutrition, and even pet and personal care categories, with demand rising especially among aging populations. The ingredient's ability to support digestive health, manage glycemic response, and aid in weight control positions are a functional staple in health-focused product development. Formulators are also exploring PHGG for its compatibility with supplements, clinical nutrition formulas, and geriatric dietary needs.
Key market players in the Partially Hydrolyzed Guar Gum Market include BASF SE, Ingredion Incorporated (and its subsidiary Tic Gums, Inc.), CP Kelco U.S., Inc., Ashland Global Holdings Inc., and Cargill, Incorporated. These companies are actively contributing to market innovation and expansion. Strategic focus, leading companies in the partially hydrolyzed guar gum space are investing heavily in R&D to develop specialized PHGG variants tailored for pharmaceutical, functional food, and clean-label applications. Many players are expanding their production capacities to meet growing global demand, especially in North America and Asia. Strategic collaborations with food and nutraceutical manufacturers are helping firms broaden their distribution networks. Regulatory approvals and clinical validation are also key to market entry and credibility, prompting companies to prioritize scientific studies and safety certifications.
Table of Contents
Chapter 1 Methodology and Scope
- 1.1 Research methodology
- 1.2 Research scope & assumptions
- 1.3 List of data sources
- 1.4 Market estimation technique
- 1.5 Market segmentation & breakdown
- 1.6 Research limitations
Chapter 2 Executive Summary
- 2.1 Market snapshot
- 2.2 Segment highlights
- 2.3 Competitive landscape snapshot
- 2.4 Regional market outlook
- 2.5 Key market trends
- 2.6 Future market outlook
Chapter 3 Industry Insights
- 3.1 Market introduction
- 3.2 Industry value chain analysis
- 3.3 Product overview
- 3.3.1 Phgg: definition & composition
- 3.3.2 Production process & enzymatic hydrolysis
- 3.3.3 Physicochemical properties
- 3.3.4 Nutritional profile & health benefits
- 3.3.5 Prebiotic properties & gut health effects
- 3.3.6 Comparison with native guar gum
- 3.3.7 Comparison with other dietary fibers
- 3.4 Market dynamics
- 3.4.1 Market drivers
- 3.4.1.1 Rising demand for digestive health and prebiotics
- 3.4.1.2 Growth in functional foods and nutraceuticals
- 3.4.1.3 Clean-label and plant-based ingredient preferences
- 3.4.1 Market drivers
- 3.5 Market restraints
- 3.5.1.1 High production and processing costs
- 3.5.1.2 Limited consumer awareness in emerging markets
- 3.5.1.3 Regulatory complexity across regions
- 3.6 Market opportunities
- 3.6.1.1 Rising demand for gut health functional ingredients
- 3.6.1.2 Expanding applications in nutraceutical and food sectors
- 3.6.1.3 Growing interest in low-fodmap dietary fibers
- 3.7 Industry impact forces
- 3.7.1 Growth potential analysis
- 3.7.2 Industry pitfalls & challenges
- 3.8 Regulatory framework & standards
- 3.8.1 Food additive regulations
- 3.8.2 Dietary fiber definitions
- 3.8.3 Health claim regulations
- 3.8.4 Quality & safety standards
- 3.8.5 Organic & non-gmo certifications
- 3.9 Manufacturing process analysis
- 3.9.1 Guar gum extraction
- 3.9.2 Enzymatic hydrolysis process
- 3.9.3 Purification techniques
- 3.9.4 Drying & milling
- 3.9.5 Quality control procedures
- 3.10 Raw material analysis & procurement strategies
- 3.11 Pricing analysis
- 3.12 Sustainability & environmental impact assessment
- 3.13 Pestle analysis
- 3.14 Porter's five forces analysis
- 3.15 Trade analysis: import-export scenario
- 3.16 Trump administration tariff analysis
- 3.16.1 Impact on trade
- 3.16.1.1 Trade volume disruptions
- 3.16.1.2 Retaliatory measures
- 3.16.2 Impact on the industry
- 3.16.2.1 Supply-side impact (raw materials)
- 3.16.2.1.1 Price volatility in key materials
- 3.16.2.1.2 Supply chain restructuring
- 3.16.2.1.3 Production cost implications
- 3.16.2.2 Demand-side impact (selling price)
- 3.16.2.2.1 Price transmission to end markets
- 3.16.2.2.2 Market share dynamics
- 3.16.2.2.3 Consumer response patterns
- 3.16.2.3 Key companies impacted
- 3.16.2.4 Strategic industry responses
- 3.16.2.5 Supply chain reconfiguration
- 3.16.2.6 Pricing and product strategies
- 3.16.2.7 Policy engagement
- 3.16.2.8 Trade statistics (hs code)
- 3.16.2.8.1 Major exporting countries, 2021-2024 (USD BN)
- 3.16.2.8.1.1 U.S.
- 3.16.2.8.1.2 Japan
- 3.16.2.8.1.3 South Korea
- 3.16.2.8.2 Major importing countries, 2021-2024 (USD BN)
- 3.16.2.8.2.1 India
- 3.16.2.8.2.2 Russia
- 3.16.2.8.2.3 U.S.
- 3.16.2.8.1 Major exporting countries, 2021-2024 (USD BN)
- 3.16.2.1 Supply-side impact (raw materials)
- 3.16.1 Impact on trade
Note: the above trade statistics will be provided for key countries only.
Chapter 4 Competitive Landscape, 2024
- 4.1 Market share analysis
- 4.2 Strategic framework
- 4.2.1 Mergers & acquisitions
- 4.2.2 Joint ventures & collaborations
- 4.2.3 New product developments
- 4.2.4 Expansion strategies
- 4.3 Competitive benchmarking
- 4.4 Vendor landscape
- 4.5 Competitive positioning matrix
- 4.6 Strategic dashboard
- 4.7 Patent analysis & innovation assessment
- 4.8 Market entry strategies for new players
- 4.9 Distribution network analysis
Chapter 5 Market Estimates and Forecast, By Grade, 2021 - 2034 (USD Million) (Kilo Tons)
- 5.1 Key trends
- 5.2 Food grade
- 5.2.1 Standard
- 5.2.2 Premium
- 5.3 Pharmaceutical
- 5.4 Industrial
- 5.5 Other
Chapter 6 Market Estimates and Forecast, By Form 2021 - 2034 (USD Million) (Kilo Tons)
- 6.1 Key trends
- 6.2 Powder
- 6.2.1 Fine
- 6.2.2 Coarse
- 6.3 Granules
- 6.4 Others
Chapter 7 Market Estimates and Forecast, By Production Method, 2021 - 2034 (USD Million) (Kilo Tons)
- 7.1 Key trends
- 7.2 Enzymatic hydrolysis
- 7.2.1 Batch
- 7.2.2 Continuous
- 7.3 Chemical hydrolysis
- 7.4 Other production
Chapter 8 Market Estimates and Forecast, By Application 2021 - 2034 (USD Million) (Kilo Tons)
- 8.1 Key trends
- 8.2 Food & bakery
- 8.2.1 Bakery & confectionery
- 8.2.2 Dairy & frozen desserts
- 8.2.3 Beverages
- 8.2.4 Breakfast cereals & bars
- 8.2.5 Sauces, dressings and condiments
- 8.2.6 Meat & poultry product
- 8.2.7 Other food applications
- 8.3 Dietery supplement
- 8.3.1 Fiber supplements
- 8.3.2 Weight management supplements
- 8.3.3 Digestive health supplements
- 8.3.4 Other supplement types
- 8.4 Pharmaceuticals
- 8.4.1 Solid dosage forms
- 8.4.2 Liquid formulations
- 8.4.3 Other pharmaceuticals application
- 8.5 Personal care & cosmetics
- 8.6 Animal feed
- 8.7 Other applications
Chapter 9 Market Estimates and Forecast, By Functionality, 2021 - 2034 (USD Million) (Kilo Tons)
- 9.1 Key trends
- 9.2 Dietary fiber enrichment
- 9.3 Prebiotic effect
- 9.4 Texture modification
- 9.5 Stabilization
- 9.6 Thickening
- 9.7 Fat replacement
- 9.8 Other functionalities
Chapter 10 Market Estimates and Forecast, By End Use, 2021 - 2034 (USD Million) (Kilo Tons)
- 10.1 Key trends
- 10.2 Food & beverage industry
- 10.2.1 Large food manufacturers
- 10.2.2 Medium & small food processors
- 10.2.3 Specialty food producers
- 10.3 Nutraceutical industry
- 10.4 Pharmaceutical industry
- 10.4.1 Large pharmaceutical companies
- 10.4.2 Generic drug manufacturers
- 10.4.3 Contract manufacturing organizations (cmos)
- 10.5 Personal care industry
- 10.6 Animal feed industry
- 10.7 Other end-use industries
Chapter 11 Market Estimates and Forecast, By Distribution Channel, 2021 - 2034 (USD Million) (Kilo Tons)
- 11.1 Key trends
- 11.2 Direct sales
- 11.3 Distributors & wholesalers
- 11.4 Online channels
- 11.5 Others
Chapter 12 Market Estimates and Forecast, By Region, 2021 - 2034 (USD Million) (Kilo Tons)
- 12.1 Key trends
- 12.2 North America
- 12.2.1 U.S.
- 12.2.2 Canada
- 12.3 Europe
- 12.3.1 Germany
- 12.3.2 UK
- 12.3.3 France
- 12.3.4 Spain
- 12.3.5 Italy
- 12.3.6 Russia
- 12.3.7 Rest of Europe
- 12.4 Asia Pacific
- 12.4.1 China
- 12.4.2 India
- 12.4.3 Japan
- 12.4.4 Australia
- 12.4.5 South Korea
- 12.4.6 Rest of Asia Pacific
- 12.5 Latin America
- 12.5.1 Brazil
- 12.5.2 Mexico
- 12.5.3 Argentina
- 12.5.4 Rest of Latin America
- 12.6 Middle East and Africa
- 12.6.1 Saudi Arabia
- 12.6.2 South Africa
- 12.6.3 UAE
- 12.6.4 Rest of MEA
Chapter 13 Company Profiles
- 13.1 Altrafine Gums
- 13.2 Ashland Global Holdings Inc.
- 13.3 BASF SE
- 13.4 Cargill, Incorporated
- 13.5 CP Kelco U.S., Inc.
- 13.6 Dabur India Ltd.
- 13.7 Deosen Biochemical Ltd.
- 13.8 DuPont de Nemours, Inc.
- 13.9 Fufeng Group
- 13.10 Guangrao Liuhe Chemical Co., Ltd.
- 13.11 Hindustan Gum & Chemicals Ltd.
- 13.12 Ingredion Incorporated
- 13.13 Jingkun Chemistry Company
- 13.14 Kerry Group plc
- 13.15 Lonza Group AG
- 13.16 Lotus Gums & Chemicals
- 13.17 Lucid Colloids Ltd.
- 13.18 Meihua Holdings Group Co., Ltd.
- 13.19 Neelkanth Polymers
- 13.20 Nexira
- 13.21 Polygal AG
- 13.22 Rama Industries
- 13.23 Shandong Yuansheng Chemical Co., Ltd.
- 13.24 Shree Ram Gum Chemicals
- 13.25 Sunita Hydrocolloids Pvt. Ltd.
- 13.26 Taiyo International, Inc.
- 13.27 Tic Gums, Inc. (Ingredion)
- 13.28 Vikas WSP Limited
- 13.29 Wuxi Jinxin Science & Technology Co., Ltd.
 瓜爾膠衍生複合劑市場規模、佔有率和成長分析:按產品類型、應用、最終用途、通路和地區分類-2026-2033年產業預測
 瓜爾膠複合物市場機會、成長要素、產業趨勢分析及2026-2035年預測
 全球瓜爾膠複合物市場規模、佔有率、趨勢和成長分析報告(2026-2034年)
 瓜爾膠市場 - 全球產業規模、佔有率、趨勢、機會及預測(按功能、應用、等級、地區和競爭格局分類,2021-2031年)
 瓜爾膠市場規模、佔有率和成長分析(按等級、功能、應用和地區分類)-2026-2033年產業預測
 瓜爾膠複合物的全球市場瓜爾膠市場:未來預測(2025-2030)