


 |
市場調查報告書
商品編碼
2019055
鋁罐市場商機、成長要素、產業趨勢分析及2026-2035年預測。Aluminum Cans Market Opportunity, Growth Drivers, Industry Trend Analysis, and Forecast 2026 - 2035 |
||||||
預計到 2025 年,全球鋁罐市場價值將達到 537 億美元,並有望以 5% 的複合年成長率成長,到 2035 年達到 865 億美元。
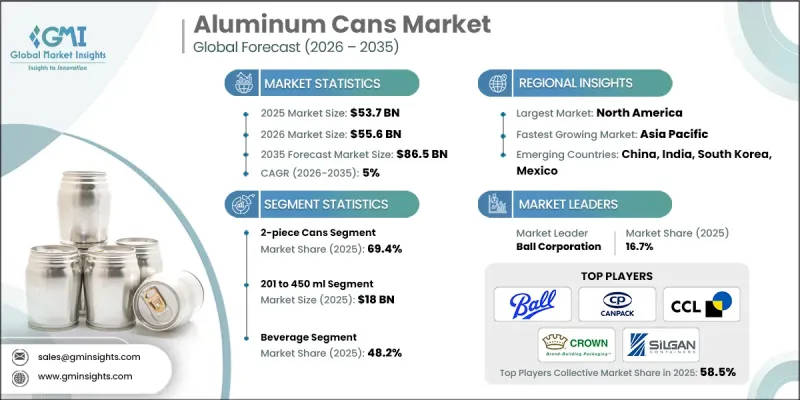
市場成長的促進因素包括:碳酸飲料和啤酒需求的不斷成長、消費者對高可回收性飲料包裝日益成長的偏好,以及鋁在循環包裝系統中卓越的回收效率。即飲飲料和機能飲料的擴張正在推動市場需求,飲料製造商對輕便、永續和環保的金屬包裝解決方案的關注也起到了促進作用。隨著全球飲料消費量的成長,製造商優先考慮使用鋁罐,因為鋁罐在維持碳酸化、維持產品品質和實現高效分銷方面具有優勢。由於鋁回收的能源消耗遠低於原生生產,因此市場能夠同時受益於環境效益和成本效益。永續性意識和對可回收包裝的監管支持正在進一步推動關鍵地區的市場滲透。
| 市場範圍 | |
|---|---|
| 開始年份 | 2025 |
| 預測期 | 2026-2035 |
| 上市時的市場規模 | 537億美元 |
| 預測金額 | 865億美元 |
| 複合年成長率 | 5% |
兩片式易拉罐憑藉其無縫結構、高強度和高效的生產流程,預計到 2025 年將佔據 69.4% 的市場佔有率。這些易拉罐廣泛用於碳酸飲料、啤酒和即飲飲料,為大型生產商提供材料效率和成本優勢。
預計到 2035 年,油漆和潤滑油領域將以 8% 的複合年成長率成長。鋁罐具有耐腐蝕性和可靠的密封性,適用於包括特殊塗料和潤滑油在內的工業流體,滿足不斷成長的工業生產和汽車維護需求。
預計到2025年,北美鋁罐市佔率將達到34.1%。該地區的成長主要得益於對罐裝飲料(包括碳酸飲料、啤酒和即飲飲料)的強勁需求。美國、加拿大和墨西哥的飲料生產商越來越傾向於使用鋁罐,因為鋁罐具有可回收性和低環境影響的優點。對新建生產設施和擴大產能的投資,使生產商能夠更好地滿足零售和餐飲服務業日益成長的需求。
目錄
第1章:調查方法和範圍
第2章執行摘要
第3章業界考察
- 生態系分析
- 供應商情況
- 利潤率
- 成本結構
- 每個階段增加的價值
- 影響價值鏈的因素
- 中斷
- 影響產業的因素
- 促進因素
- 來自碳酸飲料和啤酒產業的強勁需求。
- 消費者越來越偏好可回收的飲料包裝
- 鋁罐材質的高回收效率
- 採用輕量化包裝以降低飲料運輸成本
- 快速的都市化導致包裝飲料的消費量增加。
- 產業潛在風險與挑戰
- 鋁價波動對罐頭製造成本的影響
- 鋁冶煉過程中的高電力消耗量
- 市場機遇
- 擴大能量飲料和機能飲料的包裝範圍
- 罐頭製造中再生鋁含量增加
- 促進因素
- 成長潛力分析
- 監理情勢
- 北美洲
- 歐洲
- 亞太地區
- 拉丁美洲
- 中東和非洲
- 波特五力分析
- PESTEL 分析
- 科技與創新趨勢
- 當前技術趨勢
- 新興技術
- 價格趨勢
- 按地區
- 依產品
- 定價策略
- 新興經營模式
- 合規要求
- 專利和智慧財產權分析
第4章 競爭情勢
- 介紹
- 企業市佔率分析
- 按地區
- 北美洲
- 歐洲
- 亞太地區
- 拉丁美洲
- 中東和非洲
- 市場集中度分析
- 按地區
- 主要企業的競爭標竿分析
- 財務績效比較
- 銷售量
- 利潤率
- 研究與開發
- 產品系列比較
- 產品線寬度
- 科技
- 創新
- 區域擴張比較
- 全球擴張分析
- 服務網路覆蓋
- 按地區分類的市場滲透率
- 競爭定位矩陣
- 領導者
- 挑戰者
- 追蹤者
- 小眾玩家
- 戰略展望矩陣
- 財務績效比較
- 主要進展
- 併購
- 夥伴關係與合作
- 技術進步
- 擴張和投資策略
- 數位轉型計劃
- 新興競爭對手和Start-Ups競爭對手的發展趨勢
第5章 市場估算與預測:依產品類型分類,2022-2035年
- 1 件裝
- 兩件套罐
- 三件組罐
第6章 市場估計與預測:依產能分類,2022-2035年
- 200毫升或以下
- 201~450 ml
- 451~700 ml
- 701~1000 ml
- 超過1000毫升
第7章 市場估計與預測:依最終用戶分類,2022-2035年
- 食物
- 飲料
- 個人護理和化妝品
- 製藥
- 油漆/潤滑油
- 其他
第8章 市場估計與預測:依地區分類,2022-2035年
- 北美洲
- 美國
- 加拿大
- 歐洲
- 德國
- 英國
- 法國
- 西班牙
- 義大利
- 荷蘭
- 亞太地區
- 中國
- 印度
- 日本
- 澳洲
- 韓國
- 拉丁美洲
- 巴西
- 墨西哥
- 阿根廷
- 中東和非洲
- 南非
- 沙烏地阿拉伯
- 阿拉伯聯合大公國
第9章:公司簡介
- 主要企業
- Ball Corporation
- Crown Holdings
- CANPACK
- Toyo Seikan
- Envases Group
- 按地區分類的主要企業
- 北美洲
- Silgan Containers
- CCL Industries
- Orora Packaging
- 亞太地區
- Thai Beverage Can
- Ceylon Beverage Can
- Shiba Containers
- 歐洲
- Baixicans
- Scan Holdings
- 北美洲
- 特殊玩家/干擾者
- Ajanta Bottle
- Albott Containers
- GZI Industries
- Nampak
- Swan Industries
The Global Aluminum Cans Market was valued at USD 53.7 billion in 2025 and is estimated to grow at a CAGR of 5% to reach USD 86.5 billion in 2035.
The market's growth is driven by increasing demand from carbonated soft drinks and beer, a growing consumer preference for highly recyclable beverage packaging, and the superior recycling efficiency of aluminum within circular packaging systems. The expansion of ready-to-drink and functional beverages fuels demand, alongside beverage companies' focus on lightweight, sustainable, and eco-friendly metal packaging solutions. As beverage consumption rises globally, manufacturers are prioritizing aluminum cans for their ability to preserve carbonation, maintain product quality, and support efficient distribution. The market benefits from both environmental advantages and cost-effectiveness, as recycling aluminum consumes significantly less energy than primary production. Rising sustainability awareness and regulatory support for recyclable packaging further strengthen market adoption across key regions.
| Market Scope | |
|---|---|
| Start Year | 2025 |
| Forecast Year | 2026-2035 |
| Start Value | $53.7 Billion |
| Forecast Value | $86.5 Billion |
| CAGR | 5% |
The 2-piece cans segment held a 69.4% share in 2025, due to their seamless structure, high strength, and efficient production process. These cans are widely adopted for carbonated soft drinks, beer, and ready-to-drink beverages, offering material efficiency and cost advantages for large-scale producers.
The paints & lubricants segment is projected to grow at a CAGR of 8% through 2035. Aluminum cans provide corrosion resistance and safe containment for industrial fluids, including specialty coatings and lubricants, meeting growing industrial production and automotive maintenance needs.
North America Aluminum Cans Market accounted for 34.1% share in 2025. Growth in the region is supported by high demand for canned beverages, including carbonated drinks, beer, and ready-to-drink products. Beverage producers in the U.S., Canada, and Mexico are increasingly favoring aluminum cans for their recyclability and lower environmental impact. Investments in new production facilities and capacity expansions are further enabling manufacturers to meet growing retail and foodservice demand.
Key players operating in the Global Aluminum Cans Market include Ball Corporation, Crown Holdings, CANPACK, Baixicans, Ajanta Bottle, Ceylon Beverage Can, Albott Containers, GZI Industries, Envases Group, Nampak, Orora Packaging, CCL Industries, Shiba Containers, Silgan Containers, Swan Industries, Scan Holdings, Thai Beverage Can, and Toyo Seikan. Companies in the Global Aluminum Cans Market are strengthening their presence through strategic investments in advanced production facilities and capacity expansions to meet rising demand for beverages. Firms are focusing on lightweight, sustainable, and high-recycling-efficiency packaging solutions to appeal to environmentally conscious consumers. Strategic partnerships with beverage brands and e-commerce distributors are enhancing market penetration and product visibility. Companies are also investing in R&D to innovate 2-piece and specialty cans for functional beverages, while leveraging digital printing and customizable packaging for brand differentiation. Expansion into emerging markets and collaborations with industrial and commercial fluid manufacturers further solidify their competitive positioning, ensuring operational efficiency and long-term market growth.
Table of Contents
Chapter 1 Methodology and Scope
- 1.1 Market scope and definition
- 1.2 Research design
- 1.2.1 Research approach
- 1.2.2 Data collection methods
- 1.3 Data mining sources
- 1.3.1 Global
- 1.3.2 Regional/Country
- 1.4 Base estimates and calculations
- 1.4.1 Base year calculation
- 1.4.2 Key trends for market estimation
- 1.5 Primary research and validation
- 1.5.1 Primary sources
- 1.6 Forecast model
- 1.7 Research assumptions and limitations
Chapter 2 Executive Summary
- 2.1 Industry 360° synopsis, 2022 - 2035
- 2.2 Key market trends
- 2.2.1 Product type trends
- 2.2.2 Capacity trends
- 2.2.3 End-user trends
- 2.2.4 Regional trends
- 2.3 TAM Analysis, 2026-2035
- 2.4 CXO perspectives: Strategic imperatives
Chapter 3 Industry Insights
- 3.1 Industry ecosystem analysis
- 3.1.1 Supplier Landscape
- 3.1.2 Profit Margin
- 3.1.3 Cost structure
- 3.1.4 Value addition at each stage
- 3.1.5 Factor affecting the value chain
- 3.1.6 Disruptions
- 3.2 Industry impact forces
- 3.2.1 Growth drivers
- 3.2.1.1 Strong demand from carbonated soft drinks and beer segments
- 3.2.1.2 Rising consumer preference for recyclable beverage packaging
- 3.2.1.3 High recycling efficiency of aluminum can materials
- 3.2.1.4 Lightweight packaging reducing beverage transportation costs
- 3.2.1.5 Rapid urbanization increasing packaged beverage consumption
- 3.2.2 Industry pitfalls and challenges
- 3.2.2.1 Aluminum price volatility affecting can manufacturing costs
- 3.2.2.2 High electricity consumption in aluminum smelting processes
- 3.2.3 Market opportunities
- 3.2.3.1 Expansion of energy drink and functional beverage packaging
- 3.2.3.2 Increasing recycled aluminum content in can manufacturing
- 3.2.1 Growth drivers
- 3.3 Growth potential analysis
- 3.4 Regulatory landscape
- 3.4.1 North America
- 3.4.2 Europe
- 3.4.3 Asia Pacific
- 3.4.4 Latin America
- 3.4.5 Middle East & Africa
- 3.5 Porter's analysis
- 3.6 PESTEL analysis
- 3.7 Technology and Innovation landscape
- 3.7.1 Current technological trends
- 3.7.2 Emerging technologies
- 3.8 Price trends
- 3.8.1 By region
- 3.8.2 By product
- 3.9 Pricing Strategies
- 3.10 Emerging Business Models
- 3.11 Compliance Requirements
- 3.12 Patent and IP analysis
Chapter 4 Competitive Landscape, 2025
- 4.1 Introduction
- 4.2 Company market share analysis
- 4.2.1 By region
- 4.2.1.1 North America
- 4.2.1.2 Europe
- 4.2.1.3 Asia Pacific
- 4.2.1.4 Latin America
- 4.2.1.5 Middle East & Africa
- 4.2.2 Market concentration analysis
- 4.2.1 By region
- 4.3 Competitive benchmarking of key players
- 4.3.1 Financial performance comparison
- 4.3.1.1 Revenue
- 4.3.1.2 Profit margin
- 4.3.1.3 R&D
- 4.3.2 Product portfolio comparison
- 4.3.2.1 Product range breadth
- 4.3.2.2 Technology
- 4.3.2.3 Innovation
- 4.3.3 Geographic presence comparison
- 4.3.3.1 Global footprint analysis
- 4.3.3.2 Service network coverage
- 4.3.3.3 Market penetration by region
- 4.3.4 Competitive positioning matrix
- 4.3.4.1 Leaders
- 4.3.4.2 Challengers
- 4.3.4.3 Followers
- 4.3.4.4 Niche players
- 4.3.5 Strategic outlook matrix
- 4.3.1 Financial performance comparison
- 4.4 Key developments
- 4.4.1 Mergers and acquisitions
- 4.4.2 Partnerships and collaborations
- 4.4.3 Technological advancements
- 4.4.4 Expansion and investment strategies
- 4.4.5 Digital transformation initiatives
- 4.5 Emerging/ startup competitors landscape
Chapter 5 Market Estimates and Forecast, By Product Type, 2022 - 2035 (USD Million)
- 5.1 Key trends
- 5.2 1-piece cans
- 5.3 2-piece cans
- 5.4 3-piece cans
Chapter 6 Market Estimates and Forecast, By Capacity, 2022 - 2035 (USD Million)
- 6.1 Key trends
- 6.2 Up to 200 ml
- 6.3 201 to 450 ml
- 6.4 451 to 700 ml
- 6.5 701 to 1000 ml
- 6.6 More than 1000 ml
Chapter 7 Market Estimates and Forecast, By End-User, 2022 - 2035 (USD Million)
- 7.1 Key trends
- 7.2 Food
- 7.3 Beverage
- 7.4 Personal Care & Cosmetic
- 7.5 Pharmaceutical
- 7.6 Paints & Lubricants
- 7.7 Others
Chapter 8 Market Estimates and Forecast, By Region, 2022 - 2035 (USD Million)
- 8.1 Key trends
- 8.2 North America
- 8.2.1 U.S.
- 8.2.2 Canada
- 8.3 Europe
- 8.3.1 Germany
- 8.3.2 UK
- 8.3.3 France
- 8.3.4 Spain
- 8.3.5 Italy
- 8.3.6 Netherlands
- 8.4 Asia Pacific
- 8.4.1 China
- 8.4.2 India
- 8.4.3 Japan
- 8.4.4 Australia
- 8.4.5 South Korea
- 8.5 Latin America
- 8.5.1 Brazil
- 8.5.2 Mexico
- 8.5.3 Argentina
- 8.6 Middle East and Africa
- 8.6.1 South Africa
- 8.6.2 Saudi Arabia
- 8.6.3 UAE
Chapter 9 Company Profiles
- 9.1 Global Key Players
- 9.1.1 Ball Corporation
- 9.1.2 Crown Holdings
- 9.1.3 CANPACK
- 9.1.4 Toyo Seikan
- 9.1.5 Envases Group
- 9.2 Regional key players
- 9.2.1 North America
- 9.2.1.1 Silgan Containers
- 9.2.1.2 CCL Industries
- 9.2.1.3 Orora Packaging
- 9.2.2 Asia Pacific
- 9.2.2.1 Thai Beverage Can
- 9.2.2.2 Ceylon Beverage Can
- 9.2.2.3 Shiba Containers
- 9.2.3 Europe
- 9.2.3.1 Baixicans
- 9.2.3.2 Scan Holdings
- 9.2.1 North America
- 9.3 Niche Players/Disruptors
- 9.3.1 Ajanta Bottle
- 9.3.2 Albott Containers
- 9.3.3 GZI Industries
- 9.3.4 Nampak
- 9.3.5 Swan Industries
 鋁罐市場報告:趨勢、預測和競爭分析(至2035年)
 鋁罐市場報告:按應用和地區分類 2026-2034 年
 鋁罐:市場佔有率分析、產業趨勢與統計、成長預測(2026-2031)日本鋁罐市場:規模、佔有率、趨勢和預測:按應用、地區分類,2026-2034年
 罐裝飲料支架市場:按支架類型、容量、材料、最終用途和分銷管道分類,全球預測(2026-2032年)
 鋁罐市場規模、佔有率及成長分析(按產品類型、銷售、最終用途及地區分類)-2026-2033年產業預測
 鋁製單體罐:全球市場佔有率和排名、總收入和需求預測(2025-2031 年)
 杯架市場:按產品類型、按材料、按最終用戶、按分銷管道、按地區
 全球鋁製整體罐市場:2031 年預測
 2030 年罐架市場預測:按產品、材料、產能、設計風格、分銷管道、最終用戶和地區進行全球分析