


 |
市場調查報告書
商品編碼
1998853
行人偵測系統市場:商業機會、成長要素、產業趨勢分析及 2026-2035 年預測。Pedestrian Detection System Market Opportunity, Growth Drivers, Industry Trend Analysis, and Forecast 2026 - 2035 |
||||||
2025 年全球行人偵測系統市場價值為 96 億美元,預計到 2035 年將達到 427 億美元,年複合成長率為 16.4%。
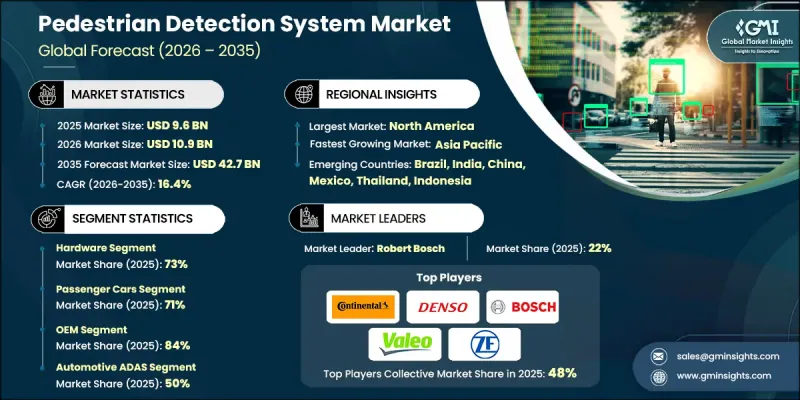
隨著汽車製造商日益重視道路安全和預防事故技術,這個市場正蓬勃發展。行人偵測系統在現代車輛安全架構中扮演著至關重要的角色,能夠即時識別行人和其他弱勢道路使用者。這些系統依賴先進的感測技術,例如視覺攝影機、雷達、LiDAR、紅外線感測器以及人工智慧 (AI)影像處理,來偵測車輛周圍的人員移動。當偵測到碰撞風險時,系統可以向駕駛發出警告,或自動煞車以減輕碰撞衝擊或完全避免事故發生。人們對智慧駕駛輔助技術的日益關注正在加速其在多個車型領域的應用。此外,全球監管機構和安全機構正在收緊車輛安全標準,敦促製造商在新車中加入行人保護功能。基於人工智慧的感知軟體、感測器融合和高效能運算平台的持續創新,進一步提升了系統在複雜交通環境中的準確性、可靠性和反應速度。隨著都市化進程的推進和交通密度的增加,對先進行人保護解決方案的需求預計將穩定成長,從而推動行人偵測系統產業的長期擴張。
| 市場範圍 | |
|---|---|
| 開始年份 | 2025 |
| 預測期 | 2026-2035 |
| 上市時的市場規模 | 96億美元 |
| 預測金額 | 427億美元 |
| 複合年成長率 | 16.4% |
預計到2025年,硬體部分將佔據73%的市場佔有率,並在2026年至2035年間以16.5%的複合年成長率成長。該部分涵蓋了廣泛的感測技術,例如攝影機系統、雷達模組、雷射雷達感測器、紅外線探測器、超音波感測器以及專用處理單元,這些技術能夠實現即時感知和決策。在這些組件中,先進的處理硬體在支援用於目標識別、分類和運動預測的複雜演算法方面發揮著至關重要的作用。汽車人工智慧處理器和電控系統(ECU)約佔硬體部分價值的18%,並且正在快速發展以滿足深度學習模型和多感測器融合平台日益成長的運算需求。隨著製造商不斷提高檢測精度和響應速度,整個汽車行業對先進硬體解決方案的需求仍然強勁。
預計到2025年,乘用車市佔率將達到71%,並有望在2026年至2035年間以16.5%的複合年成長率成長。此細分市場的擴張主要受監管要求和消費者安全評估項目的推動,這些項目強調行人緊急煞車功能和對弱勢道路使用者的保護。汽車製造商正擴大將行人偵測技術作為標準安全配置應用於各種乘用車。消費者對車輛安全的日益關注,以及政府更嚴格的指導方針,促使製造商在其車輛(從入門級到高階乘用車)中配備更先進的駕駛輔助功能。
美國行人偵測系統市場預計將在2026年至2035年間以16.3%的複合年成長率成長。健全的法規結構和積極的車輛安全標準執行力度正顯著加速高級駕駛輔助系統(ADAS)的普及。國家安全計畫和聯邦交通舉措鼓勵汽車製造商為車輛配備行人偵測系統,以適應各種交通環境。美國汽車製造商正大力投資研發、模擬測試和現場檢驗,以確保系統在包括人口密集都市區和高速公路網路在內的複雜交通場景中可靠運作。技術創新、強大的汽車製造基礎以及消費者對先進安全功能日益成長的需求,進一步鞏固了美國市場的地位。
目錄
第1章:調查方法
第2章執行摘要
第3章業界考察
- 生態系分析
- 供應商情況
- 利潤率分析
- 成本結構
- 每個階段增加的價值
- 影響價值鏈的因素
- 中斷
- 影響產業的因素
- 促進因素
- 行人死亡人數增加,引發人們對交通安全的擔憂
- 嚴格的政府法規和強制性ADAS要求
- 消費者對車輛安全功能的意識和需求不斷提高
- 人工智慧和機器學習的技術進步
- 自動駕駛和半自動駕駛車輛的廣泛應用
- 配備安全功能的車輛可享保險費優惠
- 產業潛在風險與挑戰
- 高昂的初始系統成本和經濟實惠的實施障礙
- 在惡劣天氣和低光源條件下性能受限
- 對假陽性率和系統可靠性的擔憂
- 複雜的安裝和整合要求
- 市場機遇
- 隨著汽車生產的擴張,新興市場正在取得成長。
- 現有車隊進行售後改裝的潛力
- 與智慧城市基礎設施和物聯網生態系統的融合
- 跨產業應用(工業車輛、施工機械)
- 邊緣運算與設備內人工智慧處理技術的進步
- 促進因素
- 成長潛力分析
- 監理情勢
- 北美洲
- 美國聯邦安全標準與ADAS實施指南
- 加拿大 - 連網和自動駕駛汽車安全框架 (CASF)
- 歐洲
- 德國 - Euro NCAP 和 IIHS 測試通訊協定
- 英國-脫歐後ADAS的柔軟性
- 法國——國家ADAS測試和智慧交通系統戰略
- 義大利——智慧交通系統試點計畫和智慧基礎設施
- 亞太地區
- 中國——工信部關於C-V2X的法規和標準
- 印度—ADAS和汽車互聯的新法規
- 日本——智慧交通系統連結性與頻率政策
- 澳洲—技術中立的智慧交通系統政策
- 拉丁美洲
- 墨西哥 - NOM 汽車安全標準
- 阿根廷 - 交通法第 24.449 號
- 中東和非洲
- 南非 - 道路交通法(1996 年)
- 沙烏地阿拉伯—「2030願景」下的交通運輸法律與交通運輸舉措
- 北美洲
- 波特五力分析
- PESTEL 分析
- 科技與創新趨勢
- 當前技術趨勢
- 電腦視覺和影像處理技術的進步
- 深度學習與神經網路的融合
- 新興技術
- 感測器融合技術的演進
- 即時處理和邊緣運算
- V2X通訊的整合
- 當前技術趨勢
- 3.5 專利趨勢(基於初步調查)
- 主要技術專利叢集
- 領先的專利擁有者和創新領導者
- 專利申請趨勢(2019-2025)
- 新興專利領域與未開發領域的分析
- 成本細分分析
- 價格分析(基於初步調查)
- 對過去價格趨勢的分析
- 按業務類型分類的定價策略(高階、超值、成本加成)
- 原廠配件和售後配件之間的價格差異
- 各地區價格波動
- 貿易數據分析(基於付費資料庫)
- 進出口數量和價值的變化趨勢
- 主要貿易走廊及關稅的影響
- 各地區貿易流量趨勢
- 人工智慧和生成式人工智慧對市場的影響
- 利用人工智慧改造現有經營模式
- GenAI 各細分市場的應用案例與實施藍圖
- 風險、局限性和監管考量
- 使用案例和成功案例
- 永續性和環境方面
- 永續計劃
- 減少廢棄物策略
- 生產中的能源效率
- 環保意識的舉措
- 關於碳足跡的考量
- 基礎設施和實施情況(基於初步調查)
- 按地區和購買者群體分類的採用率和滲透率
- 基礎設施投資的可擴展性限制和趨勢
- 預測假設和情境分析(基於初步研究)
- 基本案例-驅動複合年成長率的關鍵宏觀經濟與產業變量
- 樂觀情境-宏觀經濟與產業的順風
- 悲觀情景-宏觀經濟放緩或產業逆風
第4章 競爭情勢
- 介紹
- 企業市佔率分析
- 北美洲
- 歐洲
- 亞太地區
- 拉丁美洲
- 中東和非洲(MEA)
- 主要市場公司的競爭分析
- 競爭定位矩陣
- 企業級分層基準測試
- 層級分類標準與選擇標準
- 按收入、地區和創新能力分類的層級定位矩陣。
- 主要進展
- 併購
- 夥伴關係和聯盟
- 新產品發布
- 業務拓展計劃及資金籌措
第5章 市場估計與預測:依組件分類,2022-2035年
- 硬體
- 相機
- 感測器(超音波、紅外線、LiDAR、雷達)
- 控制單元
- 其他
- 軟體
- 檢測演算法
- 資料處理軟體
- 其他
第6章 市場估計與預測:依技術分類,2022-2035年
- 基於視覺的系統
- 感測器融合系統
- 紅外線系統
- 超音波系統
- 混合系統
第7章 市場估價與預測:依車輛類型分類,2022-2035年
- 搭乘用車
- 掀背車
- 轎車
- SUV
- 商用車輛
- 輕型商用車(LCV)
- 中型商用車(MCV)
- 重型商用車(HCV)
第8章 市場估算與預測:依通路分類,2022-2035年
- OEM
- 售後市場
第9章 市場估計與預測:依應用領域分類,2022-2035年
- 汽車高級駕駛輔助系統(ADAS)
- 交通管理
- 監測和安全監測
- 其他
第10章 市場估價與預測:依地區分類,2022-2035年
- 北美洲
- 美國
- 加拿大
- 歐洲
- 德國
- 英國
- 法國
- 義大利
- 西班牙
- 俄羅斯
- 荷蘭
- 瑞典
- 丹麥
- 波蘭
- 亞太地區
- 中國
- 印度
- 日本
- 澳洲
- 韓國
- 新加坡
- 泰國
- 印尼
- 越南
- 拉丁美洲
- 巴西
- 墨西哥
- 阿根廷
- 哥倫比亞
- 中東和非洲(MEA)
- 南非
- 沙烏地阿拉伯
- 阿拉伯聯合大公國
- 以色列
第11章:公司簡介
- 世界公司
- Aptiv
- Autoliv
- Continental
- Denso
- Intel
- NVIDIA
- NXP Semiconductors
- Robert Bosch
- Valeo
- ZF Friedrichshafen
- 本地球員
- HELLA
- Hyundai Mobis
- Magna International
- Mobileye
- Veoneer
- 新興企業和技術基礎設施公司
- AEye
- Innoviz Technologies
- Luminar Technologies
- Ouster
- Perceptive Automata
The Global Pedestrian Detection System Market was valued at USD 9.6 billion in 2025 and is estimated to grow at a CAGR of 16.4% to reach USD 42.7 billion by 2035.
The market is gaining significant momentum as vehicle manufacturers increasingly prioritize road safety and accident prevention technologies. Pedestrian detection systems play a critical role in modern vehicle safety architectures by enabling real-time identification of pedestrians and other vulnerable road users. These systems rely on advanced sensing technologies such as vision cameras, radar, LiDAR, infrared sensors, and artificial intelligence-driven image processing to detect human movement near vehicles. Once a potential collision risk is identified, the system can alert drivers or automatically initiate braking to reduce impact severity or avoid accidents. The growing emphasis on intelligent driver assistance technologies is accelerating adoption across multiple vehicle segments. Additionally, regulatory authorities and safety organizations worldwide are strengthening vehicle safety standards, encouraging manufacturers to integrate pedestrian protection features into new vehicles. Continuous innovation in AI-based perception software, sensor fusion, and high-performance computing platforms is further improving system accuracy, reliability, and responsiveness in complex traffic environments. As urbanization increases and traffic density rises, the need for advanced pedestrian protection solutions is expected to grow steadily, driving long-term expansion of the pedestrian detection system industry.
| Market Scope | |
|---|---|
| Start Year | 2025 |
| Forecast Year | 2026-2035 |
| Start Value | $9.6 Billion |
| Forecast Value | $42.7 Billion |
| CAGR | 16.4% |
The hardware segment accounted for 73% share in 2025 and is anticipated to grow at a CAGR of 16.5% between 2026 and 2035. This segment includes a wide range of sensing technologies such as camera systems, radar modules, LiDAR sensors, infrared detection devices, ultrasonic sensors, and dedicated processing units that enable real-time perception and decision-making. Among these components, advanced processing hardware plays a critical role by supporting complex algorithms used for object recognition, classification, and motion prediction. Automotive-grade AI processors and electronic control units represent approximately 18% of the hardware segment value and are evolving rapidly to meet the increasing computational requirements of deep learning models and multi-sensor fusion platforms. As manufacturers continue to improve detection accuracy and response times, demand for advanced hardware solutions remains strong across the automotive industry.
The passenger cars segment held a 71% share in 2025 and is expected to grow at a CAGR of 16.5% throughout 2026-2035. The expansion of this segment is largely influenced by regulatory requirements and consumer safety evaluation programs that emphasize pedestrian automatic emergency braking performance and protection of vulnerable road users. Automakers are increasingly integrating pedestrian detection technologies as standard safety features across a wide range of passenger vehicles. Growing consumer awareness regarding vehicle safety, combined with stricter government guidelines, is encouraging manufacturers to incorporate more advanced driver assistance capabilities in both entry-level and premium passenger vehicles.
United States Pedestrian Detection System Market is projected to grow at a CAGR of 16.3% between 2026 and 2035. Strong regulatory frameworks and active enforcement of vehicle safety standards have significantly accelerated the adoption of advanced driver assistance technologies. National safety programs and federal transportation initiatives are encouraging automakers to incorporate pedestrian detection systems in vehicles operating across various traffic environments. Automotive manufacturers in the country are investing heavily in research, simulation testing, and real-world validation to ensure reliable system performance in complex traffic scenarios, including dense urban areas and high-speed road networks. The combination of technological innovation, strong automotive manufacturing presence, and increasing consumer demand for advanced safety features continues to strengthen the market position of the United States.
Key players operating in the Global Pedestrian Detection System Market include Aptiv, Autoliv, Continental, Denso, Magna, Mobileye, NVIDIA, Robert Bosch, Valeo, and ZF Friedrichshafen. Companies operating in the Pedestrian Detection System Market are adopting several strategies to strengthen their market position and expand technological capabilities. Key players are investing heavily in research and development to improve sensor accuracy, AI perception algorithms, and multi-sensor fusion technologies that enhance detection reliability in challenging environments. Strategic partnerships with automotive manufacturers allow technology providers to integrate pedestrian detection systems directly into vehicle platforms during early design stages. Companies are also focusing on expanding product portfolios with advanced processing hardware, high-resolution sensors, and scalable software architectures. Additionally, firms are increasing investments in simulation tools, testing environments, and data analytics to accelerate innovation and system validation.
Table of Contents
Chapter 1 Methodology
- 1.1 Research approach
- 1.2 Quality commitments
- 1.3 Research trail and confidence scoring
- 1.3.1 Research trail components
- 1.3.2 Scoring components
- 1.4 Data collection
- 1.4.1 Partial list of primary sources
- 1.5 Data mining sources
- 1.5.1 Paid sources
- 1.6 Best estimates and calculations
- 1.6.1 Base year calculation for any one approach
- 1.7 Forecast model
- 1.8 Research transparency addendum
Chapter 2 Executive Summary
- 2.1 Industry 360° synopsis, 2022 - 2035
- 2.2 Key market trends
- 2.2.1 Regional
- 2.2.2 Components
- 2.2.3 Technology
- 2.2.4 Vehicles
- 2.2.5 Distribution Channel
- 2.2.6 Application
- 2.3 TAM Analysis, 2026-2035
- 2.4 CXO perspectives: Strategic imperatives
Chapter 3 Industry Insights
- 3.1 Industry ecosystem analysis
- 3.1.1 Supplier landscape
- 3.1.2 Profit margin analysis
- 3.1.3 Cost structure
- 3.1.4 Value addition at each stage
- 3.1.5 Factor affecting the value chain
- 3.1.6 Disruptions
- 3.2 Industry impact forces
- 3.2.1 Growth drivers
- 3.2.1.1 Increasing pedestrian fatalities and road safety concerns
- 3.2.1.2 Stringent government regulations and mandatory ADAS requirements
- 3.2.1.3 Rising consumer awareness and demand for vehicle safety features
- 3.2.1.4 Technological advancements in AI and machine learning
- 3.2.1.5 Growing adoption of autonomous and semi-autonomous vehicles
- 3.2.1.6 Insurance premium incentives for safety-equipped vehicles
- 3.2.2 Industry pitfalls and challenges
- 3.2.2.1 High initial system costs and affordability barriers
- 3.2.2.2 Performance limitations in adverse weather and low-light conditions
- 3.2.2.3 False detection rates and system reliability concerns
- 3.2.2.4 Complex installation and integration requirements
- 3.2.3 Market opportunities
- 3.2.3.1 Expansion in emerging markets with growing vehicle production
- 3.2.3.2 Aftermarket retrofitting potential for existing vehicle fleet
- 3.2.3.3 Integration with smart city infrastructure and IoT ecosystems
- 3.2.3.4 Cross-industry applications (industrial vehicles, construction equipment)
- 3.2.3.5 Edge computing and on-device AI processing advancements
- 3.2.1 Growth drivers
- 3.3 Growth potential analysis
- 3.4 Regulatory landscape
- 3.4.1 North America
- 3.4.1.1 US- Federal safety rules & ADAS deployment guidance
- 3.4.1.2 Canada - Safety framework for connected & automated vehicles (CASF)
- 3.4.2 Europe
- 3.4.2.1 Germany- Euro NCAP and IIHS testing protocols
- 3.4.2.2 UK- Post-Brexit ADAS flexibility
- 3.4.2.3 France- National ADAS testing & ITS strategy
- 3.4.2.4 Italy- ITS pilots & smart infrastructure
- 3.4.3 Asia Pacific
- 3.4.3.1 China- MIIT C V2X mandates & standards
- 3.4.3.2 India- Emerging ADAS & automotive connectivity regulations
- 3.4.3.3 Japan- ITS connect & spectrum policy
- 3.4.3.4 Australia- Technology neutral ITS policies
- 3.4.4 LATAM
- 3.4.4.1 Mexico- NOM vehicle safety standards
- 3.4.4.2 Argentina- National traffic law 24.449
- 3.4.5 MEA
- 3.4.5.1 South Africa- National road traffic act (1996)
- 3.4.5.2 Saudi Arabia- Traffic law & vision 2030 transport initiatives
- 3.4.1 North America
- 3.5 Porter's analysis
- 3.6 PESTEL analysis
- 3.7 Technology and innovation landscape
- 3.7.1 Current technological trends
- 3.7.1.1 Computer vision and image processing advancements
- 3.7.1.2 Deep learning and neural network integration
- 3.7.2 Emerging technologies
- 3.7.2.1 Sensor fusion technology evolution
- 3.7.2.2 Real-time processing and edge computing
- 3.7.2.3 V2X communication integration
- 3.7.1 Current technological trends
- 3.8 3.5 Patent landscape (Driven by primary research)
- 3.8.1 Key technology patent clusters
- 3.8.2 Major patent holders and innovation leaders
- 3.8.3 Patent filing trends (2019-2025)
- 3.8.4 Emerging patent areas and white space analysis
- 3.9 Cost breakdown analysis
- 3.10 Pricing analysis (Driven by primary research)
- 3.10.1 Historical price trend analysis
- 3.10.2 Pricing strategy by player type (premium, value, cost-plus)
- 3.10.3 OEM versus aftermarket price differential
- 3.10.4 Regional price variations
- 3.11 Trade data analysis (Driven by paid database)
- 3.11.1 Import and export volume and value trends
- 3.11.2 Key trade corridors and tariff impact
- 3.11.3 Regional trade flow patterns
- 3.12 Impact of AI and generative AI on the market
- 3.12.1 AI-driven disruption of existing business models
- 3.12.2 GenAI use cases and adoption roadmap by segment
- 3.12.3 Risks, limitations, and regulatory considerations
- 3.13 Use cases & success stories
- 3.14 Sustainability and environmental aspects
- 3.14.1 Sustainable practices
- 3.14.2 Waste reduction strategies
- 3.14.3 Energy efficiency in production
- 3.14.4 Eco-friendly Initiatives
- 3.14.5 Carbon footprint considerations
- 3.15 Infrastructure and deployment landscape (Driven by primary research)
- 3.15.1 Deployment penetration by region and buyer segment
- 3.15.2 Scalability constraints and infrastructure investment trends
- 3.16 Forecast assumptions & scenario analysis (Driven by Primary Research)
- 3.16.1 Base Case - key macro & industry variables driving CAGR
- 3.16.2 Optimistic Scenarios - Favorable macro and industry tailwinds
- 3.16.3 Pessimistic Scenario - Macroeconomic slowdown or industry headwinds
Chapter 4 Competitive Landscape, 2025
- 4.1 Introduction
- 4.2 Company market share analysis
- 4.2.1 North America
- 4.2.2 Europe
- 4.2.3 Asia Pacific
- 4.2.4 LATAM
- 4.2.5 MEA
- 4.3 Competitive analysis of major market players
- 4.4 Competitive positioning matrix
- 4.5 Company tier benchmarking
- 4.5.1 Tier classification criteria & qualifying thresholds
- 4.5.2 Tier positioning matrix by revenue, geography & innovation
- 4.6 Key developments
- 4.6.1 Mergers & acquisitions
- 4.6.2 Partnerships & collaborations
- 4.6.3 New product launches
- 4.6.4 Expansion plans and funding
Chapter 5 Market Estimates & Forecast, By Component, 2022 - 2035 ($Bn, Units)
- 5.1 Key trends
- 5.2 Hardware
- 5.2.1 Cameras
- 5.2.2 Sensors (Ultrasonic, Infrared, Lidar, Radar)
- 5.2.3 Control units
- 5.2.4 Others
- 5.3 Software
- 5.3.1 Detection algorithms
- 5.3.2 Data processing software
- 5.3.3 Others
Chapter 6 Market Estimates & Forecast, By Technology, 2022 - 2035 ($Bn, Units)
- 6.1 Key trends
- 6.2 Vision-based systems
- 6.3 Sensor fusion systems
- 6.4 Infrared systems
- 6.5 Ultrasonic systems
- 6.6 Hybrid systems
Chapter 7 Market Estimates & Forecast, By Vehicle, 2022 - 2035 ($Bn, Units)
- 7.1 Key trends
- 7.2 Passenger cars
- 7.2.1 Hatchback
- 7.2.2 Sedan
- 7.2.3 SUV
- 7.3 Commercial vehicles
- 7.3.1 Light commercial vehicles (LCVs)
- 7.3.2 Medium commercial vehicles (MCVs)
- 7.3.3 Heavy commercial vehicles (HCVs)
Chapter 8 Market Estimates & Forecast, By Distribution Channel, 2022 - 2035 ($Bn, Units)
- 8.1 Key trends
- 8.2 OEM
- 8.3 Aftermarket
Chapter 9 Market Estimates & Forecast, By Application, 2022 - 2035 ($Bn, Units)
- 9.1 Key trends
- 9.2 Automotive ADAS
- 9.3 Traffic management
- 9.4 Surveillance & safety monitoring
- 9.5 Others
Chapter 10 Market Estimates & Forecast, By Region, 2022 - 2035 ($Bn, Units)
- 10.1 Key trends
- 10.2 North America
- 10.2.1 US
- 10.2.2 Canada
- 10.3 Europe
- 10.3.1 Germany
- 10.3.2 UK
- 10.3.3 France
- 10.3.4 Italy
- 10.3.5 Spain
- 10.3.6 Russia
- 10.3.7 Netherlands
- 10.3.8 Sweden
- 10.3.9 Denmark
- 10.3.10 Poland
- 10.4 Asia Pacific
- 10.4.1 China
- 10.4.2 India
- 10.4.3 Japan
- 10.4.4 Australia
- 10.4.5 South Korea
- 10.4.6 Singapore
- 10.4.7 Thailand
- 10.4.8 Indonesia
- 10.4.9 Vietnam
- 10.5 Latin America
- 10.5.1 Brazil
- 10.5.2 Mexico
- 10.5.3 Argentina
- 10.5.4 Colombia
- 10.6 MEA
- 10.6.1 South Africa
- 10.6.2 Saudi Arabia
- 10.6.3 UAE
- 10.6.4 Israel
Chapter 11 Company Profiles
- 11.1 Global Players
- 11.1.1 Aptiv
- 11.1.2 Autoliv
- 11.1.3 Continental
- 11.1.4 Denso
- 11.1.5 Intel
- 11.1.6 NVIDIA
- 11.1.7 NXP Semiconductors
- 11.1.8 Robert Bosch
- 11.1.9 Valeo
- 11.1.10 ZF Friedrichshafen
- 11.2 Regional Players
- 11.2.1 HELLA
- 11.2.2 Hyundai Mobis
- 11.2.3 Magna International
- 11.2.4 Mobileye
- 11.2.5 Veoneer
- 11.3 Emerging Players & Technology Enablers
- 11.3.1 AEye
- 11.3.2 Innoviz Technologies
- 11.3.3 Luminar Technologies
- 11.3.4 Ouster
- 11.3.5 Perceptive Automata
 全球汽車行人保護系統市場
 車輛和行人通訊市場:2026年至2032年全球市場預測(按通訊技術、組件類型、部署模式、網路類型、行人用設備類型、應用和最終用戶分類)
 2026-2034年全球汽車行人保護系統市場規模、佔有率、趨勢和成長分析報告
 2026年全球行人保護氣囊市場報告2026年全球行人偵測系統市場報告全球行人偵測系統市場規模、佔有率、趨勢和成長分析報告(2026-2034年)汽車行人保護系統市場:依行人偵測技術、系統類型、ADAS等級、車輛類型和通路分類-2026-2032年全球預測
 汽車行人保護系統市場:市場機會、成長要素、產業趨勢分析及2026-2035年預測
 汽車行人保護系統市場規模、佔有率及成長分析(依技術、組件類型、類型及地區分類)-2026-2033年產業預測
 行人偵測系統市場-全球產業規模、佔有率、趨勢、機會和預測,按類型(視訊、紅外線、混合、其他類型)、按組件(感測器、攝影機、雷達、其他)、按地區和競爭情況細分,2020 年至 2030 年