


 |
市場調查報告書
商品編碼
1998836
軟性飲料包裝市場機會、成長促進因素、產業趨勢分析及預測(2026-2035年)Soft Drinks Packaging Market Opportunity, Growth Drivers, Industry Trend Analysis, and Forecast 2026 - 2035 |
||||||
2025年全球軟性飲料包裝市場規模預估為534億美元,預估至2035年將達754億美元,年複合成長率為3.6%。
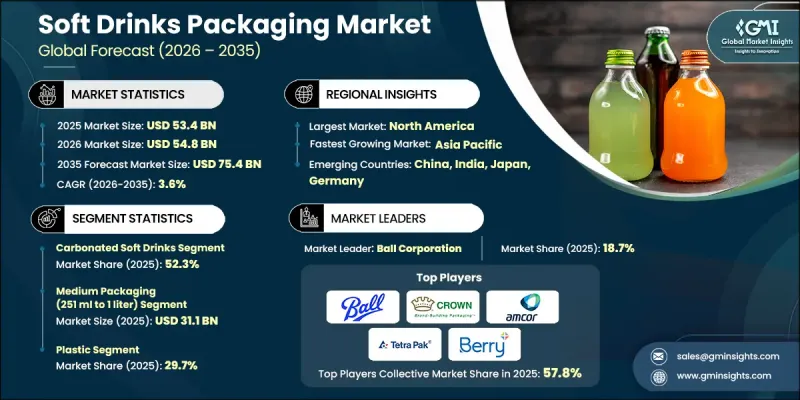
亞太地區碳酸飲料消費量的成長、高階飲料形式的日益普及以及鋁罐產能的提升是推動市場擴張的主要因素。其他因素包括消費者對便利單份包裝的偏好,以及歐洲和北美地區關於回收材料和循環包裝法規的推出。隨著人們對永續包裝的日益關注,原料籌資策略正在轉變,而引人注目的裝飾性印刷和獨特的罐體設計則有助於品牌差異化。這一趨勢在疫情後的經濟復甦時期得到進一步加強,持續推動優質化、提升銷售點的品牌曝光度,並促進面向小眾消費群體的小批量和限量版飲料的生產。
| 市場範圍 | |
|---|---|
| 開始年份 | 2025 |
| 預測期 | 2026-2035 |
| 起始金額 | 534億美元 |
| 預測金額 | 754億美元 |
| 複合年成長率 | 3.6% |
預計到2025年,碳酸飲料市佔率將達到52.3%。該領域的領先地位主要得益於消費者對輕質、可回收且能承受碳酸化壓力的包裝的需求。碳酸飲料和可樂的廣泛消費持續支撐著寶特瓶和鋁罐的需求。製造商正致力於將耐用性、抗壓性和永續性相結合,這有助於該領域在已開發市場和新興市場保持主導地位。
預計到2025年,251毫升至1公升的中容量包裝市場規模將達311億美元。此容量規格兼具便攜性和成本績效,既適合單次飲用,也適用於各種場合。與寶特瓶和鋁罐的兼容性確保了飲料品牌的高效生產和穩定的供應,使其在零售、超級市場和餐飲服務管道中越來越受歡迎。
預計到2025年,北美軟性飲料包裝市佔率將達到35.3%。該地區的成長主要得益於對鋁罐的強勁需求、對再生材料含量相關法規的遵守以及碳酸飲料消費的穩定。該地區的鋁罐回收率仍然很高,使其成為永續性品牌的理想選擇。儘管美國和墨西哥對國內鋁罐生產的投資正在增強供應穩定性,但由於監管要求和企業的永續性,對寶特瓶的需求仍然強勁。
目錄
第1章:調查方法和範圍
第2章執行摘要
第3章業界考察
- 產業生態系分析
- 供應商情況
- 利潤率
- 成本結構
- 每個階段增加的價值
- 影響價值鏈的因素
- 中斷
- 影響產業的因素
- 成長促進因素
- 亞太地區碳酸飲料消費量增加
- 過渡到輕質寶特瓶
- 單份便攜包裝的成長
- 擴大全球鋁罐產能
- 電子商務對二次包裝的需求
- 產業潛在風險與挑戰
- 樹脂和鋁價格劇烈波動
- 新興國家缺乏回收基礎設施
- 市場機遇
- 開發100%可回收的單一材料包裝
- 智慧包裝,整合QR碼溯源功能
- 成長促進因素
- 成長潛力分析
- 監理情勢
- 波特五力分析
- PESTEL 分析
- 科技與創新趨勢
- 當前技術趨勢
- 新興技術
- 價格趨勢
- 按地區
- 依產品
- 定價策略
- 新興經營模式
- 合規要求
- 專利和智慧財產權分析
第4章 競爭情勢
- 介紹
- 企業市佔率分析
- 按地區
- 市場集中度分析
- 主要企業的競爭標竿分析
- 財務績效比較
- 銷售量
- 利潤率
- 研究與發展(R&D)
- 產品系列比較
- 產品線寬度
- 科技
- 創新
- 區域擴張比較
- 全球擴張分析
- 服務網路覆蓋
- 按地區分類的市場滲透率
- 競爭定位矩陣
- 領導者
- 挑戰者
- 追蹤者
- 小眾玩家
- 戰略展望矩陣
- 財務績效比較
- 主要進展
- 併購
- 夥伴關係與合作
- 技術進步
- 業務拓展與投資策略
- 數位轉型計劃
- 新興/Start-Ups競爭對手的發展趨勢
第5章 市場估計與預測:依材料分類,2022-2035年
- 塑膠
- 玻璃
- 金屬
- 紙張和紙板
- 其他
第6章 市場估算與預測:依產品類型分類,2022-2035年
- 瓶子
- 能
- 紙箱
- 小袋
- 其他
第7章 市場估計與預測:依產能分類,2022-2035年
- 小容量包裝(250毫升或以下)
- 中等包裝(251毫升至1公升)
- 大容量包裝(超過1公升)
第8章 市場估算與預測:以軟性飲料類型分類,2022-2035年
- 碳酸飲料
- 非碳酸軟性飲料
第9章 市場估計與預測:依地區分類,2022-2035年
- 北美洲
- 美國
- 加拿大
- 歐洲
- 德國
- 英國
- 法國
- 西班牙
- 義大利
- 荷蘭
- 亞太地區
- 中國
- 印度
- 日本
- 澳洲
- 韓國
- 拉丁美洲
- 巴西
- 墨西哥
- 阿根廷
- 中東和非洲
- 南非
- 沙烏地阿拉伯
- 阿拉伯聯合大公國
第10章:公司簡介
- 主要企業
- Amcor Limited
- Ball Corporation
- Crown Holdings, Inc.
- Berry Global Group, Inc.
- Tetra Pak International SA
- SIG
- 該地區的主要企業
- 北美洲
- AptarGroup
- Graham Packaging Company
- Silgan Holdings Inc.
- WestRock Company
- Plastipak Holdings, Inc.
- 亞太地區
- CPMC Holdings Limited
- Visy Industries
- 歐洲
- Ardagh Group
- Smurfit Kappa
- CAN-PACK SA
- 北美洲
- 特殊玩家/干擾者
- Novelis Inc.
- Graphic Packaging International, LLC
The Global Soft Drinks Packaging Market was valued at USD 53.4 billion in 2025 and is estimated to grow at a CAGR of 3.6% to reach USD 75.4 billion by 2035.
The market's expansion is fueled by rising carbonated beverage consumption in the Asia-Pacific region, increasing adoption of premium beverage formats, and growing production capacity for aluminum cans. Additional drivers include consumer preference for convenient single-serve packaging and the implementation of recycled-content and circular packaging mandates across Europe and North America. The growing focus on sustainable packaging is reshaping material sourcing strategies, while high-impact decorative printing and specialty can designs enable brand differentiation. This trend, which intensified following the post-pandemic recovery, continues to support premiumization, improved point-of-sale visibility, and the ability to produce short-run and limited-edition beverages for niche consumer segments.
| Market Scope | |
|---|---|
| Start Year | 2025 |
| Forecast Year | 2026-2035 |
| Start Value | $53.4 Billion |
| Forecast Value | $75.4 Billion |
| CAGR | 3.6% |
The carbonated soft drinks segment held 52.3% share in 2025. The segment's dominance is driven by the need for packaging that withstands carbonation pressure while remaining lightweight and recyclable. The widespread consumption of sparkling beverages and colas ensures sustained demand for both PET bottles and aluminum cans. Manufacturers focus on combining durability, pressure resistance, and sustainability features, maintaining the segment's leading position across both developed and emerging markets.
The medium-sized packaging, ranging from 251 ml to 1 liter, segment generated USD 31.1 billion in 2025. This format offers a balance of portability and value, making it suitable for single-serve consumption as well as multi-occasion use. Its compatibility with PET bottles and aluminum cans ensures strong production efficiency and reliable supply to high-volume beverage brands, reinforcing its popularity across retail, supermarket, and foodservice channels.
North America Soft Drinks Packaging Market accounted for 35.3% share in 2025. Growth in the region is supported by strong demand for aluminum cans, the requirement to meet recycled-content mandates, and consistent consumption of carbonated beverages. Aluminum cans remain highly recycled in the region, making them a preferred choice for brands committed to sustainability. Investments in domestic aluminum can production across the U.S. and Mexico have strengthened supply security, while PET bottle demand remains steady due to regulatory mandates and corporate sustainability initiatives.
Key players in the Global Soft Drinks Packaging Market include Amcor Limited, AptarGroup, Ardagh Group, Ball Corporation, Berry Global Group, Inc., CAN-PACK SA, CPMC Holdings Limited, Crown Holdings, Inc., Graham Packaging Company, Graphic Packaging International, LLC, Novelis Inc., Plastipak Holdings, Inc., SIG, Silgan Holdings Inc., Smurfit Kappa, Tetra Pak International S.A., Visy Industries, and WestRock Company. Companies in the Global Soft Drinks Packaging Market are pursuing multiple strategies to strengthen their market presence and competitive positioning. They are investing in sustainable materials and lightweight packaging to comply with recycled-content mandates and reduce environmental impact. Expansion of production capacity and modernization of canning and bottling lines ensure that supply keeps pace with rising demand. Firms are collaborating with beverage brands to offer customized packaging, specialty printing, and limited-edition designs to enhance shelf visibility and brand engagement. Adoption of digital printing technologies and premium finishing techniques allows companies to differentiate products while catering to single-serve and multi-occasion consumption trends.
Table of Contents
Chapter 1 Methodology and Scope
- 1.1 Market scope and definition
- 1.2 Research design
- 1.2.1 Research approach
- 1.2.2 Data collection methods
- 1.3 Data mining sources
- 1.3.1 Global
- 1.3.2 Regional/Country
- 1.4 Base estimates and calculations
- 1.4.1 Base year calculation
- 1.4.2 Key trends for market estimation
- 1.5 Primary research and validation
- 1.5.1 Primary sources
- 1.6 Forecast model
- 1.7 Research assumptions and limitations
Chapter 2 Executive Summary
- 2.1 Industry 360° synopsis, 2022 - 2035
- 2.2 Key market trends
- 2.2.1 Material trends
- 2.2.2 Product type trends
- 2.2.3 Capacity trends
- 2.2.4 Soft drink type trends
- 2.2.5 Regional trends
- 2.3 TAM Analysis, 2026-2035
- 2.4 CXO perspectives: Strategic imperatives
Chapter 3 Industry Insights
- 3.1 Industry ecosystem analysis
- 3.1.1 Supplier Landscape
- 3.1.2 Profit Margin
- 3.1.3 Cost structure
- 3.1.4 Value addition at each stage
- 3.1.5 Factor affecting the value chain
- 3.1.6 Disruptions
- 3.2 Industry impact forces
- 3.2.1 Growth drivers
- 3.2.1.1 Rising carbonated beverage consumption in Asia-Pacific
- 3.2.1.2 Shift toward lightweight PET bottle formats
- 3.2.1.3 Growth of single-serve, on-the-go packaging
- 3.2.1.4 Expansion of aluminum can capacity globally
- 3.2.1.5 E-commerce-ready secondary packaging demand
- 3.2.2 Industry pitfalls and challenges
- 3.2.2.1 Volatile resin and aluminum price fluctuations
- 3.2.2.2 Recycling infrastructure gaps in emerging economies
- 3.2.3 Market opportunities
- 3.2.3.1 100% recyclable mono-material packaging development
- 3.2.3.2 Smart packaging with QR traceability integration
- 3.2.1 Growth drivers
- 3.3 Growth potential analysis
- 3.4 Regulatory landscape
- 3.4.1 North America
- 3.4.2 Europe
- 3.4.3 Asia Pacific
- 3.4.4 Latin America
- 3.4.5 Middle East & Africa
- 3.5 Porter's analysis
- 3.6 PESTEL analysis
- 3.7 Technology and Innovation landscape
- 3.7.1 Current technological trends
- 3.7.2 Emerging technologies
- 3.8 Price trends
- 3.8.1 By region
- 3.8.2 By product
- 3.9 Pricing Strategies
- 3.10 Emerging Business Models
- 3.11 Compliance Requirements
- 3.12 Patent and IP analysis
Chapter 4 Competitive Landscape, 2025
- 4.1 Introduction
- 4.2 Company market share analysis
- 4.2.1 By region
- 4.2.1.1 North America
- 4.2.1.2 Europe
- 4.2.1.3 Asia Pacific
- 4.2.1.4 Latin America
- 4.2.1.5 Middle East & Africa
- 4.2.2 Market concentration analysis
- 4.2.1 By region
- 4.3 Competitive benchmarking of key players
- 4.3.1 Financial performance comparison
- 4.3.1.1 Revenue
- 4.3.1.2 Profit margin
- 4.3.1.3 R&D
- 4.3.2 Product portfolio comparison
- 4.3.2.1 Product range breadth
- 4.3.2.2 Technology
- 4.3.2.3 Innovation
- 4.3.3 Geographic presence comparison
- 4.3.3.1 Global footprint analysis
- 4.3.3.2 Service network coverage
- 4.3.3.3 Market penetration by region
- 4.3.4 Competitive positioning matrix
- 4.3.4.1 Leaders
- 4.3.4.2 Challengers
- 4.3.4.3 Followers
- 4.3.4.4 Niche players
- 4.3.5 Strategic outlook matrix
- 4.3.1 Financial performance comparison
- 4.4 Key developments
- 4.4.1 Mergers and acquisitions
- 4.4.2 Partnerships and collaborations
- 4.4.3 Technological advancements
- 4.4.4 Expansion and investment strategies
- 4.4.5 Digital transformation initiatives
- 4.5 Emerging/ startup competitors landscape
Chapter 5 Market Estimates and Forecast, By Material, 2022 - 2035 (USD Million)
- 5.1 Key trends
- 5.2 Plastic
- 5.3 Glass
- 5.4 Metal
- 5.5 Paper & paperboard
- 5.6 Others
Chapter 6 Market Estimates and Forecast, By Product Type, 2022 - 2035 (USD Million)
- 6.1 Key trends
- 6.2 Bottles
- 6.3 Cans
- 6.4 Cartons
- 6.5 Pouches
- 6.6 Others
Chapter 7 Market Estimates and Forecast, By Capacity, 2022 - 2035 (USD Million)
- 7.1 Key trends
- 7.2 Small packaging (up to 250 ml)
- 7.3 Medium packaging (251 ml to 1 liter)
- 7.4 Large packaging (above 1 liter)
Chapter 8 Market Estimates and Forecast, By Soft Drink Type, 2022 - 2035 (USD Million)
- 8.1 Key trends
- 8.2 Carbonated soft drinks
- 8.3 Non-carbonated soft drinks
Chapter 9 Market Estimates and Forecast, By Region, 2022 - 2035 (USD Million)
- 9.1 Key trends
- 9.2 North America
- 9.2.1 U.S.
- 9.2.2 Canada
- 9.3 Europe
- 9.3.1 Germany
- 9.3.2 UK
- 9.3.3 France
- 9.3.4 Spain
- 9.3.5 Italy
- 9.3.6 Netherlands
- 9.4 Asia Pacific
- 9.4.1 China
- 9.4.2 India
- 9.4.3 Japan
- 9.4.4 Australia
- 9.4.5 South Korea
- 9.5 Latin America
- 9.5.1 Brazil
- 9.5.2 Mexico
- 9.5.3 Argentina
- 9.6 Middle East and Africa
- 9.6.1 South Africa
- 9.6.2 Saudi Arabia
- 9.6.3 UAE
Chapter 10 Company Profiles
- 10.1 Global Key Players
- 10.1.1 Amcor Limited
- 10.1.2 Ball Corporation
- 10.1.3 Crown Holdings, Inc.
- 10.1.4 Berry Global Group, Inc.
- 10.1.5 Tetra Pak International S.A
- 10.1.6 SIG
- 10.2 Regional key players
- 10.2.1 North America
- 10.2.1.1 AptarGroup
- 10.2.1.2 Graham Packaging Company
- 10.2.1.3 Silgan Holdings Inc.
- 10.2.1.4 WestRock Company
- 10.2.1.5 Plastipak Holdings, Inc.
- 10.2.2 Asia Pacific
- 10.2.2.1 CPMC Holdings Limited
- 10.2.2.2 Visy Industries
- 10.2.3 Europe
- 10.2.3.1 Ardagh Group
- 10.2.3.2 Smurfit Kappa
- 10.2.3.3 CAN-PACK SA
- 10.2.1 North America
- 10.3 Niche Players/Disruptors
- 10.3.1 Novelis Inc.
- 10.3.2 Graphic Packaging International, LLC

