


 |
市場調查報告書
商品編碼
1998826
工業標籤市場:商機、成長要素、產業趨勢分析及2026-2035年預測Industrial Labels Market Opportunity, Growth Drivers, Industry Trend Analysis, and Forecast 2026 - 2035 |
||||||
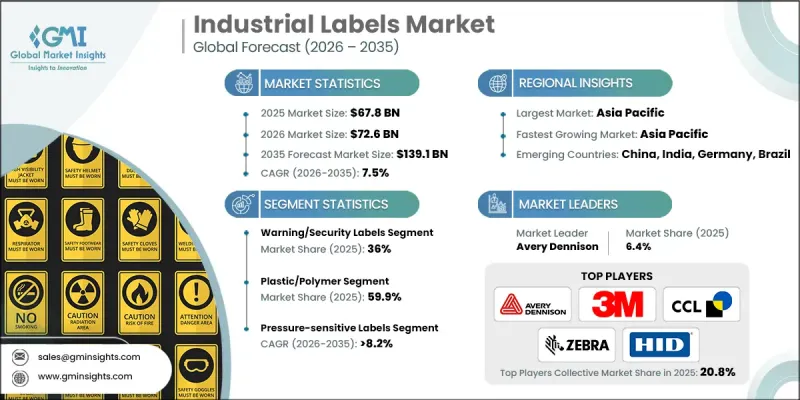
2025年全球工業標籤市場價值為678億美元,預計2035年將以7.5%的複合年成長率成長至1,391億美元。
工業標籤產業的成長主要受以下因素驅動:供應鏈營運透明度需求的不斷提高、對產品安全性的日益重視以及全球各產業部門的擴張。企業也積極採用先進的標籤解決方案,以應對日益嚴重的假冒仿冒品問題,並確保在整個製造和分銷過程中準確識別產品。此外,數位商務和零售物流網路的持續擴張也顯著提升了對高效產品追蹤和貨物識別的需求。企業正擴大採用先進的標籤技術,以改善庫存管理、增強營運視覺性,並在整個供應鏈中維護準確的產品資訊。現代印刷技術的進步也使得高度可客製化的標籤解決方案成為可能,這些方案在提高營運效率的同時,也能降低整體生產成本。隨著全球工業活動的持續擴張,對先進標籤解決方案的需求預計將保持強勁。
| 市場範圍 | |
|---|---|
| 開始年份 | 2025 |
| 預測期 | 2026-2035 |
| 上市時的市場規模 | 678億美元 |
| 預測金額 | 1391億美元 |
| 複合年成長率 | 7.5% |
多個行業的成長推動了對用於識別和營運追蹤的標籤解決方案的需求不斷增加。製造業活動的活性化和商業活動的擴張推動了對能夠支援物流和產品追蹤流程的耐用標籤技術的需求。同時,永續發展計劃正在促進採用旨在減少環境影響的環保標籤材料。此外,數位商務業務的規模化顯著增加了小包裹處理和配送的數量和複雜性,因此需要一個高效的標籤系統來維護整個運輸網路的供應鏈透明度和庫存準確性。
預計到2025年,警示和安全標籤市場佔有率將達到36%。此細分市場需求強勁,主要得益於工業環境中對法規遵循、職場安全標準以及產品安全標識需求的不斷成長。這些標籤廣泛用於傳遞安全資訊、維護設備標識以及支援遵守工業安全準則。其耐用性和對惡劣環境條件的耐受性使其適用於嚴苛的運作環境,從而確保了其在眾多產業中的穩定需求。
到2025年,塑膠和聚合物領域將佔據59.9%的市場。塑膠標籤材料的廣泛應用主要得益於其耐用性、適應性和成本效益。工業級聚合物材料具有極強的耐濕性、耐化學腐蝕性和耐溫差性,使其適用於嚴苛的工業環境。其輕質結構和柔軟性使其能夠高效搬運和大規模生產,從而滿足製造業和物流業的大批量標籤需求。
到2025年,北美工業標籤市佔率將達到31.7%。該地區的成長主要得益於工業自動化和先進製造技術的日益普及。企業正在部署現代化的標籤解決方案,以改善資產追蹤、最大限度地減少操作失誤,並滿足有關產品識別和職場安全的嚴格監管要求。物流網路的擴張和倉儲基礎設施的現代化也推動了該地區對先進標籤系統需求的成長。北美數位化零售物流和現代化供應鏈基礎設施的快速發展持續促進工業標籤的廣泛應用。隨著貨運量的成長和分銷系統複雜性的增加,企業對能夠實現高效庫存管理和營運可視性的精準標籤解決方案的需求日益成長。
目錄
第1章:調查方法和範圍
第2章執行摘要
第3章業界考察
- 生態系分析
- 供應商情況
- 利潤率
- 成本結構
- 每個階段增加的價值
- 影響價值鏈的因素
- 中斷
- 影響產業的因素
- 促進因素
- 對供應鏈可追溯性的需求日益成長
- 人們越來越關注產品安全和保障問題。
- 電子商務和零售業的成長
- 人們越來越關注仿冒品
- 產業部門的擴張
- 產業潛在風險與挑戰
- 防偽標籤解決方案
- 技術整合成本
- 市場機遇
- RFID和智慧工業標籤的實施
- 永續且環保的標籤解決方案
- 促進因素
- 成長潛力分析
- 監理情勢
- 波特五力分析
- PESTEL 分析
- 科技與創新趨勢
- 當前技術趨勢
- 新興技術
- 新經營模式
- 合規要求
- 專利和智慧財產權分析
- 貿易數據分析(基於付費資料庫)
- 進出口量及進口額趨勢
- 主要貿易路線及關稅的影響
- 人工智慧和生成式人工智慧對市場的影響(基於初步研究)
- 利用人工智慧改造現有經營模式
- 針對特定領域的生成式人工智慧應用案例和實施藍圖
- 風險、限制和監管考量
- 生產能力和生產趨勢(基於初步調查)
- 各地區及主要生產商的產能
- 運轉率和擴張計劃
第4章 競爭情勢
- 介紹
- 企業市佔率分析
- 按地區
- 市場集中度分析
- 主要企業的競爭標竿分析
- 財務績效比較
- 銷售量
- 利潤率
- 研究與發展(R&D)
- 產品系列比較
- 產品線寬度
- 科技
- 創新
- 區域擴張比較
- 全球擴張分析
- 服務網路覆蓋
- 按地區分類的市場滲透率
- 競爭定位矩陣
- 領導者
- 挑戰者
- 追蹤者
- 小眾玩家
- 財務績效比較
- 主要進展
- 併購
- 夥伴關係和聯盟
- 技術進步
- 業務拓展與投資策略
- 數位轉型計劃
- 新興競爭對手和Start-Ups競爭對手的發展趨勢
第5章 市場估算與預測:依產品類型分類,2022-2035年
- 警告/安全標籤
- 品牌標籤
- 追蹤標籤
- 識別標籤
- 其他
第6章 市場估計與預測:依材料分類,2022-2035年
- 金屬
- 塑膠/聚合物
- 紙
第7章 市場估計與預測:依方法分類,2022-2035年
- 感壓標籤
- 黏合劑塗層的標籤
- 熱轉印標籤
- 其他
第8章 市場估算與預測:依印刷技術分類,2022-2035年
- 數位印刷
- 光刻
- 柔版印刷
- 網版印刷
- 其他
第9章 市場估計與預測:依最終用途產業分類,2022-2035年
- 運輸/物流
- 建造
- 車
- 衛生保健
- 電子與電機工程
- 化學品
- 其他
第10章 市場估價與預測:依地區分類,2022-2035年
- 北美洲
- 美國
- 加拿大
- 歐洲
- 德國
- 英國
- 法國
- 西班牙
- 義大利
- 荷蘭
- 亞太地區
- 中國
- 印度
- 日本
- 澳洲
- 韓國
- 拉丁美洲
- 巴西
- 墨西哥
- 阿根廷
- 中東和非洲
- 南非
- 沙烏地阿拉伯
- 阿拉伯聯合大公國
第11章:公司簡介
- 主要企業
- 3M
- Avery Dennison
- CCL Industries
- Zebra Technologies
- HID Global
- SATO
- UPM Raflatac
- Multi-Color
- Fuji Seal
- 當地公司
- AWT
- Camcode
- Dura-ID
- DYMO
- HERMA
- Inovar
- Novexx Solutions
- Taghleef
- Linepro Controls
- 利基公司
- ID Images
- MaverickLabel
- Resource Label
The Global Industrial Labels Market was valued at USD 67.8 billion in 2025 and is estimated to grow at a CAGR of 7.5% to reach USD 139.1 billion by 2035.
Growth within the industrial labels industry is supported by the increasing need for transparent supply chain operations, heightened focus on product security, and the expansion of various industrial sectors worldwide. Companies are also adopting advanced labeling solutions to address rising concerns related to counterfeit products and to ensure accurate product identification throughout manufacturing and distribution processes. In addition, the continued expansion of digital commerce and retail logistics networks has significantly increased the need for efficient product tracking and shipment identification. Businesses are increasingly deploying advanced labeling technologies to improve inventory management, enhance operational visibility, and maintain accurate product information across supply chains. The development of modern printing technologies has also enabled highly customizable labeling solutions that improve operational efficiency while reducing overall production costs. As industrial activity expands globally, the demand for advanced labeling solutions is expected to remain strong.
| Market Scope | |
|---|---|
| Start Year | 2025 |
| Forecast Year | 2026-2035 |
| Start Value | $67.8 Billion |
| Forecast Value | $139.1 Billion |
| CAGR | 7.5% |
The growth of multiple industries is further strengthening demand for labeling solutions used in identification and operational tracking. Increased manufacturing activity and expanding commercial operations are creating greater requirements for durable labeling technologies capable of supporting logistics and product tracking processes. At the same time, sustainability initiatives are encouraging the adoption of environmentally responsible labeling materials designed to reduce environmental impact. In addition, the growing scale of digital commerce operations has significantly increased parcel volumes and distribution complexity, which requires efficient labeling systems to maintain supply chain transparency and inventory accuracy across transportation networks.
The warning and security labels segment held 36% share in 2025. This segment maintains strong demand due to the increasing need for regulatory compliance, workplace safety standards, and secure product identification across industrial environments. These labels are widely utilized to communicate safety information, maintain equipment identification, and support compliance with industrial safety guidelines. Their durability and resistance to harsh environmental conditions make them suitable for long-term use in demanding operational environments, contributing to steady demand across multiple industries.
The plastic and polymer segment held 59.9% share in 2025. The widespread use of plastic-based labeling materials is largely driven by their durability, adaptability, and cost efficiency. Industrial-grade polymer materials provide strong resistance to moisture, chemicals, and temperature variations, making them suitable for demanding industrial conditions. Their lightweight structure and flexibility also enable efficient handling and large-scale production, supporting high-volume labeling requirements across manufacturing and logistics sectors.
North America Industrial Labels Market held a 31.7% share in 2025. The region's growth is largely driven by the increasing adoption of industrial automation and advanced manufacturing technologies. Businesses are implementing modern labeling solutions to improve asset tracking, minimize operational errors, and comply with strict regulatory requirements related to product identification and workplace safety. The expansion of logistics networks and the modernization of warehouse infrastructure are also contributing to rising demand for advanced labeling systems in the region. The rapid development of digital retail logistics and modern supply chain infrastructure in North America continues to support widespread adoption of industrial labels. Growing cargo volumes and increasingly complex distribution systems require accurate labeling solutions that enable efficient inventory management and operational visibility.
Key companies operating in the Global Industrial Labels Market include 3M, Avery Dennison, CCL Industries, Zebra Technologies, SATO, HERMA, Fuji Seal, HID Global, Multi-Color, Taghleef, UPM Raflatac, AWT, Camcode, Dura-ID, DYMO, ID Images, Inovar, Linepro Controls, MaverickLabel, Novexx Solutions, and Resource Label. Companies within the Global Industrial Labels Market are implementing several strategic initiatives to strengthen their competitive position and expand market presence. Leading manufacturers are investing heavily in research and development to create innovative labeling materials that offer enhanced durability, improved print quality, and greater environmental sustainability. Many organizations are focusing on developing smart labeling technologies integrated with digital identification solutions to improve supply chain transparency and operational tracking. Strategic partnerships with logistics providers and manufacturing companies are also helping firms expand their customer base and strengthen distribution networks. In addition, companies are increasing production capacity and introducing advanced digital printing technologies to deliver customized labeling solutions.
Table of Contents
Chapter 1 Methodology and Scope
- 1.1 Market scope and definition
- 1.2 Research design
- 1.2.1 Research approach
- 1.2.2 Data collection methods
- 1.3 Data mining sources
- 1.3.1 Global
- 1.3.2 Regional/Country
- 1.4 Base estimates and calculations
- 1.4.1 Base year calculation
- 1.4.2 Key trends for market estimation
- 1.5 Primary research and validation
- 1.5.1 Primary sources
- 1.6 Forecast model
- 1.7 Research assumptions and limitations
Chapter 2 Executive Summary
- 2.1 Industry 360° synopsis, 2022 - 2035
- 2.2 Key market trends
- 2.2.1 Product type trends
- 2.2.2 Material trends
- 2.2.3 Mechanism trends
- 2.2.4 Printing technology trends
- 2.2.5 End-use industry trends
- 2.2.6 Regional trends
- 2.3 TAM Analysis, 2026-2035
- 2.4 CXO perspectives: Strategic imperatives
Chapter 3 Industry Insights
- 3.1 Industry ecosystem analysis
- 3.1.1 Supplier Landscape
- 3.1.2 Profit Margin
- 3.1.3 Cost structure
- 3.1.4 Value addition at each stage
- 3.1.5 Factor affecting the value chain
- 3.1.6 Disruptions
- 3.2 Industry impact forces
- 3.2.1 Growth drivers
- 3.2.1.1 Increasing demand for supply chain traceability
- 3.2.1.2 Rising focus on product safety and security
- 3.2.1.3 Growth in e-commerce and retail sectors
- 3.2.1.4 Increasing concerns about counterfeit products
- 3.2.1.5 Expansion of industrial sectors
- 3.2.2 Industry pitfalls and challenges
- 3.2.2.1 Counterfeit labeling solutions
- 3.2.2.2 Technological integration costs
- 3.2.3 Market opportunities
- 3.2.3.1 Adoption of RFID and smart industrial labels
- 3.2.3.2 Sustainable and eco-friendly labeling solutions
- 3.2.1 Growth drivers
- 3.3 Growth potential analysis
- 3.4 Regulatory landscape
- 3.4.1 North America
- 3.4.2 Europe
- 3.4.3 Asia Pacific
- 3.4.4 Latin America
- 3.4.5 Middle East & Africa
- 3.5 Porter's analysis
- 3.6 PESTEL analysis
- 3.7 Technology and Innovation landscape
- 3.7.1 Current technological trends
- 3.7.2 Emerging technologies
- 3.8 Emerging business models
- 3.9 Compliance requirements
- 3.10 Patent and IP analysis
- 3.11 Trade Data Analysis (Based on Paid Databases)
- 3.11.1 Import/export volume & value trends
- 3.11.2 Key trade corridors & tariff impact
- 3.12 Impact of AI & generative AI on the market (Driven by Primary Research)
- 3.12.1 AI-driven disruption of existing business models
- 3.12.2 GenAI use cases & adoption roadmap by segment
- 3.12.3 Risks, limitations & regulatory considerations
- 3.13 Capacity & production landscape (Driven by Primary Research)
- 3.13.1 Production capacity by region & key producer
- 3.13.2 Capacity utilization rates & expansion pipelines
Chapter 4 Competitive Landscape, 2025
- 4.1 Introduction
- 4.2 Company market share analysis
- 4.2.1 By region
- 4.2.1.1 North America
- 4.2.1.2 Europe
- 4.2.1.3 Asia Pacific
- 4.2.1.4 Latin America
- 4.2.1.5 Middle East & Africa
- 4.2.2 Market concentration analysis
- 4.2.1 By region
- 4.3 Competitive benchmarking of key players
- 4.3.1 Financial performance comparison
- 4.3.1.1 Revenue
- 4.3.1.2 Profit margin
- 4.3.1.3 R&D
- 4.3.2 Product portfolio comparison
- 4.3.2.1 Product range breadth
- 4.3.2.2 Technology
- 4.3.2.3 Innovation
- 4.3.3 Geographic presence comparison
- 4.3.3.1 Global footprint analysis
- 4.3.3.2 Service network coverage
- 4.3.3.3 Market penetration by region
- 4.3.4 Competitive positioning matrix
- 4.3.4.1 Leaders
- 4.3.4.2 Challengers
- 4.3.4.3 Followers
- 4.3.4.4 Niche players
- 4.3.1 Financial performance comparison
- 4.4 Key developments
- 4.4.1 Mergers and acquisitions
- 4.4.2 Partnerships and collaborations
- 4.4.3 Technological advancements
- 4.4.4 Expansion and investment strategies
- 4.4.5 Digital transformation initiatives
- 4.5 Emerging/ startup competitors landscape
Chapter 5 Market Estimates and Forecast, By Product Type, 2022 - 2035 (USD Billion)
- 5.1 Key trends
- 5.2 Warning/security labels
- 5.3 Branding labels
- 5.4 Tracking labels
- 5.5 Identification labels
- 5.6 Others
Chapter 6 Market Estimates and Forecast, By Material, 2022 - 2035 (USD Billion & Units)
- 6.1 Key trends
- 6.2 Metal
- 6.3 Plastic/polymer
- 6.4 Paper
Chapter 7 Market Estimates and Forecast, By Mechanism, 2022 - 2035 (USD Billion & Units)
- 7.1 Key trends
- 7.2 Pressure-sensitive labels
- 7.3 Glue-applied labels
- 7.4 Heat transfer labels
- 7.5 Others
Chapter 8 Market Estimates and Forecast, By Printing Technology, 2022 - 2035 (USD Billion & Units)
- 8.1 Key trends
- 8.2 Digital printing
- 8.3 Lithography
- 8.4 Flexography
- 8.5 Screen printing
- 8.6 Others
Chapter 9 Market Estimates and Forecast, By End-use Industry, 2022 - 2035 (USD Billion & Units)
- 9.1 Key trends
- 9.2 Transportation & logistics
- 9.3 Construction
- 9.4 Automotive
- 9.5 Healthcare
- 9.6 Electronics & electrical
- 9.7 Chemicals
- 9.8 Others
Chapter 10 Market Estimates and Forecast, By Region, 2022 - 2035 (USD Billion & Units)
- 10.1 Key trends
- 10.2 North America
- 10.2.1 U.S.
- 10.2.2 Canada
- 10.3 Europe
- 10.3.1 Germany
- 10.3.2 UK
- 10.3.3 France
- 10.3.4 Spain
- 10.3.5 Italy
- 10.3.6 Netherlands
- 10.4 Asia Pacific
- 10.4.1 China
- 10.4.2 India
- 10.4.3 Japan
- 10.4.4 Australia
- 10.4.5 South Korea
- 10.5 Latin America
- 10.5.1 Brazil
- 10.5.2 Mexico
- 10.5.3 Argentina
- 10.6 Middle East and Africa
- 10.6.1 South Africa
- 10.6.2 Saudi Arabia
- 10.6.3 UAE
Chapter 11 Company Profiles
- 11.1 Global Key Players
- 11.1.1 3M
- 11.1.2 Avery Dennison
- 11.1.3 CCL Industries
- 11.1.4 Zebra Technologies
- 11.1.5 HID Global
- 11.1.6 SATO
- 11.1.7 UPM Raflatac
- 11.1.8 Multi-Color
- 11.1.9 Fuji Seal
- 11.2 Regional Players
- 11.2.1 AWT
- 11.2.2 Camcode
- 11.2.3 Dura-ID
- 11.2.4 DYMO
- 11.2.5 HERMA
- 11.2.6 Inovar
- 11.2.7 Novexx Solutions
- 11.2.8 Taghleef
- 11.2.9 Linepro Controls
- 11.3 Niche Players
- 11.3.1 ID Images
- 11.3.2 MaverickLabel
- 11.3.3 Resource Label


