


 |
市場調查報告書
商品編碼
1998785
商用冷卻計量市場機會、成長促進因素、產業趨勢分析及預測(2026-2035年)Commercial Cooling Meters Market Opportunity, Growth Drivers, Industry Trend Analysis, and Forecast 2026 - 2035 |
||||||
全球商用冷卻計量表市場預計到 2025 年將價值 9 億美元,預計到 2035 年將以 5.4% 的複合年成長率成長至 16 億美元。
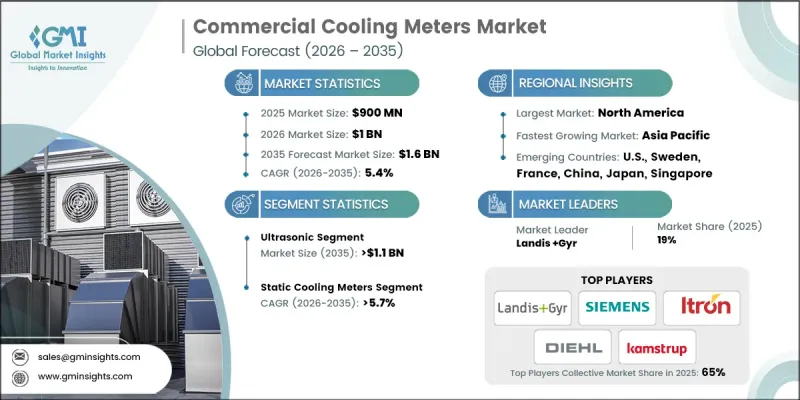
這一成長主要得益於商用房地產的快速擴張,包括辦公大樓、零售空間、飯店計劃和公共設施,這些領域對能源管理解決方案的需求日益成長。設施營運商正在利用商用製冷計量表來準確了解能源消耗情況,最佳化製冷分配,識別低效率環節,並提升系統效能。這些計量表測量暖通空調系統(HVAC)的冷卻能耗,包括冷凍水和其他冷卻介質的能耗,提供精確的量化數據,這對於多租戶收費和區域冷卻網路至關重要。老舊建築的智慧化改造和維修趨勢,以及監管壓力和對能源效率的追求,進一步推動了市場對智慧計量表的接受度。現代智慧計量表還具有長期的準確性、耐用性和無縫整合等優點,使其成為現代商用能源管理策略中不可或缺的一部分。
| 市場範圍 | |
|---|---|
| 開始年份 | 2025 |
| 預測期 | 2026-2035 |
| 起始金額 | 9億美元 |
| 預測金額 | 16億美元 |
| 複合年成長率 | 5.4% |
預計到2035年,超音波冷凍量表市場規模將達11億美元。這類量表因其可靠性高、測量精度高、安裝便捷(無需對現有設施進行任何干涉)而日益普及,安裝過程不會造成任何運作,同時還能提供詳細的製冷使用情況資訊。其穩定的性能使其成為需要即時監控和數據驅動型能源最佳化的商業建築的理想選擇。
預計到2035年,靜態冷卻流量計市場將以5.7%的複合年成長率成長。這些流量計能夠精確測量流量和能耗,支援數位化冷卻網路中的自動化控制策略和即時監控。這些詳細的數據使設施管理人員能夠最佳化系統效率,從而促進其在現代商業設施中的應用。
預計到2035年,美國商用冷凍計量市場規模將達6.412億美元。這一成長主要得益於智慧建築計劃、自動化效能監控和數據驅動的能源管理。更嚴格的建築規範和能源效率法規正在提升對精準計量解決方案的需求。與物聯網基礎設施的整合正在提高系統智慧化程度和運作效率,增強市場競爭力,同時也刺激了對商用冷凍技術的進一步投資。
目錄
第1章:調查方法和範圍
第2章執行摘要
第3章業界考察
- 產業生態系統
- 監理情勢
- 影響產業的因素
- 成長促進因素
- 產業潛在風險與挑戰
- 成長潛力分析
- 波特五力分析
- PESTEL 分析
- 成本結構分析
- 價格趨勢分析,2022-2035年
- 依產品
- 按地區
- 新機會和趨勢
- 數位化和物聯網整合
- 投資分析及未來展望
第4章 競爭情勢
- 介紹
- 企業市佔率分析:按地區分類
- 北美洲
- 歐洲
- 亞太地區
- 中東
- 競爭定位矩陣
- 主要進展
- 併購
- 夥伴關係與合作
- 新產品發布
- 業務拓展計劃及資金籌措
第5章 市場規模及預測:依產品分類,2022-2035年
- 超音波
- 渦流
- 其他
第6章 市場規模及預測:依技術分類,2022-2035年
- 機械的
- 靜止的
第7章 市場規模及預測:依應用領域分類,2022-2035年
- 大學/專科院校
- 辦公大樓
- 政府大樓
- 其他
第8章 市場規模及預測:依地區分類,2022-2035年
- 北美洲
- 美國
- 加拿大
- 歐洲
- 德國
- 波蘭
- 瑞典
- 義大利
- 法國
- 芬蘭
- 奧地利
- 挪威
- 亞太地區
- 中國
- 日本
- 韓國
- 新加坡
- 印度
- 中東
- 沙烏地阿拉伯
- 阿拉伯聯合大公國
- 卡達
- 阿曼
- 科威特
- 世界其他地區
第9章:公司簡介
- Apator Group
- Axioma Metering
- Badger Meter
- BMETERS
- Danfoss
- Diehl Stiftung &Co. KG
- Honeywell International
- Integra Metering
- Itron
- ista Energy Solutions
- Kamstrup
- Landis+Gyr
- Qundis
- Schneider Electric
- Secure Meters
- Sensus
- Siemens
- Sontex
- Techem
- Zenner International
The Global Commercial Cooling Meters Market was valued at USD 900 million in 2025 and is estimated to grow at a CAGR of 5.4% to reach USD 1.6 billion by 2035.
The growth is fueled by the rapid expansion of commercial real estate, including office complexes, retail spaces, hospitality projects, and institutional buildings, which are increasingly adopting energy management solutions. Facility operators are leveraging commercial cooling meters to gain precise insights into energy consumption, optimize cooling distribution, identify inefficiencies, and enhance system performance. These meters measure energy used for cooling within HVAC systems, including chilled water and other cooling media, providing accurate quantification critical for multi-tenant billing and district cooling networks. The trend toward smart and retrofit installations in older buildings, combined with regulatory pressures and the shift toward energy efficiency, is further driving market adoption. Modern smart meters also enable long-term precision, durability, and seamless integration, making them indispensable for contemporary commercial energy management strategies.
| Market Scope | |
|---|---|
| Start Year | 2025 |
| Forecast Year | 2026-2035 |
| Start Value | $900 Million |
| Forecast Value | $1.6 Billion |
| CAGR | 5.4% |
The ultrasonic cooling meter segment is expected to reach USD 1.1 billion by 2035. These meters are gaining popularity due to their reliability, high-precision readings, and non-intrusive installation, allowing uninterrupted operation while providing detailed visibility into cooling usage. Their consistent performance makes them ideal for commercial buildings requiring real-time monitoring and data-driven energy optimization.
The static cooling meters segment is projected to grow at a CAGR of 5.7% by 2035. They provide precise measurements of flow and energy usage, supporting automated control strategies and real-time monitoring in digital cooling networks. This granular data enables facility managers to optimize system efficiency, contributing to broader adoption across modern commercial developments.
U.S. Commercial Cooling Meters Market is anticipated to reach USD 641.2 million by 2035. The growth is driven by smart building initiatives, automated performance monitoring, and data-driven energy management. Stricter enforcement of building codes and energy efficiency regulations is increasing demand for accurate metering solutions. Integration with IoT-enabled infrastructure enhances system intelligence and operational efficiency, strengthening the competitiveness of the market while encouraging further investment in commercial cooling technologies.
Key players operating in the Global Commercial Cooling Meters Market include Danfoss, Siemens, Honeywell International, Kamstrup, Schneider Electric, Apator Group, Sensus, Landis+Gyr, Qundis, ista Energy Solutions, BMETERS, Secure Meters, Axioma Metering, Techem, Sontex, Badger Meter, Diehl Stiftung & Co. KG, Itron, and Integra Metering. Key strategies adopted by companies in the Global Commercial Cooling Meters Market include focusing on R&D to develop high-accuracy, durable, and IoT-compatible meters. Manufacturers are investing in smart meter technologies that integrate with building management systems for real-time monitoring and energy optimization. Strategic partnerships with commercial developers and energy service providers expand distribution networks and adoption in retrofit projects. Companies are emphasizing compliance with evolving energy regulations and sustainability standards to gain market trust. Offering scalable solutions, predictive maintenance features, and value-added services strengthens customer loyalty while differentiating products from competitors in a highly competitive landscape.
Table of Contents
Chapter 1 Methodology & Scope
- 1.1 Research design
- 1.2 Quality commitment
- 1.2.1 GMI AI policy & data integrity commitment
- 1.2.1.1 Source consistency protocol
- 1.2.1 GMI AI policy & data integrity commitment
- 1.3 Research trail & Confidence Scoring
- 1.3.1 Research trail components
- 1.3.2 Scoring components
- 1.4 Data Collection
- 1.4.1 Partial list of primary sources
- 1.5 Data mining sources
- 1.5.1 Paid sources
- 1.5.1.1 Sources, by region
- 1.5.1 Paid sources
- 1.6 Base estimates and calculations
- 1.6.1 Base year calculation for any one approach
- 1.7 Forecast model
- 1.8 Research transparency addendum
- 1.8.1 Source attribution framework
- 1.8.2 Quality assurance metrics
- 1.8.3 Our commitment to trust
- 1.9 Market definitions
Chapter 2 Executive Summary
- 2.1 Industry synopsis, 2022 - 2035
- 2.2 Business trends
- 2.3 Product trends
- 2.4 Technology trends
- 2.5 Application trends
- 2.6 Regional trends
Chapter 3 Industry Insights
- 3.1 Industry ecosystem
- 3.2 Regulatory landscape
- 3.3 Industry impact forces
- 3.3.1 Growth drivers
- 3.3.2 Industry pitfalls & challenges
- 3.4 Growth potential analysis
- 3.5 Porter's analysis
- 3.5.1 Bargaining power of suppliers
- 3.5.2 Bargaining power of buyers
- 3.5.3 Threat of new entrants
- 3.5.4 Threat of substitutes
- 3.6 PESTEL analysis
- 3.6.1 Political factors
- 3.6.2 Economic factors
- 3.6.3 Social factors
- 3.6.4 Technological factors
- 3.6.5 Legal factors
- 3.6.6 Environmental factors
- 3.7 Cost structure analysis
- 3.8 Price trend analysis, 2022-2035
- 3.8.1 By Product
- 3.8.2 By Region
- 3.9 Emerging opportunities & trends
- 3.9.1 Digitalization & IoT integration
- 3.10 Investment analysis & future outlook
Chapter 4 Competitive landscape, 2026
- 4.1 Introduction
- 4.2 Company market share analysis, by region, 2025
- 4.2.1 North America
- 4.2.2 Europe
- 4.2.3 Asia Pacific
- 4.2.4 Middle East
- 4.3 Competitive positioning matrix
- 4.4 Key developments
- 4.4.1 Mergers & acquisitions
- 4.4.2 Partnerships & collaborations
- 4.4.3 New product launches
- 4.4.4 Expansion plans & funding
Chapter 5 Market Size and Forecast, By Product, 2022 - 2035 (USD Million & ‘000 Units)
- 5.1 Key trends
- 5.2 Ultrasonic
- 5.3 Vortex
- 5.4 Others
Chapter 6 Market Size and Forecast, By Technology, 2022 - 2035 (USD Million & ‘000 Units)
- 6.1 Key trends
- 6.2 Mechanical
- 6.3 Static
Chapter 7 Market Size and Forecast, By Application, 2022 - 2035 (USD Million & ‘000 Units)
- 7.1 Key trends
- 7.2 College/University
- 7.3 Office building
- 7.4 Government building
- 7.5 Others
Chapter 8 Market Size and Forecast, By Region, 2022 - 2035 (USD Million & ‘000 Units)
- 8.1 Key trends
- 8.2 North America
- 8.2.1 U.S.
- 8.2.2 Canada
- 8.3 Europe
- 8.3.1 Germany
- 8.3.2 Poland
- 8.3.3 Sweden
- 8.3.4 Italy
- 8.3.5 France
- 8.3.6 Finland
- 8.3.7 Austria
- 8.3.8 Norway
- 8.4 Asia Pacific
- 8.4.1 China
- 8.4.2 Japan
- 8.4.3 South Korea
- 8.4.4 Singapore
- 8.4.5 India
- 8.5 Middle East
- 8.5.1 Saudi Arabia
- 8.5.2 UAE
- 8.5.3 Qatar
- 8.5.4 Oman
- 8.5.5 Kuwait
- 8.6 Rest of the world
Chapter 9 Company Profiles
- 9.1 Apator Group
- 9.2 Axioma Metering
- 9.3 Badger Meter
- 9.4 BMETERS
- 9.5 Danfoss
- 9.6 Diehl Stiftung & Co. KG
- 9.7 Honeywell International
- 9.8 Integra Metering
- 9.9 Itron
- 9.10 ista Energy Solutions
- 9.11 Kamstrup
- 9.12 Landis+Gyr
- 9.13 Qundis
- 9.14 Schneider Electric
- 9.15 Secure Meters
- 9.16 Sensus
- 9.17 Siemens
- 9.18 Sontex
- 9.19 Techem
- 9.20 Zenner International
 可再生能源專案開發和EPC服務市場預測至2034年—按服務類型、能源來源、專案規模、最終用戶和地區分類的全球分析能源接取和微電網解決方案市場預測至2034年—按容量範圍、所有權和營運模式、技術、應用和區域分類的全球分析低碳寵物食品市場預測至2034年-全球分析(按產品類型、成分類型、寵物類型、生命階段、價格範圍、包裝類型、分銷管道、最終用戶和地區分類)節水型食品生產市場預測至2034年-按生產環境、作物類型、最終用戶和地區分類的全球分析
 2026-2030年全球清潔能源技術市場
 超音波冷卻計市場機會、成長要素、產業趨勢分析及2026-2035年預測Power-to-X技術市場預測至2034年:按類型、組件、應用、最終用戶和地區分類的全球分析低碳化學品生產市場預測至2034年:按技術、應用和區域分類的全球分析冷凍量表市場機會、成長要素、產業趨勢分析及2026-2035年預測
 2026年全球清潔能源技術市場報告