


 |
市場調查報告書
商品編碼
1998754
冷凍量表市場機會、成長要素、產業趨勢分析及2026-2035年預測Cooling Meters Market Opportunity, Growth Drivers, Industry Trend Analysis, and Forecast 2026 - 2035 |
||||||
全球冷卻計量表市場預計到 2025 年將價值 14 億美元,預計到 2035 年將以 6.2% 的複合年成長率成長至 25 億美元。
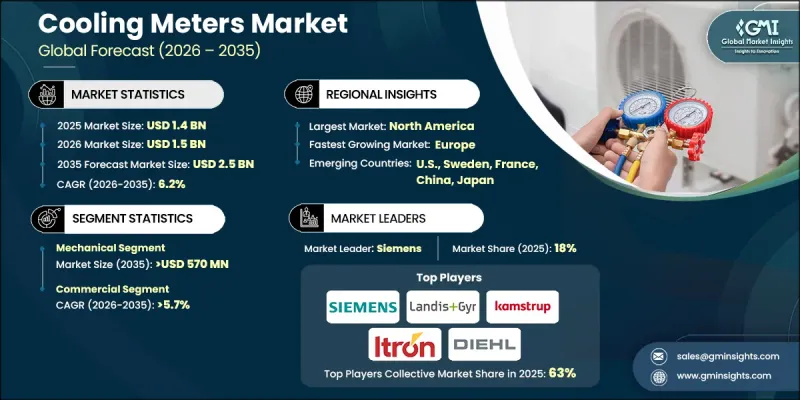
市場成長的驅動力來自永續製冷解決方案的日益普及、更嚴格的環境標準以及日益嚴苛的監管要求,這些因素推動了智慧電錶技術的應用,從而實現對冷凍水用量的精確計量和透明收費。對營運效率的日益關注也促進了商業、工業和住宅維修計劃中智慧計量技術的應用。除了建築和工業的現代化改造外,區域冷卻網路的擴張也增加了對精確計量解決方案的需求,進一步推動了市場成長。製造商目前專注於研發可靠、低維護、具備即時監控、可與建築管理系統整合以及數據驅動分析功能的數位化計量表。這些解決方案有助於最佳化系統效能、減少浪費、確保成本合理分配並維持穩定的冷氣供應,使冷凍計量表成為全球節能基礎設施的重要組成部分。
| 市場範圍 | |
|---|---|
| 開始年份 | 2025 |
| 預測期 | 2026-2035 |
| 上市時的市場規模 | 14億美元 |
| 預計金額 | 25億美元 |
| 複合年成長率 | 6.2% |
機械式冷卻水錶市場預計到2035年將達到5.7億美元,主要得益於其成本效益高、設計簡單且測量精度高。這類水錶採用直接機械技術測量流量和溫差,因此適用於高階智慧水錶需求不高的場所。機械式水錶尤其受到追求綠色建築認證(包括LEED認證)的商業和住宅建築的青睞,這也推動了市場擴張。
預計到2035年,商業領域的複合年成長率將達到5.7%,這主要得益於辦公大樓、購物中心和飯店對能源管理的需求不斷成長。冷凍計量表能夠提供即時能源數據,幫助設施管理人員進行定期審計、提高系統效率、防止過度製冷並找出需要改進的營運領域,因此正在推動該領域的應用。
預計到2035年,美國冷凍計量表市場規模將達到7.1億美元,主要得益於政府支持政策對永續建築基礎設施的推動。政府推出的節能解決方案獎勵以及支持商業和工業應用高性能冷卻技術的項目,正在加速相關技術的應用和創新。
目錄
第1章:調查方法和範圍
第2章執行摘要
第3章業界考察
- 產業生態系統
- 原物料供應及採購分析
- 生產能力評估
- 供應鏈韌性與風險因素
- 配電網路分析
- 監理情勢
- 影響產業的因素
- 促進因素
- 產業潛在風險與挑戰
- 成長潛力分析
- 波特五力分析
- PESTEL 分析
- 新機會與趨勢
- 數位化和物聯網整合
- 進入新興市場
- 投資分析及未來展望
第4章 競爭情勢
- 介紹
- 企業市佔率分析
- 北美洲
- 歐洲
- 亞太地區
- 中東
- 戰略儀錶板
- 策略舉措
- 創新與科技趨勢
第5章 市場規模及預測:依產品分類,2022-2035年
- 超音波
- 渦流
- 其他
第6章 市場規模及預測:依技術分類,2022-2035年
- 機械的
- 靜止的
第7章 市場規模及預測:依應用領域分類,2022-2035年
- 住宅
- 商業的
- 學院和高等教育機構
- 辦公大樓
- 政府設施
- 其他
- 工業的
第8章 市場規模及預測:依地區分類,2022-2035年
- 北美洲
- 美國
- 加拿大
- 歐洲
- 德國
- 波蘭
- 瑞典
- 義大利
- 法國
- 亞太地區
- 中國
- 日本
- 韓國
- 新加坡
- 印度
- 中東
- 沙烏地阿拉伯
- 阿拉伯聯合大公國
- 卡達
- 阿曼
- 科威特
- 世界其他地區
第9章:公司簡介
- Apator SA
- Axioma Metering
- B Meters
- Danfoss
- Diehl Stiftung &Co. KG
- Honeywell International Inc.
- Integra Metering
- Itron Inc.
- ista Energy Solutions Limited
- Kamstrup
- Landis+Gyr
- QUNDIS
- RB Flowmeter
- Schneider Electric
- Secure Meters Ltd.
- Siemens
- Smartdhome Srl
- Sontex SA
- Xylem
- ZENNER International GmbH &Co. KG
The Global Cooling Meters Market was valued at USD 1.4 billion in 2025 and is estimated to grow at a CAGR of 6.2% to reach USD 2.5 billion by 2035.
The market growth is driven by the increasing adoption of sustainable cooling solutions, rising environmental standards, and stricter regulatory mandates, encouraging the deployment of smart metering technologies that provide precise measurement of chilled water usage and transparent billing. Growing attention to operational efficiency is boosting adoption across commercial complexes, industrial facilities, and upgraded residential projects. Modernization of buildings and industries, along with the expansion of district cooling networks, has intensified the need for accurate metering solutions, further propelling market growth. Manufacturers are now focusing on reliable, low-maintenance, digitally enabled meters offering real-time monitoring, integration with building management systems, and data-driven analytics. These solutions help optimize system performance, reduce wastage, ensure fair cost allocation, and maintain consistent cooling delivery, making cooling meters a critical component in energy-efficient infrastructure worldwide.
| Market Scope | |
|---|---|
| Start Year | 2025 |
| Forecast Year | 2026-2035 |
| Start Value | $1.4 Billion |
| Forecast Value | $2.5 Billion |
| CAGR | 6.2% |
The mechanical cooling meters segment is projected to reach USD 570 million by 2035, supported by their cost-effectiveness, simple design, and precise measurement capabilities. These meters operate using direct mechanical technology to measure flow and temperature differentials, making them suitable for environments where high-end smart meters are less necessary. Mechanical meters are particularly favored in commercial and residential buildings targeting green certifications, including LEED compliance, thereby reinforcing market expansion.
The commercial segment is expected to grow at a CAGR of 5.7% through 2035, fueled by demand for energy management in office buildings, shopping centers, and hotels. Cooling meters deliver real-time energy data, enabling facility managers to perform regular audits, improve system efficiency, prevent overcooling, and identify operational improvements, strengthening the sector's adoption.
U.S. Cooling Meters Market is anticipated to reach USD 0.71 billion by 2035, driven by supportive government policies promoting sustainable building infrastructure. Incentives for energy-efficient solutions and programs supporting high-performance cooling technologies for commercial and industrial applications are accelerating adoption and innovation.
Prominent players in the Global Cooling Meters Market include Apator S.A., Axioma Metering, B Meters, Danfoss, Diehl Stiftung & Co. KG, Honeywell International Inc., Integra Metering, Itron Inc., ista Energy Solutions Limited, Kamstrup, Landis+Gyr, QUNDIS, RB Flowmeter, Schneider Electric, Secure Meters Ltd., Siemens, Smartdhome Srl, Sontex SA, Xylem, and ZENNER International GmbH & Co. KG. Companies in the Global Cooling Meters Market are focusing on strategies such as launching smart, IoT-enabled meters with real-time monitoring, integrating AI-driven analytics for predictive maintenance, expanding district cooling partnerships, offering low-maintenance and cost-effective mechanical meters, localizing production to strengthen supply chains, and investing in R&D to improve energy efficiency and accuracy. Additionally, collaborations with building management system providers and retrofitting solutions for existing infrastructures help establish long-term contracts and enhance market footprint in both mature and emerging regions, ensuring sustained growth and competitive advantage.
Table of Contents
Chapter 1 Methodology & Scope
- 1.1 Research Design
- 1.1.1 Research approach
- 1.1.2 Data collection methods
- 1.2 Base estimates and calculations
- 1.2.1 Base year calculation
- 1.2.2 Key trends for market estimates
- 1.3 Forecast model
- 1.3.1 Key trends for market estimates
- 1.3.1.1 Quantified market impact analysis
- 1.3.1.2 Mathematical impact of growth parameters on forecast
- 1.3.2 Scenario analysis framework
- 1.3.1 Key trends for market estimates
- 1.4 Primary research and validation
- 1.4.1 Some of the primary sources (but not limited to)
- 1.5 Data mining sources
- 1.5.1 Paid Sources
- 1.5.2 Sources, by region
- 1.6 Research trail & scoring components
- 1.6.1 Research trail components
- 1.6.2 Scoring components
- 1.7 Research transparency addendum
- 1.7.1 Source attribution framework
- 1.7.2 Quality assurance metrics
- 1.7.3 Our commitment to trust
- 1.8 Market definitions
Chapter 2 Executive Summary
- 2.1 Industry 360-degree synopsis, 2022 - 2035
- 2.2 Business trends
- 2.3 Product trends
- 2.4 Technology trends
- 2.5 Application trends
- 2.6 Regional trends
Chapter 3 Industry Insights
- 3.1 Industry ecosystem
- 3.1.1 Raw material availability & sourcing analysis
- 3.1.2 Manufacturing capacity assessment
- 3.1.3 Supply chain resilience & risk factors
- 3.1.4 Distribution network analysis
- 3.2 Regulatory landscape
- 3.3 Industry impact forces
- 3.3.1 Growth drivers
- 3.3.2 Industry pitfalls & challenges
- 3.4 Growth potential analysis
- 3.5 Porter's analysis
- 3.5.1 Bargaining power of suppliers
- 3.5.2 Bargaining power of buyers
- 3.5.3 Threat of new entrants
- 3.5.4 Threat of substitutes
- 3.6 PESTEL analysis
- 3.6.1 Political factors
- 3.6.2 Economic factors
- 3.6.3 Social factors
- 3.6.4 Technological factors
- 3.6.5 Legal factors
- 3.6.6 Environmental factors
- 3.7 Emerging opportunities & trends
- 3.7.1 Digitalization & IoT integration
- 3.7.2 Emerging market penetration
- 3.8 Investment analysis and future outlook
Chapter 4 Competitive landscape, 2026
- 4.1 Introduction
- 4.2 Company market share analysis, 2025
- 4.2.1 North America
- 4.2.2 Europe
- 4.2.3 Asia Pacific
- 4.2.4 Middle East
- 4.3 Strategic dashboard
- 4.4 Strategic initiatives
- 4.5 Innovation & technology landscape
Chapter 5 Market Size and Forecast, By Product, 2022 - 2035 (USD Million & ‘000 Units)
- 5.1 Key trends
- 5.2 Ultrasonic
- 5.3 Vortex
- 5.4 Others
Chapter 6 Market Size and Forecast, By Technology, 2022 - 2035 (USD Million & ‘000 Units)
- 6.1 Key trends
- 6.2 Mechanical
- 6.3 Static
Chapter 7 Market Size and Forecast, By Application, 2022 - 2035 (USD Million & ‘000 Units)
- 7.1 Key trends
- 7.2 Residential
- 7.3 Commercial
- 7.3.1 College/University
- 7.3.2 Office Building
- 7.3.3 Government Building
- 7.3.4 Others
- 7.4 Industrial
Chapter 8 Market Size and Forecast, By Region, 2022 - 2035 (USD Million & ‘000 Units)
- 8.1 Key trends
- 8.2 North America
- 8.2.1 U.S.
- 8.2.2 Canada
- 8.3 Europe
- 8.3.1 Germany
- 8.3.2 Poland
- 8.3.3 Sweden
- 8.3.4 Italy
- 8.3.5 France
- 8.4 Asia Pacific
- 8.4.1 China
- 8.4.2 Japan
- 8.4.3 South Korea
- 8.4.4 Singapore
- 8.4.5 India
- 8.5 Middle East
- 8.5.1 Saudi Arabia
- 8.5.2 UAE
- 8.5.3 Qatar
- 8.5.4 Oman
- 8.5.5 Kuwait
- 8.6 Rest of World
Chapter 9 Company Profiles
- 9.1 Apator S.A.
- 9.2 Axioma Metering
- 9.3 B Meters
- 9.4 Danfoss
- 9.5 Diehl Stiftung & Co. KG
- 9.6 Honeywell International Inc.
- 9.7 Integra Metering
- 9.8 Itron Inc.
- 9.9 ista Energy Solutions Limited
- 9.10 Kamstrup
- 9.11 Landis+Gyr
- 9.12 QUNDIS
- 9.13 RB Flowmeter
- 9.14 Schneider Electric
- 9.15 Secure Meters Ltd.
- 9.16 Siemens
- 9.17 Smartdhome Srl
- 9.18 Sontex SA
- 9.19 Xylem
- 9.20 ZENNER International GmbH & Co. KG
 可再生能源專案開發和EPC服務市場預測至2034年—按服務類型、能源來源、專案規模、最終用戶和地區分類的全球分析能源接取和微電網解決方案市場預測至2034年—按容量範圍、所有權和營運模式、技術、應用和區域分類的全球分析低碳寵物食品市場預測至2034年-全球分析(按產品類型、成分類型、寵物類型、生命階段、價格範圍、包裝類型、分銷管道、最終用戶和地區分類)節水型食品生產市場預測至2034年-按生產環境、作物類型、最終用戶和地區分類的全球分析
 2026-2030年全球清潔能源技術市場
 超音波冷卻計市場機會、成長要素、產業趨勢分析及2026-2035年預測Power-to-X技術市場預測至2034年:按類型、組件、應用、最終用戶和地區分類的全球分析低碳化學品生產市場預測至2034年:按技術、應用和區域分類的全球分析商用冷卻計量市場機會、成長促進因素、產業趨勢分析及預測(2026-2035年)
 2026年全球清潔能源技術市場報告