


 |
市場調查報告書
商品編碼
1998765
汽車並聯式混合動力系統市場機會、成長要素、產業趨勢分析及2026-2035年預測Automotive Parallel Hybrid Power System Market Opportunity, Growth Drivers, Industry Trend Analysis, and Forecast 2026 - 2035 |
||||||
全球汽車並聯混合動力系統市場預計到 2025 年將達到 784 億美元,年複合成長率為 8.4%,到 2035 年將達到 1,914 億美元。
車輛平均溫室氣體排放和燃油經濟性的監管壓力日益增大,迫使汽車製造商採用並聯式混合動力系統作為一種經濟有效的減排策略,而無需轉型為純電動車。並聯式混合動力系統為提高排放效率提供了一種切實可行的解決方案,特別適用於乘用車、計程車和末端配送車輛,尤其是在都市區和走走停停的駕駛條件下。這些系統結合了能量回收煞車、電動馬達輔助和最佳化的內燃機,以降低油耗和長期營運成本。都市化加快、油價波動以及對永續出行日益成長的需求,進一步推動了並聯式混合動力汽車的普及。汽車製造商(OEM)和車隊營運商正在投資於能夠兼顧環保法規、性能、耐用性和成本效益的混合動力解決方案。
| 市場範圍 | |
|---|---|
| 開始年份 | 2025 |
| 預測期 | 2026-2035 |
| 上市時的市場規模 | 784億美元 |
| 預測金額 | 1914億美元 |
| 複合年成長率 | 8.4% |
預計到2025年,內燃機市佔率將達到39%,並在2035年之前以7.1%的複合年成長率成長。並聯式混合動力汽車中使用的內燃機正朝著更小、更有效率的方向發展,並整合了渦輪增壓器、輕量化材料和先進的溫度控管技術。再生煞車和先進的控制軟體提高了扭力輔助、燃油效率和排放氣體,同時實現了電動模式和內燃機模式之間的平順切換。這些技術進步確保了車輛在各種駕駛條件下的穩定性能,並提高了動力傳動系統的整體效率。
預計到2025年,全混合動力系統市佔率將達到68%,並在2035年之前以8%的複合年成長率成長。全混合動力解決方案正受到消費者的青睞,他們追求的是燃油效率高的SUV和乘用車,尤其是在政府持續提供財政獎勵鼓勵推廣混合動力汽車的背景下。汽車製造商正加大投入,致力於提升電池系統與內燃機(ICE)零件的整合度,最佳化能量回收,並改善電動輔助性能。這些發展正在提高燃油效率,並有助於實現排放氣體目標,使全混合動力系統成為成長最快的市場區隔領域之一。
預計2025年,美國汽車並聯式混合動力系統市場規模將達到178億美元。輕度混合動力和全混合動力轎車及SUV日益普及,主要受都市區通勤者的需求、聯邦政府的獎勵以及消費者日益增強的環保意識所驅動。車隊營運商正在採用混合動力汽車以降低營運成本並滿足排放氣體法規的要求。製造商致力於提高再生煞車、電動輔助系統和混合動力傳動系統的效率,同時提升駕駛體驗,這推動了混合動力解決方案在個人和商業車隊中的廣泛應用。
目錄
第1章:調查方法
第2章執行摘要
第3章業界考察
- 生態系分析
- 供應商情況
- 利潤率
- 成本結構
- 每個階段增加的價值
- 影響價值鏈的因素
- 中斷
- 影響產業的因素
- 促進因素
- 嚴格的排放法規
- 燃油價格飆升
- 都市化和交通堵塞
- 對節能型車輛的需求日益成長
- 產業潛在風險與挑戰
- 高昂的系統成本
- 消費者意識低下
- 市場機遇
- 新興市場的擴張
- 商用車混合動力
- 電動機的技術進步
- 與車輛電氣化相關的舉措
- 促進因素
- 成長潛力分析
- 監理情勢
- 北美洲
- 美國能源局
- SAE國際/美國國家標準協會(ANSI)
- 歐洲
- 歐盟委員會
- CharIN/Eurovent Certita Certification
- 亞太地區
- 新加坡建設局 (BCA)
- JIS-日本工業標準
- 拉丁美洲
- 巴西技術標準協會
- 國家能源委員會
- 中東和非洲
- 阿拉伯聯合大公國(阿拉伯聯合大公國)能源與基礎設施部
- 沙烏地阿拉伯標準、計量和品質組織
- 北美洲
- 波特五力分析
- PESTEL 分析
- 科技與創新趨勢
- 當前技術趨勢
- 新興技術
- 價格分析(基於初步調查)
- 對過去價格趨勢的分析
- 按球員類型分類的定價策略(高階/超值/成本加成)
- 成本細分分析
- 專利分析(基於初步研究)
- 生產能力和生產趨勢(基於初步調查)
- 按地區和主要生產商分類的已安裝產能
- 運轉率和擴張計劃
- 永續性和環境方面
- 永續計劃
- 減少廢棄物策略
- 生產中的能源效率
- 具有環保意識的舉措
- 關於碳足跡的考量
- 交易數據分析(基於付費資料庫)
- 進出口量及進口額趨勢
- 主要貿易走廊及關稅的影響
- 人工智慧和生成式人工智慧對市場的影響
- 利用人工智慧改造現有經營模式
- 針對特定領域的生成式人工智慧應用案例和實施藍圖
- 風險、限制和監管考量
- 預測假設和情境分析(基於初步研究)
- 基本案例-驅動複合年成長率的關鍵宏觀經濟與產業變量
- 樂觀情境-宏觀經濟與產業的順風
- 悲觀情景-宏觀經濟放緩或產業逆風
第4章 競爭情勢
- 介紹
- 企業市佔率分析
- 北美洲
- 歐洲
- 亞太地區
- 拉丁美洲
- 中東和非洲(MEA)
- 主要市場公司的競爭分析
- 競爭定位矩陣
- 主要進展
- 併購
- 夥伴關係與合作
- 新產品發布
- 業務拓展計劃及資金籌措
第5章 市場估計與預測:依組件分類,2022-2035年
- 電動機
- DC/DC轉換器
- 直流/交流轉換器(逆變器)
- 內燃機(ICE)
- 汽油引擎
- 柴油引擎
- 電池和能源儲存系統
- 鋰離子電池
- 全固態電池
- 鋰硫電池
- 電力電子
- 逆變器
- 控制器
- 電池管理系統(BMS)
- 傳動系統
- 混合動力專用傳輸
- 雙離合器變速箱(DCT)
- 無段變速箱(CVT)
第6章 市場估計與預測:依實施法分類,2022-2035年
- 全混合動力系統
- 高壓系統(200V至400V)
- 800V高性能系統
- 輕度混合動力系統
- 48V 輕混
- 12V微型混合動力
第7章 市場估價與預測:依車輛類型分類,2022-2035年
- 搭乘用車
- SUV
- 轎車
- 掀背車
- 商用車輛
- LCV
- MCV
- 大型商用車輛
第8章 市場估計與預測:依技術分類,2022-2035年
- 再生煞車系統
- 啟動停止系統
- 電動輔助系統
第9章 市場估計與預測:依應用領域分類,2022-2035年
- 城市交通
- 城際旅行
- 非公路用途
第10章 市場估價與預測:依地區分類,2022-2035年
- 北美洲
- 美國
- 加拿大
- 歐洲
- 德國
- 英國
- 法國
- 義大利
- 西班牙
- 北歐國家
- 俄羅斯
- 波蘭
- 羅馬尼亞
- 亞太地區
- 中國
- 印度
- 日本
- 韓國
- ANZ
- 越南
- 印尼
- 拉丁美洲
- 巴西
- 墨西哥
- 阿根廷
- 中東和非洲(MEA)
- 南非
- 沙烏地阿拉伯
- 阿拉伯聯合大公國
第11章:公司簡介
- 世界公司
- Aisin
- BorgWarner
- Continental
- Denso
- Hyundai Mobis
- Magna International
- Robert Bosch
- Toyota Motor
- Valeo
- ZF Friedrichshafen
- 當地公司
- Hitachi Astemo
- Infineon
- LG Chem
- Mitsubishi Electric
- Panasonic
- Schaeffler
- Siemens
- 新興企業
- Mahle
- Nidec
- YASA
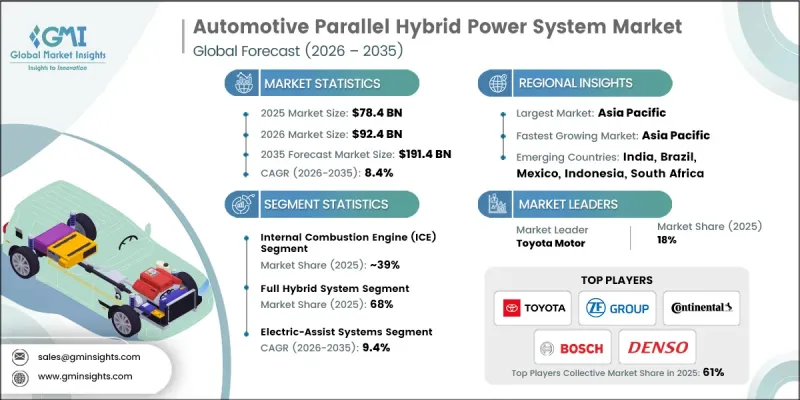
The Global Automotive Parallel Hybrid Power System Market was valued at USD 78.4 billion in 2025 and is estimated to grow at a CAGR of 8.4% to reach USD 191.4 billion by 2035.
Rising regulatory pressure on fleet average greenhouse gas emissions and vehicle fuel economy is compelling automakers to adopt parallel hybrid systems as a cost-effective strategy to reduce emissions without fully transitioning to battery electric vehicles. Parallel hybrids offer a practical solution to improve fuel efficiency in urban and stop-and-go driving conditions, particularly for passenger cars, taxis, and last-mile delivery vehicles. These systems combine regenerative braking, electric motor assistance, and optimized internal combustion engines (ICE) to reduce fuel consumption and provide long-term operational cost savings. Growing urbanization, fluctuating oil prices, and increasing demand for sustainable mobility further strengthen the adoption of parallel hybrid vehicles. OEMs and fleet operators are investing in hybrid solutions that balance environmental compliance with performance, durability, and cost efficiency.
| Market Scope | |
|---|---|
| Start Year | 2025 |
| Forecast Year | 2026-2035 |
| Start Value | $78.4 Billion |
| Forecast Value | $191.4 Billion |
| CAGR | 8.4% |
The internal combustion engines segment held 39% share in 2025 and is projected to grow at a CAGR of 7.1% through 2035. ICE units in parallel hybrid vehicles are becoming smaller, more efficient, and integrated with turbochargers, lightweight materials, and advanced thermal management. Regenerative braking and sophisticated control software are enhancing torque assistance, fuel efficiency, and emission reductions, while providing smooth transitions between electric and combustion modes. These technological improvements ensure consistent performance under varied driving conditions and improve overall powertrain efficiency.
The full hybrid systems segment held a 68% share in 2025 and is expected to grow at a CAGR of 8% through 2035. Full hybrid solutions are favored by consumers seeking fuel-efficient SUVs and passenger cars, particularly as governments continue to offer financial incentives for hybrid adoption. OEMs are investing in better integration of battery systems with ICE components, optimizing energy recovery, and enhancing electric assist performance. These developments increase fuel economy, support emission reduction targets, and make full hybrid systems one of the fastest-growing market segments.
U.S. Automotive Parallel Hybrid Power System Market reached USD 17.8 billion in 2025. Increased adoption of mild and full hybrid sedans and SUVs is driven by urban commuters, federal incentives, and rising consumer awareness of environmental impacts. Fleet operators are incorporating hybrid vehicles to reduce operational costs and meet emission regulations. Manufacturers are enhancing regenerative braking, electric assist systems, and hybrid powertrain efficiency while improving the driving experience, which is driving widespread acceptance of hybrid solutions across private and commercial fleets.
Major players operating in the Global Automotive Parallel Hybrid Power System Market include Aisin, BorgWarner, Continental, Denso, Hyundai Mobis, Magna International, Robert Bosch, Toyota Motor, Valeo, and ZF Friedrichshafen. Companies in the Global Automotive Parallel Hybrid Power System Market are pursuing strategies such as expanding R&D for high-efficiency hybrid components, integrating lightweight materials and advanced electronics, and developing modular full and mild hybrid platforms. They are forming strategic partnerships with OEMs to accelerate vehicle adoption and comply with emission standards. Firms are also investing in software solutions for optimized energy management, regenerative braking, and torque assistance. Targeted regional expansion, local manufacturing, and aftermarket support enhance market penetration. Additionally, offering cost-effective, fuel-efficient hybrid solutions tailored for urban fleets and passenger vehicles strengthens brand presence, drives consumer preference, and ensures long-term competitive advantage in a rapidly evolving automotive landscape.
Table of Contents
Chapter 1 Methodology
- 1.1 Research approach
- 1.2 Quality commitments
- 1.3 GMI AI policy & data integrity commitment
- 1.4 Research trail & confidence scoring
- 1.4.1 Research trail components
- 1.4.2 Scoring components
- 1.5 Data collection
- 1.5.1 Partial list of primary sources
- 1.6 Data mining sources
- 1.6.1 Paid sources
- 1.7 Base estimates and calculations
- 1.7.1 Base year calculation
- 1.8 Forecast model
- 1.9 Research transparency addendum
Chapter 2 Executive Summary
- 2.1 Industry 360° synopsis
- 2.2 Key market trends
- 2.2.1 Regional
- 2.2.2 Component
- 2.2.3 Propulsion
- 2.2.4 Vehicle
- 2.2.5 Technology
- 2.2.6 Application
- 2.3 TAM analysis, 2026-2035
- 2.4 CXO perspectives: Strategic imperatives
Chapter 3 Industry Insights
- 3.1 Industry ecosystem analysis
- 3.1.1 Supplier landscape
- 3.1.2 Profit margin
- 3.1.3 Cost structure
- 3.1.4 Value addition at each stage
- 3.1.5 Factor affecting the value chain
- 3.1.6 Disruptions
- 3.2 Industry impact forces
- 3.2.1 Growth drivers
- 3.2.1.1 Stringent emission regulations
- 3.2.1.2 Rising fuel prices
- 3.2.1.3 Growing urbanization and traffic congestion
- 3.2.1.4 Increasing demand for fuel-efficient vehicles
- 3.2.2 Industry pitfalls and challenges
- 3.2.2.1 High system cost
- 3.2.2.2 Limited consumer awareness
- 3.2.3 Market opportunities
- 3.2.3.1 Expansion in emerging markets
- 3.2.3.2 Commercial vehicle hybridization
- 3.2.3.3 Technological advancements in electric motors
- 3.2.3.4 Fleet electrification initiatives
- 3.2.1 Growth drivers
- 3.3 Growth potential analysis
- 3.4 Regulatory landscape
- 3.4.1 North America
- 3.4.1.1 U.S. Department of Energy
- 3.4.1.2 SAE International / American National Standards Institute (ANSI)
- 3.4.2 Europe
- 3.4.2.1 European Commission
- 3.4.2.2 CharIN / Eurovent Certita Certification
- 3.4.3 Asia Pacific
- 3.4.3.1 BCA - Building and Construction Authority (Singapore)
- 3.4.3.2 JIS - Japanese Industrial Standards
- 3.4.4 Latin America
- 3.4.4.1 Associacao Brasileira de Normas Tecnicas
- 3.4.4.2 Comision Nacional de Energia
- 3.4.5 Middle East & Africa
- 3.4.5.1 UAE Ministry of Energy and Infrastructure
- 3.4.5.2 Saudi Standards, Metrology and Quality Organization
- 3.4.1 North America
- 3.5 Porter's analysis
- 3.6 PESTEL analysis
- 3.7 Technology and innovation landscape
- 3.7.1 Current technological trends
- 3.7.2 Emerging technologies
- 3.8 Pricing Analysis (Driven by Primary Research)
- 3.8.1 Historical Price Trend Analysis
- 3.8.2 Pricing Strategy by Player Type (Premium / Value / Cost-plus)
- 3.9 Cost breakdown analysis
- 3.10 Patent analysis (Driven by Primary Research)
- 3.11 Capacity & Production Landscape (Driven by Primary Research)
- 3.11.1 Installed Capacity by Region & Key Producer
- 3.11.2 Capacity Utilization Rates & Expansion Pipelines
- 3.12 Sustainability and environmental aspects
- 3.12.1 Sustainable practices
- 3.12.2 Waste reduction strategies
- 3.12.3 Energy efficiency in production
- 3.12.4 Eco-friendly initiatives
- 3.12.5 Carbon footprint considerations
- 3.13 Trade Data Analysis (Driven by Paid Database)
- 3.13.1 Import/Export Volume & Value Trends
- 3.13.2 Key Trade Corridors & Tariff Impact
- 3.14 Impact of AI & Generative AI on the Market
- 3.14.1 AI-Driven Disruption of Existing Business Models
- 3.14.2 GenAI Use Cases & Adoption Roadmap by Segment
- 3.14.3 Risks, limitations & regulatory considerations
- 3.15 Forecast assumptions & scenario analysis (Driven by Primary Research)
- 3.15.1 Base Case - key macro & industry variables driving CAGR
- 3.15.2 Optimistic Scenarios - Favorable macro and industry tailwinds
- 3.15.3 Pessimistic Scenario - Macroeconomic slowdown or industry headwinds
Chapter 4 Competitive Landscape, 2025
- 4.1 Introduction
- 4.2 Company market share analysis
- 4.2.1 North America
- 4.2.2 Europe
- 4.2.3 Asia Pacific
- 4.2.4 LATAM
- 4.2.5 MEA
- 4.3 Competitive analysis of major market players
- 4.4 Competitive positioning matrix
- 4.5 Key developments
- 4.5.1 Mergers & acquisitions
- 4.5.2 Partnerships & collaborations
- 4.5.3 New product launches
- 4.5.4 Expansion plans and funding
Chapter 5 Market Estimates & Forecast, By Component, 2022 - 2035 ($Mn, Mn Units)
- 5.1 Key trends
- 5.2 Electric Motor
- 5.2.1 DC/DC Converter
- 5.2.2 DC/AC Converter (Inverter)
- 5.3 Internal combustion engine (ICE)
- 5.3.1 Gasoline Engine
- 5.3.2 Diesel Engine
- 5.4 Battery & energy storage systems
- 5.4.1 Lithium-ion Batteries
- 5.4.2 Solid-State Batteries
- 5.4.3 Lithium-Sulphur Batteries
- 5.5 Power electronics
- 5.5.1 Inverters
- 5.5.2 Controllers
- 5.5.3 Battery Management Systems (BMS)
- 5.6 Transmission system
- 5.6.1 Dedicated Hybrid Transmissions
- 5.6.2 Dual-Clutch Transmissions (DCT)
- 5.6.3 Continuously Variable Transmissions (CVT)
Chapter 6 Market Estimates & Forecast, By Propulsion, 2022 - 2035 ($Mn, Mn Units)
- 6.1 Key trends
- 6.2 Full Hybrid System
- 6.2.1 High-Voltage Systems (200V-400V)
- 6.2.2 800V High-Performance Systems
- 6.3 Mild Hybrid System
- 6.3.1 48V Mild Hybrid
- 6.3.2 12V Micro Hybrid
Chapter 7 Market Estimates & Forecast, By Vehicle, 2022 - 2035 ($Mn, Mn Units)
- 7.1 Key trends
- 7.2 Passenger cars
- 7.2.1 SUV
- 7.2.2 Sedan
- 7.2.3 Hatchback
- 7.3 Commercial vehicle
- 7.3.1 LCV
- 7.3.2 MCV
- 7.3.3 HCV
Chapter 8 Market Estimates & Forecast, By Technology, 2022 - 2035 ($Mn, Mn Units)
- 8.1 Key trends
- 8.2 Regenerative braking systems
- 8.3 Start-stop system
- 8.4 Electric-assist systems
Chapter 9 Market Estimates & Forecast, By Application, 2022 - 2035 ($Mn, Mn Units)
- 9.1 Key trends
- 9.2 Urban transportation
- 9.3 Intercity travel
- 9.4 Off-highway applications
Chapter 10 Market Estimates & Forecast, By Region, 2022 - 2035 ($Mn, Mn Units)
- 10.1 Key trends
- 10.2 North America
- 10.2.1 US
- 10.2.2 Canada
- 10.3 Europe
- 10.3.1 Germany
- 10.3.2 UK
- 10.3.3 France
- 10.3.4 Italy
- 10.3.5 Spain
- 10.3.6 Nordics
- 10.3.7 Russia
- 10.3.8 Poland
- 10.3.9 Romania
- 10.4 Asia Pacific
- 10.4.1 China
- 10.4.2 India
- 10.4.3 Japan
- 10.4.4 South Korea
- 10.4.5 ANZ
- 10.4.6 Vietnam
- 10.4.7 Indonesia
- 10.5 Latin America
- 10.5.1 Brazil
- 10.5.2 Mexico
- 10.5.3 Argentina
- 10.6 MEA
- 10.6.1 South Africa
- 10.6.2 Saudi Arabia
- 10.6.3 UAE
Chapter 11 Company Profiles
- 11.1 Global companies
- 11.1.1 Aisin
- 11.1.2 BorgWarner
- 11.1.3 Continental
- 11.1.4 Denso
- 11.1.5 Hyundai Mobis
- 11.1.6 Magna International
- 11.1.7 Robert Bosch
- 11.1.8 Toyota Motor
- 11.1.9 Valeo
- 11.1.10 ZF Friedrichshafen
- 11.2 Regional players
- 11.2.1 Hitachi Astemo
- 11.2.2 Infineon
- 11.2.3 LG Chem
- 11.2.4 Mitsubishi Electric
- 11.2.5 Panasonic
- 11.2.6 Schaeffler
- 11.2.7 Siemens
- 11.3 Emerging players
- 11.3.1 Mahle
- 11.3.2 Nidec
- 11.3.3 YASA
 全球混合動力傳動系統市場規模、佔有率、趨勢和成長分析報告(2026-2034)
 混合動力傳動系統市場-全球產業規模、佔有率、趨勢、機會與預測:按動力傳動系統類型、車輛類型、地區和競爭格局分類,2021-2031年
 輕度混合動力車市場規模、佔有率和成長分析(按容量、車輛類型、電池類型和地區分類)—2026-2033年產業預測
 混合動力自行車市場按類型、零件、齒輪類型、懸吊類型、車架材料、最終用戶和分銷管道分類 - 2025-2030 年全球預測
 全球混合動力傳動系統市場
 全球輕度混合動力車市場評估:依車型、容量類型、電池類型、地區、機會及預測,2018-2032
 非公路電動車零件市場機會、成長動力、產業趨勢分析及 2025 - 2034 年預測全球混合動力自行車市場-按產品、地區和預測的市場規模
 輕度混合動力車:市場佔有率分析、產業趨勢與統計、成長預測(2025-2030 年)
 輕度混合動力車市場:按電池容量、車輛類型和地區分類