


 |
市場調查報告書
商品編碼
1998747
智慧型運輸收費系統市場機會、成長促進因素、產業趨勢分析及預測(2026-2035年)Advanced Transportation Pricing System Market Opportunity, Growth Drivers, Industry Trend Analysis, and Forecast 2026 - 2035 |
||||||
2025 年全球智慧型運輸票價系統市場價值 80 億美元,預計到 2035 年將以 11.2% 的複合年成長率成長至 228 億美元。
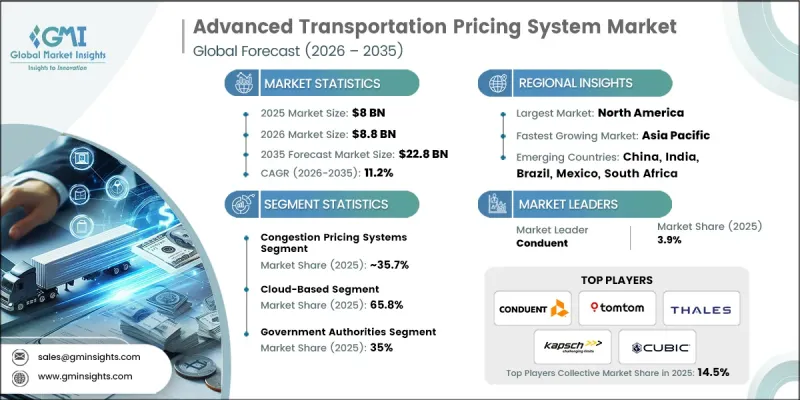
快速的都市化、不斷成長的車輛保有量以及主要城市日益嚴重的交通堵塞,正在推動對先進收費解決方案的需求。政府和私人營運商正在實施電子收費、里程監控和動態定價模式,以有效管理道路使用、緩解擁塞並創造收入。對擴充性、技術主導的基礎設施的需求,以及適用於高速公路和都市區道路網路的需求,也在推動市場成長。即時交通監控、數據分析和自動收費計算引擎使管理部門能夠最佳化交通出行,同時支援智慧城市建設,這使得先進的收費系統成為現代城市規劃中不可或缺的工具。全球向無障礙和自由流動收費的轉變正在改變收費解決方案的實施方式。全自動多車道收費系統正在推動對軟體、執法解決方案和定價引擎的需求。車輛偵測、數據處理和支付技術的進步正在提高這些系統的準確性和效率。無線射頻識別 (RFID)、自動車牌識別和車輛分類技術的改進,在降低系統供應商營運成本的同時,實現了更精準的定價。
| 市場範圍 | |
|---|---|
| 開始年份 | 2025 |
| 預測年份 | 2026-2035 |
| 起始金額 | 80億美元 |
| 預測金額 | 228億美元 |
| 複合年成長率 | 11.2% |
預計到2025年,堵塞收費方案將佔總市場佔有率的35.7%,並在2035年之前以11.6%的複合年成長率成長。這些系統正在主要都市區道路和城市區域實施,旨在為交通管理、排放氣體和改善公共交通提供資金籌措。政府部門受益於空氣品質的改善、交通流量的最佳化和永續的產生收入,擁塞收費方案已成為ATPS解決方案的關鍵策略組成部分。
預計到 2025 年,基於雲端的採用細分市場將佔 65.8% 的市場佔有率,並從 2026 年到 2035 年以 11.4% 的複合年成長率成長。雲端解決方案可降低營運成本,實現即時系統更新,並提供高度擴充性的基礎設施,使交通管理部門能夠比使用傳統的本地系統更有效地管理收費和擁塞收費。
美國智慧型運輸系統(EES)市場預計到2025年將達23億美元。美國市場的擴張主要得益於聯邦、州和地方政府的各項舉措,以及私人企業實施電子收費、堵塞收費和里程監控等技術的積極活動。電動車的興起導致燃油稅收入下降,從而增加了對替代性高速公路資金籌措方案的需求;同時,日益嚴重的都市區堵塞也推動了對創新型交通管理和專項交通計劃資金的需求。
目錄
第1章:調查方法
第2章執行摘要
第3章業界考察
- 產業生態系分析
- 供應商情況
- 利潤率
- 成本結構
- 每個階段增加的價值
- 影響價值鏈的因素
- 中斷
- 影響產業的因素
- 成長促進因素
- 擴大智慧城市與旅遊解決方案的應用
- 擴大交通運輸系統中的官民合作關係
- 政府為促進永續交通基礎設施和政策所做的努力
- 隨著都市區交通堵塞日益嚴重,高效率的交通管理解決方案需求日益成長。
- 產業潛在風險與挑戰
- 高昂的初始設定和維護成本
- 消費者對動態定價模式的抗拒情緒
- 市場機遇
- 與智慧城市基礎建設的融合
- 對永續和環保交通方式的需求日益成長
- 物聯網、人工智慧和巨量資料分析的進展
- 擴大官民合作關係(PPP)在交通運輸計劃的應用
- 成長促進因素
- 成長潛力分析
- 監理情勢
- 北美洲
- 聯邦公路管理局 (FHWA) - 通行費和定價計劃
- E-ZPass跨機構小組 - ETC互通性標準
- 加拿大:加拿大運輸部-智慧型運輸系統(ITS) 標準
- 歐洲
- 歐洲電子收費服務 (EETS) - 歐盟指令 2019/520
- 歐盟智慧交通系統指令(2010/40/EU)及相關授權條例
- 亞太地區
- 中國:交通運輸部 - ETC 國家標準(GB/T 標準)
- 印度:印度國家公路管理局 (NHAI) - FASTag 標準
- 拉丁美洲
- 巴西:ANTT(國家陸路交通管理局)的收費規定
- 墨西哥:SCT - 基礎設施、通訊和運輸部
- 中東和非洲
- 阿拉伯聯合大公國:道路運輸管理局 (RTA) - 收費系統監管
- 沙烏地阿拉伯:SASO和運輸部-道路通行費標準
- 非洲聯盟:非洲基礎建設發展計畫(PIDA)
- 北美洲
- 波特五力分析
- PESTEL 分析
- 科技與創新趨勢
- 當前技術趨勢
- 新興技術
- 經營模式和獲利框架
- 收入模式
- 價值鍊和生態系統
- 打入市場策略
- 品質標準、合規性和產品風險
- 零件安全和法規遵循性
- 與產品性能和耐用性相關的風險
- 商業營運和供應鏈中的風險
- ATPS平台架構
- 多層ATPS系統結構模型
- V2I(車路通訊)與互聯出行的融合。
- 專利分析(基於初步研究)
- 價格分析(基於初步調查)
- 對過去價格趨勢的分析
- 按業務類型分類的定價策略
- 生產統計
- 生產基地
- 消費中心
- 交易數據分析(基於付費資料庫)
- 進出口量及進口額趨勢
- 主要貿易走廊和關稅的影響
- 永續性和環境方面
- 永續實踐
- 生產和營運中的能源效率
- 關於碳足跡的考量
- GenAI 應用案例和實施藍圖:按細分市場分類
- 胎面花紋設計與生成
- 客戶服務聊天機器人和技術支援
- 行銷內容創作
- 風險、限制和監管考量
- GenAI 應用案例和實施藍圖:按細分市場分類
- 預測假設和情境分析(基於初步研究)
- 基本案例-驅動複合年成長率的關鍵宏觀經濟與產業變量
- 樂觀情境-宏觀經濟與產業的順風
- 悲觀情景-宏觀經濟放緩或產業逆風
第4章 競爭情勢
- 介紹
- 企業市佔率分析
- 北美洲
- 歐洲
- 亞太地區
- 拉丁美洲
- 中東和非洲(MEA)
- 主要市場公司的競爭分析
- 競爭定位矩陣
- 戰略展望矩陣
- 主要進展
- 併購
- 夥伴關係與合作
- 新產品發布
- 業務拓展計劃及資金籌措
第5章 市場估計與預測:依解法分類,2022-2035年
- 交通堵塞收費系統
- 里程(VMT)監測
- 電子收費系統(ETC)
- 動態票價管理
- 停車定價與管理
- 其他解決方案
第6章 市場估計與預測:依組件分類,2022-2035年
- 硬體
- 應答器/車載單元
- 車牌辨識/自動車牌辨識攝影機
- RFID讀取器
- 通訊設備
- 其他
- 軟體
- 後勤部門收費平台
- 支付結算軟體
- 交通堵塞收費軟體
- 其他
- 服務
- 專業服務
- 託管服務
第7章 市場估計與預測:依發展階段分類,2022-2035年
- 基於雲端的
- 現場
第8章 市場估計與預測:依應用領域分類,2022-2035年
- 城市交通壅塞管理
- 與智慧城市的融合
- 貨運和物流費用
- 停車管理
- 其他
第9章 市場估計與預測:依最終用途分類,2022-2035年
- 政府機構
- 私人運輸公司
- 物流/車輛管理公司
- 車主
第10章 市場估價與預測:依地區分類,2022-2035年
- 北美洲
- 美國
- 加拿大
- 歐洲
- 德國
- 英國
- 法國
- 義大利
- 西班牙
- 北歐國家
- 俄羅斯
- 挪威
- 丹麥
- 荷蘭
- 比利時
- 亞太地區
- 中國
- 印度
- 日本
- 韓國
- ANZ
- 越南
- 印尼
- 新加坡
- 馬來西亞
- 泰國
- 拉丁美洲
- 巴西
- 墨西哥
- 阿根廷
- 中東和非洲
- 南非
- 沙烏地阿拉伯
- 阿拉伯聯合大公國
第11章:公司簡介
- 世界公司
- Conduent
- Cubic
- Ericsson
- IBM
- Fluor
- Hewlett Packard
- International Road Dynamics
- Kapsch TrafficCom
- Siemens Mobility
- TomTom
- TransCore
- Worldline
- 當地公司
- ACS
- INIT
- Iteris
- Mobiliya
- Moovit
- Q-Free
- TollPlus
- Viaplus
The Global Advanced Transportation Pricing System Market was valued at USD 8 billion in 2025 and is estimated to grow at a CAGR of 11.2% to reach USD 22.8 billion by 2035.
Rapid urbanization, rising vehicle ownership, and escalating traffic congestion in major cities are driving the need for sophisticated pricing solutions. Governments and private operators are adopting electronic toll collection, vehicle miles traveled monitoring, and dynamic pricing models to better manage road usage, reduce congestion, and generate revenue. The market is also being propelled by the requirement for scalable, technology-driven infrastructure that can serve both highways and urban road networks. Real-time traffic monitoring, data analytics, and automated pricing engines are enabling authorities to optimize mobility while supporting smart city initiatives, making advanced transportation pricing systems a critical tool for modern urban planning. The global shift toward barrier-free and free-flow tolling is transforming how transportation pricing solutions are deployed. Fully automated, multi-lane tolling systems are driving demand for software, enforcement solutions, and pricing engines. Advances in vehicle detection, data processing, and payment technologies are enhancing the accuracy and efficiency of these systems. Improvements in RFID, automatic license plate recognition, and vehicle classification are enabling more precise pricing while lowering operational costs for system providers.
| Market Scope | |
|---|---|
| Start Year | 2025 |
| Forecast Year | 2026-2035 |
| Start Value | $8 Billion |
| Forecast Value | $22.8 Billion |
| CAGR | 11.2% |
The congestion pricing systems segment held a 35.7% share in 2025 and is expected to grow at a CAGR of 11.6% through 2035. These systems are increasingly implemented in urban corridors and citywide zones to manage traffic, reduce emissions, and fund public transport improvements. Authorities benefit from improved air quality, optimized traffic flow, and sustainable revenue generation, establishing congestion pricing as a key strategic segment of ATPS solutions.
The cloud-based deployment segment held 65.8% share in 2025 and is projected to grow at a CAGR of 11.4% from 2026 to 2035. Cloud solutions reduce operational costs, enable real-time system updates, and provide scalable infrastructure, allowing transport authorities to manage tolling and congestion pricing more efficiently than traditional on-premise systems.
U.S. Advanced Transportation Pricing System Market reached USD 2.3 billion in 2025. Expansion in the U.S. is fueled by federal, state, and municipal initiatives, along with private operators implementing electronic tolling, congestion pricing, and vehicle miles traveled monitoring. Declining fuel tax revenues due to electric vehicle adoption have created a need for alternative highway funding solutions, while rising urban congestion has increased demand for innovative traffic management and dedicated transportation project funding.
Key players operating in the Global Advanced Transportation Pricing System Market include Conduent, Thales, Kapsch TrafficCom, TomTom, Cubic, TransCore, IBM, Siemens Mobility, Q Free, and International Road Dynamics. Key strategies adopted by companies in the Global Advanced Transportation Pricing System Market include investing in R&D to develop integrated, AI-driven pricing engines and real-time monitoring platforms. Firms are focusing on cloud-based and scalable solutions that improve operational efficiency and reduce costs for transport authorities. Strategic partnerships with government agencies and private concessionaires help expand geographic reach and project adoption. Companies are also enhancing cybersecurity, compliance, and interoperability to meet regulatory standards and integrate with smart mobility ecosystems. Market leaders are emphasizing advanced data analytics, predictive traffic management, and IoT-enabled devices to strengthen customer loyalty and maintain competitive advantage in both developed and emerging markets.
Table of Contents
Chapter 1 Methodology
- 1.1 Research approach
- 1.2 Quality commitments
- 1.2.1 GMI AI policy & data integrity commitment
- 1.3 Research trail & confidence scoring
- 1.3.1 Research trail components
- 1.3.2 Scoring components
- 1.4 Data collection
- 1.4.1 Partial list of primary sources
- 1.5 Data mining sources
- 1.5.1 Paid sources
- 1.6 Base estimates and calculations
- 1.6.1 Base year calculation
- 1.7 Forecast model
- 1.8 Research transparency addendum
Chapter 2 Executive Summary
- 2.1 Industry 360° synopsis
- 2.2 Key market trends
- 2.2.1 Regional
- 2.2.2 Solution
- 2.2.3 Component
- 2.2.4 Deployment
- 2.2.5 Application
- 2.2.6 End Use
- 2.3 TAM analysis, 2026-2035
- 2.4 CXO perspectives: Strategic imperatives
- 2.4.1 Executive decision points
- 2.4.2 Critical success factors
- 2.5 Future outlook
- 2.6 Strategic recommendations
Chapter 3 Industry Insights
- 3.1 Industry ecosystem analysis
- 3.1.1 Supplier landscape
- 3.1.2 Profit margin
- 3.1.3 Cost structure
- 3.1.4 Value addition at each stage
- 3.1.5 Factor affecting the value chain
- 3.1.6 Disruptions
- 3.2 Industry impact forces
- 3.2.1 Growth drivers
- 3.2.1.1 Increasing adoption of smart city and mobility solutions
- 3.2.1.2 Expansion of public-private partnerships in transportation systems
- 3.2.1.3 Government initiatives promoting sustainable transport infrastructure and policies
- 3.2.1.4 Rising urban congestion demands efficient traffic management solutions
- 3.2.2 Industry pitfalls and challenges
- 3.2.2.1 High initial implementation and maintenance costs
- 3.2.2.2 Resistance from consumers to dynamic pricing models
- 3.2.3 Market opportunities
- 3.2.3.1 Integration with smart city infrastructure
- 3.2.3.2 Rising demand for sustainable and eco-friendly transport
- 3.2.3.3 Advancements in IoT, AI, and big data analytics
- 3.2.3.4 Expansion of public-private partnerships (PPP) in transport projects
- 3.2.1 Growth drivers
- 3.3 Growth potential analysis
- 3.4 Regulatory landscape
- 3.4.1 North America
- 3.4.1.1 Federal Highway Administration (FHWA) - Tolling and Pricing Program
- 3.4.1.2 E-ZPass Interagency Group - ETC Interoperability Standards
- 3.4.1.3 Canada: Transport Canada - Intelligent Transportation Systems Standards
- 3.4.2 Europe
- 3.4.2.1 European Electronic Toll Service (EETS) - EU Directive 2019/520
- 3.4.2.2 EU Intelligent Transport Systems Directive (2010/40/EU) and Delegated Regulations
- 3.4.3 Asia Pacific
- 3.4.3.1 China: Ministry of Transport - ETC National Standards (GB/T Standards)
- 3.4.3.2 India: National Highways Authority of India (NHAI) - FASTag Standards
- 3.4.4 Latin America
- 3.4.4.1 Brazil: ANTT - National Land Transportation Agency Tolling Regulation
- 3.4.4.2 Mexico: SCT - Secretariat of Infrastructure, Communications and Transport
- 3.4.5 Middle East & Africa
- 3.4.5.1 UAE: Roads and Transport Authority (RTA) - Toll System Regulations
- 3.4.5.2 Saudi Arabia: SASO and Ministry of Transport - Road Pricing Standards
- 3.4.5.3 African Union: Programme for Infrastructure Development in Africa (PIDA)
- 3.4.1 North America
- 3.5 Porter's analysis
- 3.6 PESTEL analysis
- 3.7 Technology and innovation landscape
- 3.7.1 Current technological trends
- 3.7.2 Emerging technologies
- 3.8 Business Models and Monetization Framework
- 3.8.1 Revenue Models
- 3.8.2 Value Chain and Ecosystem
- 3.8.3 Go-to-Market Strategy
- 3.9 Quality Standards, Compliance, and Product Risk
- 3.9.1 Component Safety and Regulatory Compliance
- 3.9.2 Product Performance and Durability Risk
- 3.9.3 Operational and Supply Chain Risks
- 3.10 ATPS Platform Architecture
- 3.10.1 Multi-Layer ATPS System Architecture Models
- 3.10.2 Vehicle-to-Infrastructure and Connected Mobility Integration
- 3.11 Patent analysis (Driven by Primary Research)
- 3.12 Pricing Analysis (Driven by Primary Research)
- 3.12.1 Historical Price Trend Analysis
- 3.12.2 Pricing Strategy by Player Type
- 3.13 Production statistics
- 3.13.1 Production hubs
- 3.13.2 Consumption hubs
- 3.14 Trade Data Analysis (Driven by Paid Database)
- 3.14.1 Import/Export Volume & Value Trends
- 3.14.2 Key Trade Corridors & Tariff Impact
- 3.15 Sustainability and environmental aspects
- 3.15.1 Sustainable Manufacturing Practices
- 3.15.2 Energy Efficiency in Production and Operations
- 3.15.3 Carbon footprint considerations
- 3.15.3.1 GenAI use cases & adoption roadmap by segment
- 3.15.3.1.1 Tread pattern design generation
- 3.15.3.1.2 Customer service chatbots & technical support
- 3.15.3.1.3 Marketing content creation
- 3.15.3.1.4 Risks, limitations & regulatory considerations
- 3.15.3.1 GenAI use cases & adoption roadmap by segment
- 3.16 Forecast assumptions & scenario analysis (Driven by Primary Research)
- 3.16.1 Base Case - key macro & industry variables driving CAGR
- 3.16.2 Optimistic Scenarios - Favorable Macro and Industry Tailwinds
- 3.16.3 Pessimistic Scenario - Macroeconomic slowdown or industry headwinds
Chapter 4 Competitive Landscape, 2025
- 4.1 Introduction
- 4.2 Company market share analysis
- 4.2.1 North America
- 4.2.2 Europe
- 4.2.3 Asia Pacific
- 4.2.4 LATAM
- 4.2.5 MEA
- 4.3 Competitive analysis of major market players
- 4.4 Competitive positioning matrix
- 4.5 Strategic outlook matrix
- 4.6 Key developments
- 4.6.1 Mergers & acquisitions
- 4.6.2 Partnerships & collaborations
- 4.6.3 New product launches
- 4.6.4 Expansion plans and funding
Chapter 5 Market Estimates & Forecast, By Solution, 2022 - 2035 ($Mn)
- 5.1 Key trends
- 5.2 Congestion Pricing Systems
- 5.3 Vehicle Miles Traveled (VMT) Monitoring
- 5.4 Electronic Toll Collection (ETC)
- 5.5 Dynamic Fare Management
- 5.6 Parking Pricing & Management
- 5.7 Other Solutions
Chapter 6 Market Estimates & Forecast, By Component, 2022 - 2035 ($Mn, Units)
- 6.1 Key trends
- 6.2 Hardware
- 6.2.1 Transponders / OBUs
- 6.2.2 ANPR / ALPR Cameras
- 6.2.3 RFID Readers
- 6.2.4 Communication Equipment
- 6.2.5 Others
- 6.3 Software
- 6.3.1 Back-Office Tolling Platform
- 6.3.2 Payment & Settlement Software
- 6.3.3 Congestion Pricing Software
- 6.3.4 Others
- 6.4 Services
- 6.4.1 Professional Services
- 6.4.2 Managed Services
Chapter 7 Market Estimates & Forecast, By Deployment, 2022 - 2035 ($Mn)
- 7.1 Key trends
- 7.2 Cloud-based
- 7.3 On-premise
Chapter 8 Market Estimates & Forecast, By Application, 2022 - 2035 ($Mn)
- 8.1 Key trends
- 8.2 Urban Congestion Management
- 8.3 Smart City Integration
- 8.4 Freight & Logistics Pricing
- 8.5 Parking Management
- 8.6 Others
Chapter 9 Market Estimates & Forecast, By End Use, 2022 - 2035 ($Mn)
- 9.1 Key trends
- 9.2 Government Authorities
- 9.3 Private Transport Companies
- 9.4 Logistics / Fleet Operators
- 9.5 Vehicle Owners
Chapter 10 Market Estimates & Forecast, By Region, 2022 - 2035 ($Mn)
- 10.1 Key trends
- 10.2 North America
- 10.2.1 US
- 10.2.2 Canada
- 10.3 Europe
- 10.3.1 Germany
- 10.3.2 UK
- 10.3.3 France
- 10.3.4 Italy
- 10.3.5 Spain
- 10.3.6 Nordics
- 10.3.7 Russia
- 10.3.8 Norway
- 10.3.9 Denmark
- 10.3.10 Netherlands
- 10.3.11 Belgium
- 10.4 Asia Pacific
- 10.4.1 China
- 10.4.2 India
- 10.4.3 Japan
- 10.4.4 South Korea
- 10.4.5 ANZ
- 10.4.6 Vietnam
- 10.4.7 Indonesia
- 10.4.8 Singapore
- 10.4.9 Malaysia
- 10.4.10 Thailand
- 10.5 Latin America
- 10.5.1 Brazil
- 10.5.2 Mexico
- 10.5.3 Argentina
- 10.6 MEA
- 10.6.1 South Africa
- 10.6.2 Saudi Arabia
- 10.6.3 UAE
Chapter 11 Company Profiles
- 11.1 Global companies
- 11.1.1 Conduent
- 11.1.2 Cubic
- 11.1.3 Ericsson
- 11.1.4 IBM
- 11.1.5 Fluor
- 11.1.6 Hewlett Packard
- 11.1.7 International Road Dynamics
- 11.1.8 Kapsch TrafficCom
- 11.1.9 Siemens Mobility
- 11.1.10 TomTom
- 11.1.11 TransCore
- 11.1.12 Worldline
- 11.2 Regional players
- 11.2.1 ACS
- 11.2.2 INIT
- 11.2.3 Iteris
- 11.2.4 Mobiliya
- 11.2.5 Moovit
- 11.2.6 Q-Free
- 11.2.7 TollPlus
- 11.2.8 Viaplus
 固態固態電池市場:實用化(至2034年)-按電池類型、實用化階段、創新重點領域、應用和地區分類的全球分析電池先進材料市場預測至2034年—按材料類型、電池類型、應用、材料形狀、最終用戶和地區分類的全球分析
 先進電池市場:按化學成分、電芯形式、電池類型、應用和最終用戶分類-2026-2032年全球市場預測先進電池材料市場預測至2034年—全球材料類型、電池類型、形狀、技術、應用、最終用戶和區域分析
 全球先進電池市場規模、佔有率、趨勢和成長分析報告(2026-2034年)大型圓柱形電池雷射焊接市場:按雷射源類型、電池化學成分、電池容量、功率輸出、焊接技術和應用分類-全球預測,2026-2032年
 全球資料中心電池市場:市場規模、佔有率和趨勢分析(按電池類型、資料中心、應用和地區分類),細分市場預測(2026-2033 年)
 2026年全球先進電池技術市場報告2026年全球大型圓柱形電池市場報告
 先進電池技術市場-全球產業規模、佔有率、趨勢、機會與預測:按技術、最終用戶、地區和競爭對手分類,2021-2031年