


 |
市場調查報告書
商品編碼
1998688
電動車充電線市場機會、成長要素、產業趨勢分析及2026-2035年預測Electric Vehicle Charging Cable Market Opportunity, Growth Drivers, Industry Trend Analysis, and Forecast 2026 - 2035 |
||||||
全球電動車充電線市場預計到 2025 年將價值 19 億美元,預計到 2035 年將以 10.6% 的複合年成長率成長至 51 億美元。
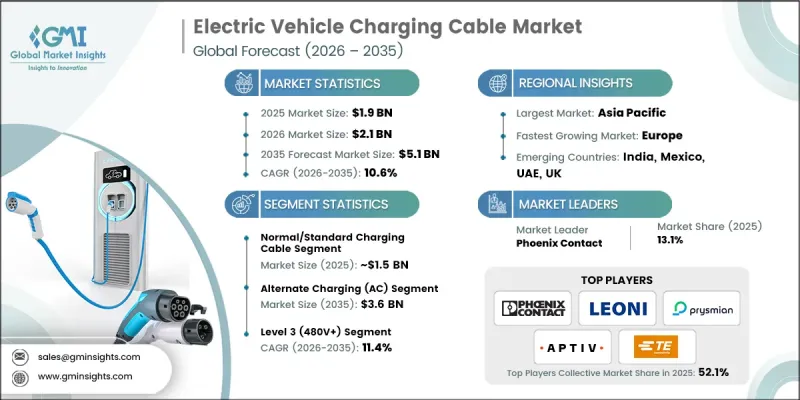
隨著電動車在全球日益普及,對可靠且高效的充電基礎設施的需求也穩定成長,充電線已成為電動車充電設備(EVSE)生態系統中不可或缺的一部分。這些線纜連接充電站和車輛,實現安全且有效率的能量傳輸。政府獎勵、更嚴格的排放氣體法規以及對電動車基礎設施的投資正在推動市場成長,而高功率連接器、多車型相容性和快速充電解決方案等方面的技術進步則進一步加速了這些線纜的普及應用。隨著公共和私人充電網路的快速擴張,製造商正致力於生產擴充性、耐用且用途廣泛的充電解決方案,以滿足全球日益成長的電動車需求。
| 市場範圍 | |
|---|---|
| 開始年份 | 2025 |
| 預測期 | 2026-2035 |
| 上市時的市場規模 | 19億美元 |
| 預計金額 | 51億美元 |
| 複合年成長率 | 10.6% |
標準或普通充電線佔80.7%的市場佔有率,預計到2025年市場規模將達到15億美元。大部分充電發生在家庭或職場,這些場所主要依賴交流充電基礎設施。標準充電線是購買新車或售後市場的首選,因為它們與市面上廣泛使用的交流壁掛式充電樁和公共交流充電樁完全相容。與直流快充相比,交流充電樁更高的普及率也鞏固了該細分市場的主導地位。
預計到2025年,交流電(AC)充電市佔率將達到75.6%,到2035年將達到36億美元。由於其成本效益高、基礎設施相容性強,且適用於家庭和職場,交流電充電仍然是絕大多數電動車車主的首選。在許多地區,尤其是在新興市場,交流電充電樁的數量遠超直流快充樁,這推動了該細分市場的持續成長。
美國電動車充電線纜市場預計到2025年將達到2.044億美元,並在2026年至2035年間以8.6%的複合年成長率成長。國內電動車充電網路的擴張、永續性以及聯邦政府計畫(例如旨在發展全國公共充電基礎設施的NEVI Formula計畫)正在推動線纜需求。高速公路沿線直流快速充電站的日益增加也進一步提升了對高功率直流電纜的需求。
目錄
第1章:調查方法
第2章執行摘要
第3章業界考察
- 生態系分析
- 供應商情況
- 利潤率
- 成本結構
- 每個階段增加的價值
- 影響價值鏈的因素
- 中斷
- 影響產業的因素
- 促進因素
- 電動車在全球範圍內的迅速普及以及電氣化的強制性實施
- 政府獎勵和對充電基礎設施的投資
- 快速充電和液冷技術的進步
- 消費者對便利充電解決方案的需求日益成長
- 產業潛在風險與挑戰
- 與溫度控管和散熱相關的挑戰
- 缺乏統一的連接器標準
- 市場機遇
- 擴建超快速充電網路(350kW 或以上)
- 電動車滲透率低的新興市場
- 輕量永續電纜材料的開發
- 促進因素
- 成長潛力分析
- 監理情勢
- 北美洲
- 美國電機工程規範(NEC-NFPA 70)
- UL解決方案
- CSA集團
- SAE International
- 歐洲
- 歐洲電工標準化委員會(CENELEC)
- 國際電工委員會(IEC)
- TUV Rheinland
- DIN
- 亞太地區
- 國家市場監督管理總局(中國)
- 中國國家標準化管理委員會(SAC)
- 印度標準局(BIS)
- 日本工業標準委員會(JISC)
- 拉丁美洲
- 巴西國家計量、品質與技術研究院(INMETRO)
- 標準化和認證協會(ANCE)
- 阿根廷標準化與認證協會(IRAM)
- 中東和非洲
- 沙烏地阿拉伯標準、計量和品質組織(SASO)
- ESMA(阿拉伯聯合大公國標準化和計量局)
- 南非標準局(SABS)
- 北美洲
- 投資與資金籌措分析
- 波特五力分析
- PESTEL 分析
- 科技與創新趨勢
- 目前技術
- 交流充電線(模式 2 和模式 3)
- 直流快速充電(50kW 至 250kW)
- 智慧充電和負載管理系統
- 標準化連接器技術(CCS、CHAdeMO、GB/T)
- 新興技術
- 超快充電線(350千瓦或更高)
- 輕巧靈活的電纜材料
- 水冷充電線
- 目前技術
- 價格分析(基於初步調查)
- 對過去價格趨勢的分析
- 按業務類型分類的定價策略(溢價/價值/成本加成)
- 專利趨勢(基於初步調查)
- 貿易數據分析(基於付費資料庫)
- 進出口量及進口額趨勢
- 主要貿易走廊及關稅的影響
- 生產能力和生產趨勢(基於初步調查)
- 按地區和主要製造商分類的已安裝產能
- 運轉率和擴張計劃
- 人工智慧和生成式人工智慧對市場的影響
- 利用人工智慧改造現有經營模式
- GenAI 各細分市場的應用案例與部署藍圖
- 風險、局限性和監管考量
- 電動車製造商的策略聯盟
- 交易週期分析
- 電動車充電線的平均使用壽命
- 使用模式和環境因素的影響
- 更換成本和經濟因素
- 技術升級對更換週期的影響
- 案例研究
- 預測假設和情境分析(基於初步研究)
- 基本案例-驅動複合年成長率的關鍵宏觀經濟與產業變量
- 樂觀情境-宏觀經濟與產業的順風
- 悲觀情景-宏觀經濟放緩或產業逆風
第4章 競爭情勢
- 介紹
- 企業市佔率分析
- 北美洲
- 歐洲
- 亞太地區
- 拉丁美洲
- 中東和非洲(MEA)
- 主要市場公司的競爭分析
- 競爭定位矩陣
- 主要進展
- 併購
- 夥伴關係與合作
- 新產品發布
- 業務拓展計劃及資金籌措
- 企業級分層基準測試
- 層級分類標準與選擇標準
- 按收入、地區和創新能力分類的層級定位矩陣。
第5章 市場估價與預測:依電纜類型分類,2022-2035年
- 標準充電線
- 高功率充電(HPC)線纜
- 標準/非冷卻式高功率充電 (HPC) 線纜
- 水冷式高功率充電線
第6章 市場估算與預測:依電源類型分類,2022-2035年
- 交流電充電(AC)
- 直流充電(DC)
第7章 市場估算與預測:依充電等級分類,2022-2035年
- 1級(120V)
- 二級(240V)
- 3級(480V或更高)
第8章 市場估算與預測:依連接器類型分類,2022-2035年
- Type 1
- 類型 2
- CCS 1
- CCS 2
- CHAdeMO
- GB/T
- NACS/特斯拉
第9章 市場估計與預測:依模式分類,2022-2035年
- 模式 1 和 2
- 模式 3
- 模式 4
第10章 市場估價與預測:依直徑分類,2022-2035年
- 10 mm
- 10~20 mm
- 20毫米或以上
第11章 市場估價與預測:依形狀分類,2022-2035年
- 直的
- 捲曲
第12章 市場估計與預測:依長度分類,2022-2035年
- 小於5米
- 5-10米
- 超過10米
第13章 市場估計與預測:依應用領域分類,2022-2035年
- 個人充電
- 公共充電
- 購物中心
- 飛機場
- 高速公路
- 商業停車場
- 其他
第14章 市場估價與預測:依銷售管道分類,2022-2035年
- OEM
- 售後市場
第15章 市場估計與預測:依地區分類,2022-2035年
- 北美洲
- 美國
- 加拿大
- 歐洲
- 德國
- 英國
- 法國
- 義大利
- 西班牙
- 比利時
- 俄羅斯
- 荷蘭
- 亞太地區
- 中國
- 印度
- 日本
- 韓國
- 澳洲
- 新加坡
- 馬來西亞
- 越南
- 泰國
- 拉丁美洲
- 巴西
- 墨西哥
- 阿根廷
- 哥倫比亞
- 中東和非洲(MEA)
- 南非
- 沙烏地阿拉伯
- 阿拉伯聯合大公國
第16章:公司簡介
- 世界公司
- Phoenix Contact
- TE Connectivity
- LEONI
- Prysmian
- Aptiv
- Huber+Suhner
- Dyden
- Coroplast
- BRUGG
- Tesla
- 當地公司
- Chengdu Khons
- Sinbon Electronics
- EV TEISON
- Guchen Electronics
- Manlon
- Pod Point
- 新興企業
- Juice Technology
- Webasto
- Masterplug
- Zencar
The Global Electric Vehicle Charging Cable Market was valued at USD 1.9 billion in 2025 and is estimated to grow at a CAGR of 10.6% to reach USD 5.1 billion by 2035.
The rising adoption of electric vehicles worldwide is driving strong demand for reliable and efficient charging infrastructure, with charging cables serving as a critical component of the EV supply equipment (EVSE) ecosystem. These cables link charging stations to vehicles, ensuring safe and efficient energy transfer. Government incentives, stricter emission regulations, and investments in EV infrastructure are supporting market growth, while technological advancements in high-power connectors, multi-vehicle compatibility, and faster charging solutions are further enhancing the adoption of these cables. With both public and private charging networks expanding rapidly, manufacturers are focusing on producing scalable, durable, and versatile charging solutions to accommodate the growing EV population globally.
| Market Scope | |
|---|---|
| Start Year | 2025 |
| Forecast Year | 2026-2035 |
| Start Value | $1.9 Billion |
| Forecast Value | $5.1 Billion |
| CAGR | 10.6% |
The normal or standard charging cable segment held 80.7% share, generating USD 1.5 billion in 2025. Most charging sessions occur at homes or workplaces, which primarily rely on AC charging infrastructure. Standard cables are fully compatible with widely deployed AC wall boxes and public AC chargers, making them the default choice for new EVs and aftermarket purchases. The broader availability of AC chargers compared to DC fast chargers drives the dominance of this segment.
The alternate current (AC) charging segment held 75.6% share in 2025 and is expected to reach USD 3.6 billion by 2035. AC charging remains the preferred choice for most EV owners due to cost-effectiveness, widespread infrastructure compatibility, and suitability for home and workplace use. In many regions, AC charging points significantly outnumber DC fast chargers, particularly in emerging markets, supporting the sustained growth of this segment.
U.S. Electric Vehicle Charging Cable Market reached USD 204.4 million in 2025 and is projected to grow at a CAGR of 8.6% between 2026 and 2035. Expansion of domestic EV charging networks, sustainability initiatives, and federal programs like the NEVI Formula Program, which aim to establish a nationwide public charging infrastructure, are driving cable demand. The increasing deployment of DC fast charging stations along highways is further boosting the requirement for high-power DC cables.
Key players operating in the Global Electric Vehicle Charging Cable Market include Phoenix Contact, TE Connectivity, Aptiv, Huber+Suhner, Sinbon Electronics, Prysmian, BRUGG, LEONI, Dyden, and Coroplast. Key strategies adopted by companies in the Electric Vehicle Charging Cable Market include developing high-performance connectors capable of supporting next-generation fast charging and grid integration. Manufacturers are investing in R&D to produce longer-lasting, weather-resistant, and multi-vehicle compatible cables. Strategic partnerships with EV manufacturers and charging station operators allow companies to expand distribution networks and enhance adoption. Emphasis on cost optimization, scalable production, and compliance with international safety standards helps firms maintain market leadership. Companies also focus on technological innovation, including smart monitoring and adaptive power management features, to differentiate their products in a rapidly evolving market.
Table of Contents
Chapter 1 Methodology
- 1.1 Research approach
- 1.2 Quality commitments
- 1.2.1 GMI AI policy & data integrity commitment
- 1.3 Research trail & confidence scoring
- 1.3.1 Research trail components
- 1.3.2 Scoring components
- 1.4 Data collection
- 1.4.1 Partial list of primary sources
- 1.5 Data mining sources
- 1.5.1 Paid sources
- 1.6 Base estimates and calculations
- 1.6.1 Base year calculation
- 1.7 Forecast model
- 1.8 Research transparency addendum
Chapter 2 Executive Summary
- 2.1 Industry 360° synopsis
- 2.2 Key market trends
- 2.2.1 Regional
- 2.2.2 Cable
- 2.2.3 Power Supply
- 2.2.4 Charging Level
- 2.2.5 Connector
- 2.2.6 Mode
- 2.2.7 Diameter
- 2.2.8 Shape
- 2.2.9 Length
- 2.2.10 Application
- 2.2.11 Sales Channel
- 2.3 TAM analysis, 2026-2035
- 2.4 CXO perspectives: Strategic imperatives
Chapter 3 Industry Insights
- 3.1 Industry ecosystem analysis
- 3.1.1 Supplier landscape
- 3.1.2 Profit margin
- 3.1.3 Cost structure
- 3.1.4 Value addition at each stage
- 3.1.5 Factor affecting the value chain
- 3.1.6 Disruptions
- 3.2 Industry impact forces
- 3.2.1 Growth drivers
- 3.2.1.1 Rapid global EV adoption & electrification mandates
- 3.2.1.2 Government incentives & charging infrastructure investments
- 3.2.1.3 Technological advancements in fast charging & liquid cooling
- 3.2.1.4 Growing consumer demand for convenient charging solutions
- 3.2.2 Industry pitfalls and challenges
- 3.2.2.1 Thermal management & heat dissipation challenges
- 3.2.2.2 Lack of universal connector standardization
- 3.2.3 Market opportunities
- 3.2.3.1 Expansion of ultra-fast charging networks (350kW+)
- 3.2.3.2 Emerging markets with low EV penetration rates
- 3.2.3.3 Development of lightweight & sustainable cable materials
- 3.2.1 Growth drivers
- 3.3 Growth potential analysis
- 3.4 Regulatory landscape
- 3.4.1 North America
- 3.4.1.1 National Electrical Code (NEC - NFPA 70)
- 3.4.1.2 UL Solutions
- 3.4.1.3 CSA Group
- 3.4.1.4 SAE International
- 3.4.2 Europe
- 3.4.2.1 European Committee for Electrotechnical Standardization (CENELEC)
- 3.4.2.2 International Electrotechnical Commission (IEC)
- 3.4.2.3 TUV Rheinland
- 3.4.2.4 DIN
- 3.4.3 Asia Pacific
- 3.4.3.1 State Administration for Market Regulation (China)
- 3.4.3.2 Standardization Administration of China (SAC)
- 3.4.3.3 Bureau of Indian Standards (BIS)
- 3.4.3.4 Japanese Industrial Standards Committee (JISC)
- 3.4.4 Latin America
- 3.4.4.1 Instituto Nacional de Metrologia Qualidade e Tecnologia (INMETRO)
- 3.4.4.2 Asociacion de Normalizacion y Certificacion (ANCE)
- 3.4.4.3 Instituto Argentino de Normalizacion y Certificacion (IRAM)
- 3.4.5 Middle East & Africa
- 3.4.5.1 Saudi Standards Metrology and Quality Organization (SASO)
- 3.4.5.2 Emirates Authority for Standardization and Metrology (ESMA)
- 3.4.5.3 South African Bureau of Standards (SABS)
- 3.4.1 North America
- 3.5 Investment & Funding Analysis
- 3.6 Porter's analysis
- 3.7 PESTEL analysis
- 3.8 Technology and innovation landscape
- 3.8.1 Current technologies
- 3.8.1.1 AC charging cables (Mode 2 & Mode 3)
- 3.8.1.2 DC fast charging (50kW-250kW)
- 3.8.1.3 Smart charging & load management systems
- 3.8.1.4 Standardized connector technologies (CCS, CHAdeMO, GB/T)
- 3.8.2 Emerging technologies
- 3.8.2.1 Ultra-fast charging cables (350 kW+)
- 3.8.2.2 Lightweight and flexible cable materials
- 3.8.2.3 Liquid-cooled charging cables
- 3.8.1 Current technologies
- 3.9 Pricing analysis (Driven by Primary Research)
- 3.9.1 Historical Price Trend Analysis
- 3.9.2 Pricing Strategy by Player Type (Premium / Value / Cost-plus)
- 3.10 Patent landscape (Driven by Primary Research)
- 3.11 Trade Data Analysis (Driven by Paid Database)
- 3.11.1 Import/Export Volume & Value Trends
- 3.11.2 Key Trade Corridors & Tariff Impact
- 3.12 Capacity & Production Landscape (Driven by Primary Research)
- 3.12.1 Installed Capacity by Region & Key Producer
- 3.12.2 Capacity Utilization Rates & Expansion Pipelines
- 3.13 Impact of AI & Generative AI on the Market
- 3.13.1 AI-driven disruption of existing business models
- 3.13.2 GenAI use cases & adoption roadmap by segment
- 3.13.3 Risks, limitations & regulatory considerations
- 3.14 EV OEM strategy alignment
- 3.15 Replacement cycle analysis
- 3.15.1 Average lifecycle of EV charging cables
- 3.15.2 Influence of usage patterns & environmental factors
- 3.15.3 Replacement cost & economic considerations
- 3.15.4 Impact of technological upgrades on replacement cycles
- 3.16 Case studies
- 3.17 Forecast assumptions & scenario analysis (Driven by Primary Research)
- 3.17.1 Base Case - key macro & industry variables driving CAGR
- 3.17.2 Optimistic Scenarios - Favorable macro and industry tailwinds
- 3.17.3 Pessimistic Scenario - Macroeconomic slowdown or industry headwinds
Chapter 4 Competitive Landscape, 2025
- 4.1 Introduction
- 4.2 Company market share analysis
- 4.2.1 North America
- 4.2.2 Europe
- 4.2.3 Asia Pacific
- 4.2.4 LATAM
- 4.2.5 MEA
- 4.3 Competitive analysis of major market players
- 4.4 Competitive positioning matrix
- 4.5 Key developments
- 4.5.1 Mergers & acquisitions
- 4.5.2 Partnerships & collaborations
- 4.5.3 New product launches
- 4.5.4 Expansion plans and funding
- 4.6 Company tier benchmarking
- 4.6.1 Tier classification criteria & qualifying thresholds
- 4.6.2 Tier positioning matrix by revenue, geography & innovation
Chapter 5 Market Estimates & Forecast, By Cable, 2022 - 2035 ($Mn, Thousand Units)
- 5.1 Key trends
- 5.2 Normal/Standard Charging Cable
- 5.3 High-Power Charging (HPC) Cable
- 5.3.1 Standard/Uncooled High-Power Charging (HPC) Cable
- 5.3.2 Liquid-Cooled High-Power Charging Cable
Chapter 6 Market Estimates & Forecast, By Power Supply, 2022 - 2035 ($Mn, Thousand Units)
- 6.1 Key trends
- 6.2 Alternate Charging (AC)
- 6.3 Direct Charging (DC)
Chapter 7 Market Estimates & Forecast, By Charging Level, 2022 - 2035 ($Mn, Thousand Units)
- 7.1 Key trends
- 7.2 Level 1 (120V)
- 7.3 Level 2 (240V)
- 7.4 Level 3 (480V+)
Chapter 8 Market Estimates & Forecast, By Connector, 2022 - 2035 ($Mn, Thousand Units)
- 8.1 Key trends
- 8.2 Type 1
- 8.3 Type 2
- 8.4 CCS 1
- 8.5 CCS 2
- 8.6 CHAdeMO
- 8.7 GB/T
- 8.8 NACS/Tesla
Chapter 9 Market Estimates & Forecast, By Mode, 2022 - 2035 ($Mn, Thousand Units)
- 9.1 Key trends
- 9.2 Mode 1 & 2
- 9.3 Mode 3
- 9.4 Mode 4
Chapter 10 Market Estimates & Forecast, By Diameter, 2022 - 2035 ($Mn, Thousand Units)
- 10.1 Key trends
- 10.2 10 mm
- 10.3 10-20 mm
- 10.4 Above 20 mm
Chapter 11 Market Estimates & Forecast, By Shape, 2022 - 2035 ($Mn, Thousand Units)
- 11.1 Key trends
- 11.2 Straight
- 11.3 Coiled
Chapter 12 Market Estimates & Forecast, By Length, 2022 - 2035 ($Mn, Thousand Units)
- 12.1 Key trends
- 12.2 Below 5 meters
- 12.3 5-10 meters
- 12.4 Above 10 meters
Chapter 13 Market Estimates & Forecast, By Application, 2022 - 2035 ($Mn, Thousand Units)
- 13.1 Key trends
- 13.2 Private Charging
- 13.3 Public Charging
- 13.3.1 Shopping malls
- 13.3.2 Airports
- 13.3.3 Highways
- 13.3.4 Commercial Parking
- 13.3.5 Others
Chapter 14 Market Estimates & Forecast, By Sales Channel, 2022 - 2035 ($Mn, Thousand Units)
- 14.1 Key trends
- 14.2 OEM
- 14.3 Aftermarket
Chapter 15 Market Estimates & Forecast, By Region, 2022 - 2035 ($Mn, Thousand Units)
- 15.1 Key trends
- 15.2 North America
- 15.2.1 US
- 15.2.2 Canada
- 15.3 Europe
- 15.3.1 Germany
- 15.3.2 UK
- 15.3.3 France
- 15.3.4 Italy
- 15.3.5 Spain
- 15.3.6 Belgium
- 15.3.7 Russia
- 15.3.8 Netherlands
- 15.4 Asia Pacific
- 15.4.1 China
- 15.4.2 India
- 15.4.3 Japan
- 15.4.4 South Korea
- 15.4.5 Australia
- 15.4.6 Singapore
- 15.4.7 Malaysia
- 15.4.8 Vietnam
- 15.4.9 Thailand
- 15.5 Latin America
- 15.5.1 Brazil
- 15.5.2 Mexico
- 15.5.3 Argentina
- 15.5.4 Colombia
- 15.6 MEA
- 15.6.1 South Africa
- 15.6.2 Saudi Arabia
- 15.6.3 UAE
Chapter 16 Company Profiles
- 16.1 Global players
- 16.1.1 Phoenix Contact
- 16.1.2 TE Connectivity
- 16.1.3 LEONI
- 16.1.4 Prysmian
- 16.1.5 Aptiv
- 16.1.6 Huber+Suhner
- 16.1.7 Dyden
- 16.1.8 Coroplast
- 16.1.9 BRUGG
- 16.1.10 Tesla
- 16.2 Regional players
- 16.2.1 Chengdu Khons
- 16.2.2 Sinbon Electronics
- 16.2.3 EV TEISON
- 16.2.4 Guchen Electronics
- 16.2.5 Manlon
- 16.2.6 Pod Point
- 16.3 Emerging players
- 16.3.1 Juice Technology
- 16.3.2 Webasto
- 16.3.3 Masterplug
- 16.3.4 Zencar
 電動車充電線纜市場-2026-2032年全球市場預測
 電動車充電線市場分析及預測(至2035年):按類型、產品、技術、組件、應用、材料類型、最終用戶、功能、安裝類型、設備分類
 電動車充電線市場預測至2034年-全球分析(按充電等級、充電模式、線材類型、線材形狀、護套材料、輸出功率、安裝配置、車輛類型、電源、銷售管道、應用和地區分類)
 電動車充電線市場規模、佔有率和成長分析:按電纜類型、充電線類型、連接器類型、直徑、材質、長度和地區分類-2026-2033年產業預測
 水冷式電動車充電電纜市場機會、成長要素、產業趨勢分析及2026-2035年預測。
 2026年全球電動車充電線市場報告
 下一代電動車充電線市場:策略性洞察與預測(2026-2031)全球電動車充電線市場規模、佔有率、趨勢及成長分析報告(2026-2034年)
 全球液冷式電動車充電電纜市場:按電纜能量、電纜長度、電纜直徑、應用、覆材、冷卻劑和地區分類的2032年預測2026年全球USB-C充電線市場報告