

 |
市場調查報告書
商品編碼
1982376
熱成像市場商機、成長要素、產業趨勢分析及2026-2035年預測。Thermal Imaging Market Opportunity, Growth Drivers, Industry Trend Analysis, and Forecast 2026 - 2035 |
||||||
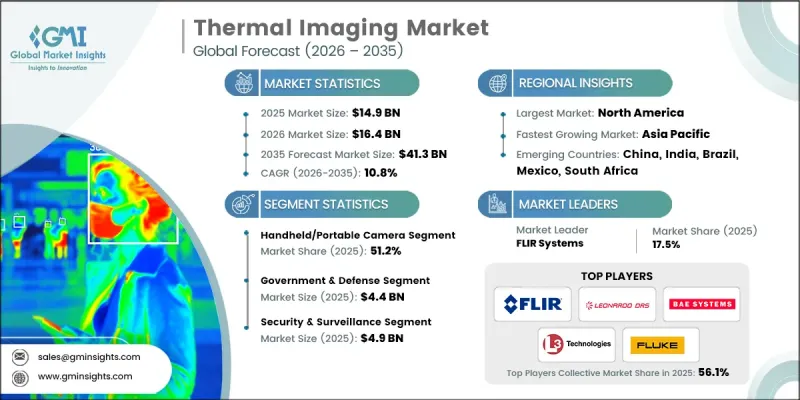
全球熱感成像市場預計到 2025 年將價值 149 億美元,預計到 2035 年將以 10.8% 的複合年成長率成長至 413 億美元。
熱感成像技術的工作原理是偵測物體發出的紅外線輻射,並利用專用相機將這些熱訊號轉換成可見影像。由於該系統無需可見光即可運作,因此非常適合用於國防行動、邊防安全、工業檢測和醫療診斷,即使在完全黑暗、霧霾或煙霧瀰漫的環境下也能正常工作。在現代化專案和日益成長的安全需求的推動下,國防和工業領域對這些系統的應用不斷增加,從而推動了市場擴張。技術的持續進步、政府對公共的投入以及工業自動化的發展,進一步加速了熱感成像解決方案的普及。市場正受益於威脅偵測、監控、緊急應變和提升營運效率等各領域的應用。
| 市場範圍 | |
|---|---|
| 開始年份 | 2025 |
| 預測期 | 2026-2035 |
| 上市時的市場規模 | 149億美元 |
| 預計金額 | 413億美元 |
| 複合年成長率 | 10.8% |
到2025年,手持式和可攜式熱感像儀將佔據51.2%的市場。其便攜性和易於部署的特點使其成為電氣設備檢測、暖通空調維護、消防和快速緊急應變等領域不可或缺的工具。最新的非冷凍感測器重量不足500克,解析度高達640x512,靈敏度達20mK,可在工業、公共和建築評估等應用中實現對機殼的快速非接觸式檢測。
預計到2025年,政府和國防領域的市場規模將達到44億美元,這主要得益於國防預算的成長、無人機和無人飛行器對緊湊型紅外線系統的需求增加以及邊防安全安全措施的加強。先進的冷卻式中波紅外線(MWIR)和長波紅外線(LWIR)系統即使在黑暗和惡劣天氣條件下也能實現遠端目標捕獲,而基於人工智慧的分析功能則有助於自主識別威脅。製造商正致力於開發功能強大、結構緊湊且具備人工智慧邊緣分析能力的晶片,以最佳化其在空中平台和戰術性部署中的應用。
預計2025年,美國熱感成像市場規模將達38億美元,主要驅動力包括國防現代化、公共投資增加以及工業自動化普及。在軍事應用領域,冷卻式和中波紅外線技術因其精確的目標捕獲和監視功能而備受青睞。民用應用則涵蓋公共產業監控、汽車安全和醫療篩檢等領域。穩定的政府資金投入和規範的採購流程為市場的持續成長提供了支撐,而國內製造則在系統整合和供應鏈連續性方面具有優勢。
目錄
第1章:調查方法和範圍
第2章執行摘要
第3章業界考察
- 生態系分析
- 供應商情況
- 利潤率
- 成本結構
- 每個階段增加的價值
- 影響價值鏈的因素
- 中斷
- 影響產業的因素
- 促進因素
- 擴大國防現代化計劃
- 擴大邊防安全和海上監視範圍
- 無人機和無人飛行器威脅偵測
- 將夜視功能整合到自主系統中
- 公共和緊急應變需求
- 產業潛在風險與挑戰
- 冷卻式中波/長波紅外線感知器高成本
- SWaP-C 在攜帶式應用中的局限性
- 市場機遇
- 人工智慧熱分析技術的廣泛應用。
- 高光譜遙測和頻譜融合
- 促進因素
- 成長潛力分析
- 監理情勢
- 北美洲
- 歐洲
- 亞太地區
- 拉丁美洲
- 中東和非洲
- 波特的分析
- PESTEL 分析
- 科技與創新趨勢
- 當前技術趨勢
- 新興技術
- 價格趨勢
- 歷史價格分析(2022-2024)
- 影響價格趨勢的因素
- 各地區價格波動
- 價格預測(2026-2035)
- 定價策略
- 新興經營模式
- 合規要求
- 專利分析
第4章 競爭情勢
- 介紹
- 企業市佔率分析
- 按地區
- 北美洲
- 歐洲
- 亞太地區
- 拉丁美洲
- 中東和非洲
- 市場集中度分析
- 按地區
- 主要企業的競爭標竿分析
- 財務績效比較
- 銷售量
- 利潤率
- 研究與開發
- 產品系列比較
- 產品線
- 科技
- 創新
- 區域擴張比較
- 全球擴張分析
- 服務網路覆蓋
- 按地區分類的市場滲透率
- 競爭定位矩陣
- 領導者
- 挑戰者
- 追蹤者
- 小眾玩家
- 戰略展望矩陣
- 財務績效比較
- 2022-2025 年重大發展
- 併購
- 夥伴關係和聯盟
- 技術進步
- 業務拓展與投資策略
- 永續發展計劃
- 數位轉型計劃
- 新興/Start-Ups競爭對手的發展趨勢
第5章:熱成像市場估算與預測:依產品分類,2022-2035年
- 手持/可攜式相機
- 固定/靜止模型是主要類型。
- 瞄準鏡和視力眼鏡
第6章:熱成像市場估算與預測:依技術分類,2022-2035年
- 冷卻類型
- 非冷卻型
第7章 市場估計與預測:依應用領域分類,2022-2035年
- 檢測與測量
- 監測和檢查
- 個人視覺系統
- 搜救
- 安全監控
- 其他
第8章 市場估算與預測:依最終用途產業分類,2022-2035年
- 車
- 商業的
- 政府/國防
- 醫學與生命科學
- 工業的
- 住宅
- 其他
第9章:熱成像市場估算與預測:按地區分類,2022-2035年
- 按地區
- 北美洲
- 美國
- 加拿大
- 歐洲
- 英國
- 德國
- 法國
- 義大利
- 西班牙
- 荷蘭
- 其他歐洲地區
- 亞太地區
- 中國
- 印度
- 日本
- 韓國
- 澳洲
- 亞太其他地區
- 拉丁美洲
- 巴西
- 墨西哥
- 阿根廷
- 其他拉丁美洲地區
- 中東和非洲(MEA)
- 沙烏地阿拉伯
- 南非
- 阿拉伯聯合大公國
- 其他中東和非洲地區
第10章:公司簡介
- 3M Scott
- Allied Vision
- American Technologies Network(ATN)Corp.
- Avon Protection Systems Inc.
- Axis Communications
- Bae Systems Imaging Solutions
- COX
- Dali Technology
- Draeger Safety Inc.
- FLIR Systems
- Fluke Corporation(Fortive subsidiary)
- General Starlight Company Inc.(GSCI)
- L3 Technologies
- Leonardo DRS
- Magnity Electronics
- Opgal Optronic Industries Limited
- Palmer Wahl Instrumentation Group
- Raytheon
- Seek Thermal
- Testo SE
- Thermoteknix Systems
- Tonbo Imaging
- ULIS(Sofradir subsidiary)
- Wuhan Guide Infrared Co., Ltd.
- Xenics NV
The Global Thermal Imaging Market was valued at USD 14.9 billion in 2025 and is estimated to grow at a CAGR of 10.8% to reach USD 41.3 billion by 2035.
Thermal imaging technology works by detecting infrared radiation emitted by objects and converting these heat signatures into visible images using specialized cameras. The system can operate without visible light, making it ideal for defense operations, border security, industrial inspections, and medical diagnostics in total darkness, fog, or smoke. The rising adoption of these systems across defense and industrial sectors, driven by modernization programs and increasing security demands, is fueling market expansion. Continuous technological advancements, government funding for public safety, and growing industrial automation are further accelerating the deployment of thermal imaging solutions. The market benefits from its applications in threat detection, surveillance, emergency response, and operational efficiency across diverse sectors.
| Market Scope | |
|---|---|
| Start Year | 2025 |
| Forecast Year | 2026-2035 |
| Start Value | $14.9 Billion |
| Forecast Value | $41.3 Billion |
| CAGR | 10.8% |
The handheld and portable thermal cameras segment held a 51.2% share in 2025. Their portability and ease of deployment make them essential for electrical inspections, HVAC maintenance, firefighting, and rapid emergency response. Modern uncooled sensors offer 640x512 resolution with 20mK sensitivity in compact packages under 500g, enabling quick, non-contact detection of hotspots in industrial, public safety, and building assessments.
The government and defense segment generated USD 4.4 billion in 2025, fueled by rising defense budgets, UAV and drone integrations requiring compact infrared systems, and border security initiatives. Advanced cooled MWIR and LWIR systems enable long-range targeting through darkness and adverse weather, while AI-based analytics support autonomous threat identification. Manufacturers focus on developing ruggedized, compact cores with AI edge analytics optimized for aerial platforms and tactical deployment.
U.S. Thermal Imaging Market was valued at USD 3.8 billion in 2025, driven by defense modernization, public safety funding, and industrial automation adoption. Military applications emphasize cooled and mid-wave infrared technologies for precise targeting and surveillance. Civilian use extends to utility monitoring, automotive safety, and healthcare screening. Stable government funding and organized procurement processes support sustained market expansion, while domestic manufacturing provides advantages in system integration and supply chain continuity.
Leading players in the Global Thermal Imaging Market include Raytheon, Seek Thermal, ULIS (Sofradir subsidiary), Draeger Safety Inc., Thermoteknix Systems, Palmer Wahl Instrumentation Group, 3M Scott, American Technologies Network (ATN) Corp., Bae Systems Imaging Solutions, Opgal Optronic Industries Limited, FLIR Systems, L3 Technologies, Axis Communications, Xenics NV, Tonbo Imaging, Leonardo DRS, Magnity Electronics, COX, Fluke Corporation (Fortive subsidiary), General Starlight Company Inc. (GSCI), Dali Technology, Avon Protection Systems Inc., and Wuhan Guide Infrared Co., Ltd. Companies in the Global Thermal Imaging Market are adopting strategies to strengthen their market position and expand global presence. They are investing heavily in research and development to enhance sensitivity, image resolution, and AI-driven analytics. Strategic partnerships, mergers, and acquisitions help penetrate new regional markets and broaden product offerings. Many firms focus on developing portable and ruggedized solutions for defense and industrial applications while enhancing manufacturing capabilities to improve supply chain efficiency.
Table of Contents
Chapter 1 Methodology and Scope
- 1.1 Market scope and definition
- 1.2 Research design
- 1.2.1 Research approach
- 1.2.2 Data collection methods
- 1.3 Data mining sources
- 1.3.1 Global
- 1.3.2 Regional/Country
- 1.4 Base estimates and calculations
- 1.4.1 Base year calculation
- 1.4.2 Key trends for market estimation
- 1.5 Primary research and validation
- 1.5.1 Primary sources
- 1.6 Forecast model
- 1.7 Research assumptions and limitations
Chapter 2 Executive Summary
- 2.1 Industry snapshot
- 2.2 Key market trends
- 2.2.1 Product trends
- 2.2.2 Technology trends
- 2.2.3 Application trends
- 2.2.4 End-user industry trends
- 2.2.5 Regional trends
- 2.3 TAM Analysis, 2025-2034 (USD Billion)
- 2.4 CXO perspectives: Strategic imperatives
- 2.4.1 Executive decision points
- 2.4.2 Critical success factors
- 2.5 Future outlook and strategic recommendations
Chapter 3 Industry Insights
- 3.1 Industry ecosystem analysis
- 3.1.1 Supplier Landscape
- 3.1.2 Profit Margin
- 3.1.3 Cost structure
- 3.1.4 Value addition at each stage
- 3.1.5 Factor affecting the value chain
- 3.1.6 Disruptions
- 3.2 Industry impact forces
- 3.2.1 Growth drivers
- 3.2.1.1 Rising Defense Modernization Programs
- 3.2.1.2 Border Security & Maritime Surveillance Expansion
- 3.2.1.3 Counter-Drone & UAV Threat Detection
- 3.2.1.4 Night Vision Integration in Autonomous Systems
- 3.2.1.5 Public Safety & First Responder Demand
- 3.2.2 Industry pitfalls and challenges
- 3.2.2.1 High Cost of Cooled MWIR/LWIR Sensors
- 3.2.2.2 SWaP-C Constraints in Portable Applications
- 3.2.3 Market opportunities
- 3.2.3.1 AI-Enhanced Thermal Analytics Proliferation
- 3.2.3.2 Hyperspectral & Multi-Spectral Fusion
- 3.2.1 Growth drivers
- 3.3 Growth potential analysis
- 3.4 Regulatory landscape
- 3.4.1 North America
- 3.4.2 Europe
- 3.4.3 Asia Pacific
- 3.4.4 Latin America
- 3.4.5 Middle East & Africa
- 3.5 Porter’s analysis
- 3.6 PESTEL analysis
- 3.7 Technology and innovation landscape
- 3.7.1 Current technological trends
- 3.7.2 Emerging technologies
- 3.8 Price trends
- 3.8.1 Historical price analysis (2022-2024)
- 3.8.2 Price trend drivers
- 3.8.3 Regional price variations
- 3.8.4 Price forecast (2026-2035)
- 3.9 Pricing strategies
- 3.10 Emerging business models
- 3.11 Compliance requirements
- 3.12 Patent analysis
Chapter 4 Competitive Landscape, 2025
- 4.1 Introduction
- 4.2 Company market share analysis
- 4.2.1 By Region
- 4.2.1.1 North America
- 4.2.1.2 Europe
- 4.2.1.3 Asia Pacific
- 4.2.1.4 Latin America
- 4.2.1.5 Middle East & Africa
- 4.2.2 Market Concentration Analysis
- 4.2.1 By Region
- 4.3 Competitive benchmarking of key players
- 4.3.1 Financial performance comparison
- 4.3.1.1 Revenue
- 4.3.1.2 Profit margin
- 4.3.1.3 R&D
- 4.3.2 Product portfolio comparison
- 4.3.2.1 Product range breadth
- 4.3.2.2 Technology
- 4.3.2.3 Innovation
- 4.3.3 Geographic presence comparison
- 4.3.3.1 Global footprint analysis
- 4.3.3.2 Service network coverage
- 4.3.3.3 Market penetration by region
- 4.3.4 Competitive positioning matrix
- 4.3.4.1 Leaders
- 4.3.4.2 Challengers
- 4.3.4.3 Followers
- 4.3.4.4 Niche players
- 4.3.5 Strategic outlook matrix
- 4.3.1 Financial performance comparison
- 4.4 Key developments, 2022-2025
- 4.4.1 Mergers and acquisitions
- 4.4.2 Partnerships and collaborations
- 4.4.3 Technological advancements
- 4.4.4 Expansion and investment strategies
- 4.4.5 Sustainability initiatives
- 4.4.6 Digital transformation initiatives
- 4.5 Emerging/ startup competitors landscape
Chapter 5 Thermal Imaging Market Estimates & Forecast, By Product, 2022 - 2035 (USD Million)
- 5.1 Key trends
- 5.2 Handheld/Portable camera
- 5.3 Fixed/Mounted Core
- 5.4 Scopes & Vision Googles
Chapter 6 Thermal Imaging Market Estimates & Forecast, By Technology, 2022 - 2035 (USD Million)
- 6.1 Key trends
- 6.2 Cooled
- 6.3 Uncooled
Chapter 7 Market Estimates and Forecast, By Application , 2022 - 2035 (USD Million)
- 7.1 Key trends
- 7.2 Detection & measurement
- 7.3 Monitoring & inspection
- 7.4 Personal vision systems
- 7.5 Search & rescue
- 7.6 Security & surveillance
- 7.7 Others
Chapter 8 Market Estimates and Forecast, By End-Use Industry, 2022 - 2035 (USD Million)
- 8.1 Key trends
- 8.2 Automotive
- 8.3 Commercial
- 8.4 Government & Defense
- 8.5 Healthcare & Life Sciences
- 8.6 Industrial
- 8.7 Residential
- 8.8 Others
Chapter 9 Thermal Imaging Market Estimates & Forecast, By Region, 2022 - 2035 (USD Million)
- 9.1 Key trends, by region
- 9.2 North America
- 9.2.1 U.S.
- 9.2.2 Canada
- 9.3 Europe
- 9.3.1 UK
- 9.3.2 Germany
- 9.3.3 France
- 9.3.4 Italy
- 9.3.5 Spain
- 9.3.6 Netherlands
- 9.3.7 Rest of Europe
- 9.4 Asia-Pacific
- 9.4.1 China
- 9.4.2 India
- 9.4.3 Japan
- 9.4.4 South Korea
- 9.4.5 Australia
- 9.4.6 Rest of Asia-Pacific
- 9.5 Latin America
- 9.5.1 Brazil
- 9.5.2 Mexico
- 9.5.3 Argentina
- 9.5.4 Rest of Latin America
- 9.6 MEA
- 9.6.1 Saudi Arabia
- 9.6.2 South Africa
- 9.6.3 UAE
- 9.6.4 Rest of MEA
Chapter 10 Company Profiles
- 10.1 3M Scott
- 10.2 Allied Vision
- 10.3 American Technologies Network (ATN) Corp.
- 10.4 Avon Protection Systems Inc.
- 10.5 Axis Communications
- 10.6 Bae Systems Imaging Solutions
- 10.7 COX
- 10.8 Dali Technology
- 10.9 Draeger Safety Inc.
- 10.10 FLIR Systems
- 10.11 Fluke Corporation (Fortive subsidiary)
- 10.12 General Starlight Company Inc. (GSCI)
- 10.13 L3 Technologies
- 10.14 Leonardo DRS
- 10.15 Magnity Electronics
- 10.16 Opgal Optronic Industries Limited
- 10.17 Palmer Wahl Instrumentation Group
- 10.18 Raytheon
- 10.19 Seek Thermal
- 10.20 Testo SE
- 10.21 Thermoteknix Systems
- 10.22 Tonbo Imaging
- 10.23 ULIS (Sofradir subsidiary)
- 10.24 Wuhan Guide Infrared Co., Ltd.
- 10.25 Xenics NV
 熱成像市場:按應用、最終用戶和地區分類
 熱成像市場:全球市場預測(按產品類型、技術、銷售管道、最終用途和應用分類)- 2026-2032 年
 全球國防熱成像模組(冷卻型)市場:2026–2036攜帶式熱感雙筒望遠鏡市場:按技術、解析度、價格範圍、應用、最終用戶和分銷管道分類,全球預測,2026-2032年低溫中波熱感市場:檢測器材料、平台、解析度、影格速率、應用和最終用戶成像器-全球預測,2026-2032年攜帶式測溫熱感成像器市場:依技術、價格範圍、頻譜範圍、解析度、最終用途產業、應用類型和分銷管道分類,全球預測(2026-2032年)
 熱成像市場分析及至2035年的預測:按類型、產品、服務、技術、組件、應用、設備、最終用戶、功能及安裝類型
 亞太地區熱感成像系統:市場佔有率分析、產業趨勢與統計、成長預測(2026-2031)
 2026年全球熱感成像市場報告
 熱感成像市場-全球產業規模、佔有率、趨勢、機會、預測:按類型、應用、技術、垂直市場、地區和競爭對手分類,2021-2031年