


 |
市場調查報告書
商品編碼
1982368
聚合氯化鋁市場機會、成長要素、產業趨勢分析及2026-2035年預測Poly Aluminum Chloride Market Opportunity, Growth Drivers, Industry Trend Analysis, and Forecast 2026 - 2035 |
||||||
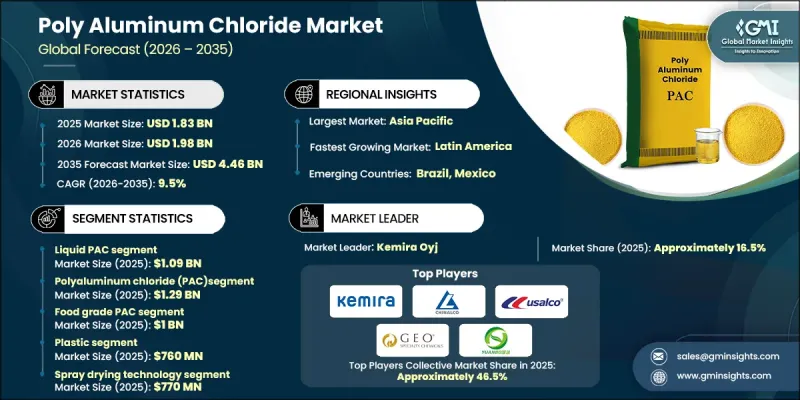
2025年全球聚合氯化鋁市場價值為18.3億美元,預計2035年將以9.5%的複合年成長率成長至44.6億美元。
受市政和工業水處理應用領域需求成長的推動,聚氯化鋁(PVC)產業正經歷強勁成長。新興經濟體的快速都市化和大規模基礎設施建設,促使公共和私人對飲用水和污水處理設施的投資大幅增加。這一趨勢推動了PVC消費量的成長,PVC能夠高效去除濁度、懸浮顆粒物和其他污染物。更嚴格的水質法規和排放標準進一步加速了先進凝聚劑的轉變。紡織、紙漿和造紙、化學和食品加工等行業的工業活動擴張產生了大量污水,這些廢水在排放前需要有效處理。與傳統凝聚劑相比,PVC絮凝速度更快,產生的污泥更少,從而提高了運作效率並降低了處置成本。因此,持續的工業化和不斷加強的監管,共同推動了全球對PVC需求的長期穩定成長。
| 市場範圍 | |
|---|---|
| 開始年份 | 2025 |
| 預測期 | 2026-2035 |
| 上市時的市場規模 | 18.3億美元 |
| 預測金額 | 44.6億美元 |
| 複合年成長率 | 9.5% |
預計到2025年,液態聚合氯化鋁(PAC)市場規模將達到10.9億美元,並在2026年至2035年間以9.2%的複合年成長率成長。不同產品形態的需求與特定應用情境下的處理、儲存和計量要求密切相關。液態聚合氯化鋁因其易於泵送、計量穩定且反應迅速,在大規模市政和工業處理設施中越來越受歡迎。同時,粉末、顆粒和片狀產品在分散式或小規模處理設施中也越來越受歡迎,因為長期儲存、運輸便利和應用彈性是關鍵考慮因素。產品形態的多樣化反映了整個產業正在發生重大轉變,即更注重操作的適應性,而非依賴標準化解決方案。
預計到2025年,聚合氯化鋁(PAC)市場規模將達到12.9億美元,並在2035年之前以9.2%的複合年成長率成長。不同等級PAC的市場發展凸顯了基於處理效率和水化學要求的日益產品差異化。由於傳統PAC在市政和工業應用中具有成本績效效益,其應用率仍然很高。同時,針對成分更為複雜的污水,需要更高穩定性和絮凝效率的改良產品,如硫酸聚合氯化鋁和複合PAC配方,正被廣泛採用。這種發展趨勢表明,化學處理方法正從統一的模式轉向根據個體需求量身定做的解決方案。
預計2025年,北美聚合氯化鋁(PAC)市場規模將達4.6億美元。這一區域市場擴張的驅動力主要來自對老舊水基礎設施投資的增加,以及飲用水和廢水法規結構日益嚴格的影響。市政供水事業和工業營運商正將更多預算投入先進的絮凝技術中,以提高處理性能並降低污泥管理成本。在北美地區,尤其是在美國,高性能PAC產品的應用正在加速,這得益於旨在實現處理設施現代化和提高系統長期可靠性的公共資助項目。
目錄
第1章:調查方法
第2章執行摘要
第3章業界考察
- 生態系分析
- 供應商情況
- 利潤率
- 每個階段增加的價值
- 影響價值鏈的因素
- 中斷
- 影響產業的因素
- 促進因素
- 產業潛在風險與挑戰
- 市場機遇
- 成長潛力分析
- 監理情勢
- 北美洲
- 歐洲
- 亞太地區
- 拉丁美洲
- 中東和非洲
- 波特的分析
- PESTEL 分析
- 價格趨勢
- 按地區
- 依產品
- 未來市場趨勢
- 科技與創新趨勢
- 當前技術趨勢
- 新興技術
- 專利趨勢
- 貿易統計(註:僅提供主要國家的貿易統計)
- 主要進口國
- 主要出口國
- 永續性和環境方面
- 永續計劃
- 減少廢棄物策略
- 生產中的能源效率
- 具有環保意識的舉措
- 關於碳足跡的考量
第4章 競爭情勢
- 介紹
- 企業市佔率分析
- 按地區
- 北美洲
- 歐洲
- 亞太地區
- 拉丁美洲
- 中東和非洲
- 按地區
- 企業矩陣分析
- 主要市場公司的競爭分析
- 競爭定位矩陣
- 主要進展
- 併購
- 夥伴關係與合作
- 新產品發布
- 業務拓展計劃
第5章 市場估計與預測:依類型分類,2022-2035年
- 液態PAC
- 粉末 PAC(噴霧乾燥)
- 顆粒狀PAC
- 片狀PAC(滾筒乾燥)
第6章 市場估算與預測:依產品類型分類,2022-2035年
- 聚合氯化鋁(PAC)
- 聚合氯化鋁硫酸鹽(PACS)
- 水合氯化鋁(ACH)
- 複合PAC
- 奈米PAC
第7章 市場估計與預測:依等級分類,2022-2035年
- PAC食品
- 飲用水的PAC
- 工業級PAC
- 過濾級PAC
第8章 市場估算與預測:基準性別,2022-2035年
- 低鹼性
- 中等鹼性
- 高鹼性
- 超基礎
第9章 市場估價與預測:依製造流程分類,2022-2035年
- 噴霧乾燥技術
- 滾筒乾燥技術
- 電滲析
- 可溶性鋁灰法
第10章 市場估價與預測:依最終用戶產業分類,2022-2035年
- 水處理
- 紙漿和造紙業
- 紡織業
- 石油和天然氣產業
- 藥品和化妝品
- 其他
第11章 市場估計與預測:依應用領域分類,2022-2035年
- 聚集和膠凝作用
- 污泥脫水
- 薄膜預處理
- 除磷
- 重金屬去除
- 去除有機物和天然有機物
- 其他
第12章 市場估計與預測:依地區分類,2022-2035年
- 北美洲
- 美國
- 加拿大
- 歐洲
- 德國
- 英國
- 法國
- 義大利
- 西班牙
- 其他歐洲地區
- 亞太地區
- 中國
- 印度
- 日本
- 澳洲
- 韓國
- 亞太其他地區
- 拉丁美洲
- 巴西
- 墨西哥
- 阿根廷
- 其他拉丁美洲地區
- 中東和非洲
- 沙烏地阿拉伯
- 南非
- 阿拉伯聯合大公國
- 其他中東和非洲地區
第13章:公司簡介
- Alumichem A/S
- Biosynth
- CHALCO Advanced Material Co., Ltd.
- EMCO Dyestuff
- Fengchen Group Co.,Ltd
- GEO Specialty Chemicals
- Henan Chemger Group Corporation
- Henan Yuanbo Environmental Technology Co., Ltd.
- Kavya Pharma
- Kemira Oyj
- NR CHEMICALS
- Taki Chemical
- USALCO
- Venator Materials
The Global Poly Aluminum Chloride Market was valued at USD 1.83 billion in 2025 and is estimated to grow at a CAGR of 9.5% to reach USD 4.46 billion by 2035.
The poly aluminum chloride industry is experiencing strong expansion driven by rising demand across municipal and industrial water treatment applications. Rapid urban growth and large-scale infrastructure development in emerging economies are prompting significant public and private investments in drinking water and wastewater treatment facilities. This trend is increasing the consumption of poly aluminum chloride due to its high efficiency in removing turbidity, suspended particles, and other contaminants. Tightening water quality regulations and stricter discharge standards are further accelerating the shift toward advanced coagulants. Expanding industrial operations across textiles, pulp and paper, chemicals, and food processing sectors are generating substantial wastewater volumes that require effective treatment before discharge. Compared to conventional coagulants, poly aluminum chloride delivers faster coagulation and produces lower sludge volumes, enhancing operational efficiency and reducing disposal costs. Sustained industrialization and continuous regulatory enforcement are therefore translating into consistent and long-term demand growth for poly aluminum chloride worldwide.
| Market Scope | |
|---|---|
| Start Year | 2025 |
| Forecast Year | 2026-2035 |
| Start Value | $1.83 Billion |
| Forecast Value | $4.46 Billion |
| CAGR | 9.5% |
The liquid PAC segment accounted for USD 1.09 billion in 2025 and is expected to grow at a CAGR of 9.2% from 2026 to 2035. Demand for different product forms is closely linked to application-specific handling, storage, and dosing requirements. Liquid poly aluminum chloride is increasingly preferred in large municipal and industrial treatment plants due to its ease of pumping, consistent dosing capability, and rapid reaction performance. Meanwhile, powdered, granular, and flake forms are gaining traction in decentralized or smaller-scale treatment facilities where extended shelf life, simplified transportation, and flexible application are critical considerations. This diversification in product formats reflects a broader industry shift toward operational adaptability rather than reliance on standardized solutions.
The poly aluminum chloride (PAC) segment was valued at USD 1.29 billion in 2025 and is estimated to grow at a CAGR of 9.2% through 2035. Market development across various PAC grades highlights growing product differentiation based on treatment efficiency and water chemistry requirements. Conventional PAC continues to maintain strong adoption due to its balanced cost-to-performance ratio across municipal and industrial uses. At the same time, enhanced variants such as poly aluminum chlorosulfate and composite PAC formulations are being adopted for more complex wastewater compositions requiring improved stability and coagulation efficiency. This evolution underscores a transition toward tailored chemical treatment solutions instead of a uniform treatment approach.
North America Poly Aluminum Chloride Market generated USD 0.46 billion in 2025. Regional expansion is supported by increased investments in aging water infrastructure and stricter regulatory frameworks governing potable water and wastewater discharge. Municipal utilities and industrial operators are allocating greater budgets to advanced coagulation technologies that improve treatment performance while lowering sludge management expenses. Within the region, the United States is witnessing accelerated adoption of high-performance PAC grades, supported by public funding initiatives aimed at modernizing treatment facilities and improving long-term system reliability.
Key companies operating in the Global Poly Aluminum Chloride Market include Kemira Oyj, USALCO, CHALCO Advanced Material Co., Ltd., GEO Specialty Chemicals, Henan Yuanbo Environmental Technology Co., Ltd., and other regional participants. Companies in the Global Poly Aluminum Chloride Market are reinforcing their competitive position through investments in research and development focused on high-efficiency and low-sludge formulations. Strategic partnerships with municipal authorities and industrial operators are expanding long-term supply agreements and strengthening distribution networks. Many manufacturers are enhancing production capacities and optimizing supply chains to ensure consistent quality and cost competitiveness. Product portfolio diversification, including specialized PAC grades tailored to complex wastewater conditions, is improving market differentiation.
Table of Contents
Chapter 1 Methodology
- 1.1 Market scope and definition
- 1.2 Research design
- 1.2.1 Research approach
- 1.2.2 Data collection methods
- 1.3 Data mining sources
- 1.3.1 Global
- 1.3.2 Regional/Country
- 1.4 Base estimates and calculations
- 1.4.1 Base year calculation
- 1.4.2 Key trends for market estimation
- 1.5 Primary research and validation
- 1.5.1 Primary sources
- 1.6 Forecast model
- 1.7 Research assumptions and limitations
Chapter 2 Executive Summary
- 2.1 Industry 360° synopsis
- 2.2 Key market trends
- 2.2.1 Regional
- 2.2.2 Form
- 2.2.3 Product Type
- 2.2.4 Grade
- 2.2.5 Basicity
- 2.2.6 Manufacturing Process
- 2.2.7 End-User Industry
- 2.2.8 Application
- 2.3 TAM Analysis, 2026-2035
- 2.4 CXO perspectives: Strategic imperatives
- 2.4.1 Executive decision points
- 2.4.2 Critical success factors
- 2.5 Future Outlook and Strategic Recommendations
Chapter 3 Industry Insights
- 3.1 Industry ecosystem analysis
- 3.1.1 Supplier Landscape
- 3.1.2 Profit Margin
- 3.1.3 Value addition at each stage
- 3.1.4 Factor affecting the value chain
- 3.1.5 Disruptions
- 3.2 Industry impact forces
- 3.2.1 Growth drivers
- 3.2.2 Industry pitfalls and challenges
- 3.2.3 Market opportunities
- 3.3 Growth potential analysis
- 3.4 Regulatory landscape
- 3.4.1 North America
- 3.4.2 Europe
- 3.4.3 Asia Pacific
- 3.4.4 Latin America
- 3.4.5 Middle East & Africa
- 3.5 Porter’s analysis
- 3.6 PESTEL analysis
- 3.7 Price trends
- 3.7.1 By region
- 3.7.2 By product
- 3.8 Future market trends
- 3.9 Technology and Innovation landscape
- 3.9.1 Current technological trends
- 3.9.2 Emerging technologies
- 3.10 Patent Landscape
- 3.11 Trade statistics (Note: the trade statistics will be provided for key countries only)
- 3.11.1 Major importing countries
- 3.11.2 Major exporting countries
- 3.12 Sustainability and Environmental Aspects
- 3.12.1 Sustainable Practices
- 3.12.2 Waste Reduction Strategies
- 3.12.3 Energy Efficiency in Production
- 3.12.4 Eco-friendly Initiatives
- 3.13 Carbon Footprint Considerations
Chapter 4 Competitive Landscape, 2025
- 4.1 Introduction
- 4.2 Company market share analysis
- 4.2.1 By region
- 4.2.1.1 North America
- 4.2.1.2 Europe
- 4.2.1.3 Asia Pacific
- 4.2.1.4 LATAM
- 4.2.1.5 MEA
- 4.2.1 By region
- 4.3 Company matrix analysis
- 4.4 Competitive analysis of major market players
- 4.5 Competitive positioning matrix
- 4.6 Key developments
- 4.6.1 Mergers & acquisitions
- 4.6.2 Partnerships & collaborations
- 4.6.3 New Product Launches
- 4.6.4 Expansion Plans
Chapter 5 Market Estimates and Forecast, By Form, 2022- 2035 (USD Billion, Kilo Tons)
- 5.1 Key trends
- 5.2 Liquid PAC
- 5.3 Powder PAC (spray-dried)
- 5.4 Granular PAC
- 5.5 Flaky PAC (drum-dried)
Chapter 6 Market Estimates and Forecast, By Product Type, 2022- 2035 (USD Billion, Kilo Tons)
- 6.1 Key trends
- 6.2 Poly aluminum chloride (PAC)
- 6.3 Polyaluminum chlorosulfate (PACS)
- 6.4 Aluminum chlorohydrate (ACH)
- 6.5 Composite PAC
- 6.6 Nano-PAC
Chapter 7 Market Estimates and Forecast, By Grade, 2022 - 2035 (USD Billion, Kilo Tons)
- 7.1 Key trends
- 7.2 Food grade PAC
- 7.3 Drinking water grade PAC
- 7.4 Industrial grade PAC
- 7.5 Filter grade PAC
Chapter 8 Market Estimates and Forecast, By Basicity, 2022 - 2035 (USD Billion, Kilo Tons)
- 8.1 Key trends
- 8.2 Low basicity
- 8.3 Medium basicity
- 8.4 High basicity
- 8.5 Ultra-high basicity
Chapter 9 Market Estimates and Forecast, By Manufacturing Process, 2022 - 2035 (USD Billion, Kilo Tons)
- 9.1 Key trends
- 9.2 Spray drying technology
- 9.3 Drum drying technology
- 9.4 Electrodialysis process
- 9.5 Acid-soluble aluminum ash method
Chapter 10 Market Estimates and Forecast, By End-User Industry, 2022 - 2035 (USD Billion, Kilo Tons)
- 10.1 Key trends
- 10.2 Water treatment
- 10.3 Pulp & paper industry
- 10.4 Textiles industry
- 10.5 Oil & gas industry
- 10.6 Pharmaceutical & cosmetics
- 10.7 Others
Chapter 11 Market Estimates and Forecast, By Application, 2022 - 2035 (USD Billion, Kilo Tons)
- 11.1 Key trends
- 11.2 Coagulation & flocculation
- 11.3 Sludge dewatering
- 11.4 Membrane pre-treatment
- 11.5 Phosphorus removal
- 11.6 Heavy metal removal
- 11.7 Organic matter & NOM removal
- 11.8 Others
Chapter 12 Market Estimates and Forecast, By Region, 2022 - 2035 (USD Billion, Kilo Tons)
- 12.1 Key trends
- 12.2 North America
- 12.2.1 U.S.
- 12.2.2 Canada
- 12.3 Europe
- 12.3.1 Germany
- 12.3.2 UK
- 12.3.3 France
- 12.3.4 Italy
- 12.3.5 Spain
- 12.3.6 Rest of Europe
- 12.4 Asia Pacific
- 12.4.1 China
- 12.4.2 India
- 12.4.3 Japan
- 12.4.4 Australia
- 12.4.5 South Korea
- 12.4.6 Rest of Asia Pacific
- 12.5 Latin America
- 12.5.1 Brazil
- 12.5.2 Mexico
- 12.5.3 Argentina
- 12.5.4 Rest of Latin America
- 12.6 Middle East & Africa
- 12.6.1 Saudi Arabia
- 12.6.2 South Africa
- 12.6.3 UAE
- 12.6.4 Rest of Middle East & Africa
Chapter 13 Company Profiles
- 13.1 Alumichem A/S
- 13.2 Biosynth
- 13.3 CHALCO Advanced Material Co., Ltd.
- 13.4 EMCO Dyestuff
- 13.5 Fengchen Group Co.,Ltd
- 13.6 GEO Specialty Chemicals
- 13.7 Henan Chemger Group Corporation
- 13.8 Henan Yuanbo Environmental Technology Co., Ltd.
- 13.9 Kavya Pharma
- 13.10 Kemira Oyj
- 13.11 N. R. CHEMICALS
- 13.12 Taki Chemical
- 13.13 USALCO
- 13.14 Venator Materials
 聚合氯化鋁市場:依形態、純度及應用分類-2026-2032年全球市場預測
 全球聚合氯化鋁市場規模、佔有率、趨勢和成長分析報告(2026-2034)
 2026年全球聚合氯化鋁市場報告
 氯化鋁市場-全球產業規模、佔有率、趨勢、機會及預測(依生產方法、應用、最終用途產業、地區及競爭格局分類),2021-2031年無水氯化鋁市場-2025-2030年預測無水氯化鋁市場-全球產業規模、佔有率、趨勢、機會和預測(按形式、應用、地區和競爭細分,2020-2030 年)全球聚合氯化鋁市場規模(按類型、等級、應用、區域範圍和預測)
 無水氯化鋁-市場佔有率分析、產業趨勢與統計、成長預測(2025-2030)