


 |
市場調查報告書
商品編碼
1982365
飲料包裝市場商機、成長要素、產業趨勢分析及2026-2035年預測。Beverage Packaging Market Opportunity, Growth Drivers, Industry Trend Analysis, and Forecast 2026 - 2035 |
||||||

預計到 2025 年,全球飲料包裝市場價值將達到 1,747 億美元,並預計以 5.6% 的複合年成長率成長,到 2035 年達到 2,953 億美元。
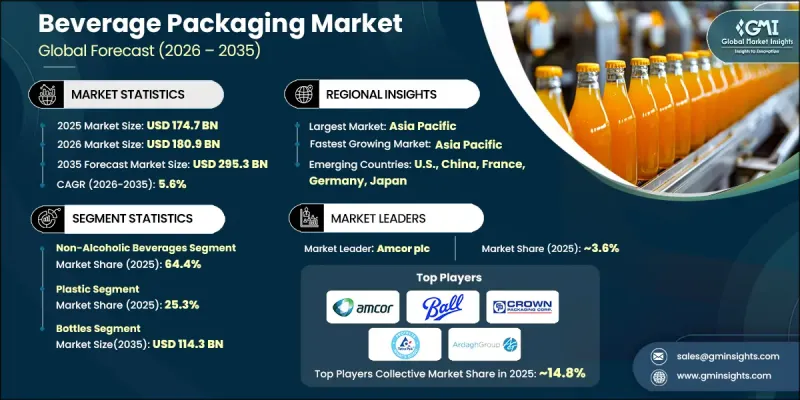
這一強勁成長主要得益於已開發市場和新興市場包裝飲料消費量的不斷成長。快速的都市化、快節奏的生活方式以及消費者對便利、單份和便攜飲料形式的日益偏好,正在加速對輕量瓶裝、罐裝、紙盒裝和軟包裝袋的需求。瓶裝水、碳酸飲料、即飲茶和咖啡以及健康飲料銷售的成長,支撐著市場的持續發展勢頭。製造商正致力於提升產品安全性、延長保存期限並增強品牌知名度的包裝設計。同時,材料和製造流程的技術進步也提高了效率並最佳化了成本。優質化、客製化和機能飲料的興起,持續推動包裝創新。零售市場滲透率的提高和現代分銷管道的拓展,進一步增強了全球需求。總體而言,在消費者偏好變化、監管趨勢以及價值鏈上持續不斷的材料創新等因素的支撐下,飲料包裝行業預計將保持穩定的中等個位數成長。
| 市場範圍 | |
|---|---|
| 開始年份 | 2025 |
| 預測期 | 2026-2035 |
| 上市時的市場規模 | 1747億美元 |
| 預測金額 | 2953億美元 |
| 複合年成長率 | 5.6% |
環境永續性在重塑飲料包裝市場格局中發揮著至關重要的作用。日益嚴格的環境影響法規和不斷增強的消費者環保意識正促使企業採用可回收、可生物分解和低排放的包裝材料。安姆科公司 (Amcor plc)、波爾公司 (Ball Corporation) 和利樂國際公司 (Tetra Pak International SA) 等行業領導者正投資於循環經濟項目、輕量化解決方案以及提高再生材料含量,以符合永續性目標。同時,智慧互聯包裝技術也日益受到關注。數位標籤、可追溯性工具和互動式包裝等功能正在提高供應鏈透明度,並增強消費者參與度,尤其是在高階飲料領域。此外,電子商務和 D2C(直接面對消費者)分銷模式的快速發展,也迫使製造商設計出在運輸過程中更加耐用、結構強度更高、保存期限更長的包裝。
預計2026年至2035年間,酒精飲料市場將以4.7%的複合年成長率成長。消費者對高階酒精飲料和便利即飲包裝的需求不斷成長,推動了玻璃和可回收金屬包裝解決方案的創新。可支配收入的增加、消費模式的轉變以及對美觀包裝的需求,都促進了該市場的成長。永續和輕量化的包裝形式,以及線上零售通路的拓展,正在推動以消費者為導向且注重環保的包裝設計進行投資。
預計到2025年,塑膠包裝市佔率將達到25.3%。其成長主要得益於成本效益、輕量化特性以及PET材料與高速生產線的兼容性。塑膠包裝在全球仍被廣泛用於瓶裝水、軟性飲料和機能飲料等領域。再生材料的日益普及和回收技術的進步正在提升永續性。此外,持續推進的輕量化措施正在減少原料消耗並最佳化運輸效率。
到2025年,北美飲料包裝市佔率將達到21.3%。這項區域擴張的驅動力在於消費者對永續和可回收包裝形式的日益偏好,以及對便捷攜帶式飲料解決方案的強勁需求。先進的製造能力和持續的產品優質化正在推動市場發展。對輕量寶特瓶、鋁罐和智慧包裝技術的投資正在提升營運效率和消費者參與。機能飲料和即飲產品的成長進一步加速了美國、加拿大和墨西哥的包裝創新。
目錄
第1章:調查方法和範圍
第2章執行摘要
第3章業界考察
- 生態系分析
- 供應商情況
- 利潤率分析
- 成本結構
- 每個階段增加的價值
- 影響價值鏈的因素
- 中斷
- 影響產業的因素
- 促進因素
- 對永續和環保包裝的需求日益成長
- 即飲飲料消費量增加
- 消費者對高階飲品的偏好日益成長
- 注重獨特的品牌形象和個性化包裝
- 都市化和生活方式的改變
- 產業潛在風險與挑戰
- 原料成本上漲
- 全球回收能力的不平衡
- 市場機遇
- 實施循環經濟和閉合迴路解決方案
- 智慧互動包裝技術的整合
- 促進因素
- 監理情勢
- 波特五力分析
- PESTEL 分析
- 科技與創新趨勢
- 當前技術趨勢
- 新興技術
- 新興經營模式
- 合規要求
- 專利和智慧財產權分析
- 地緣政治和貿易趨勢
第4章 競爭情勢
- 介紹
- 企業市佔率分析
- 按地區
- 主要企業的競爭標竿分析
- 財務績效比較
- 銷售量
- 利潤率
- 研究與發展(R&D)
- 產品系列比較
- 產品線
- 科技
- 創新
- 區域擴張比較
- 全球擴張分析
- 服務網路覆蓋
- 按地區分類的市場滲透率
- 競爭定位矩陣
- 領導者
- 挑戰者
- 追蹤者
- 小眾玩家
- 戰略展望矩陣
- 財務績效比較
- 2022-2025 年重大發展
- 併購
- 夥伴關係和聯盟
- 技術進步
- 業務拓展與投資策略
- 數位轉型計劃
- 新興/Start-Ups競爭對手的發展趨勢
第5章 市場估價與預測:依包裝類型分類,2022-2035年
- 硬包裝
- 半剛性包裝
- 軟包裝
第6章 市場估算與預測:依產品類型分類,2022-2035年
- 瓶子
- 能
- 紙盒
- 小袋
- 桶
- 其他
第7章 市場估計與預測:依材料分類,2022-2035年
- 塑膠
- 玻璃
- 金屬
- 紙張和紙板
- 其他
第8章 市場估算與預測:依飲料類型分類,2022-2035年
- 不含酒精的飲料
- 酒精飲料
第9章 市場估計與預測:依最終用戶產業分類,2022-2035年
- 無菌包裝
- 熱填充包裝
- 冷灌裝和常規包裝
第10章 市場估價與預測:依地區分類,2022-2035年
- 北美洲
- 美國
- 加拿大
- 歐洲
- 德國
- 英國
- 法國
- 西班牙
- 義大利
- 荷蘭
- 亞太地區
- 中國
- 印度
- 日本
- 澳洲
- 韓國
- 拉丁美洲
- 巴西
- 墨西哥
- 阿根廷
- 中東和非洲
- 南非
- 沙烏地阿拉伯
- 阿拉伯聯合大公國
第11章:公司簡介
- Amcor plc
- Ardagh Group SA
- Ball Corporation
- CANPACK
- CCL Container
- CPMC Holdings
- Crown
- Graham Packaging
- Graphic Packaging International, LLC
- Novelis
- Plastipak Holdings, Inc.
- SIG.
- Silgan Plastics
- Smurfit Westrock
- Stora Enso
- Tetra Pak International SA
- Visy
The Global Beverage Packaging Market was valued at USD 174.7 billion in 2025 and is estimated to grow at a CAGR of 5.6% to reach USD 295.3 billion by 2035.
Strong growth is driven by rising consumption of packaged beverages across developed and emerging economies. Rapid urban expansion, fast-paced consumer lifestyles, and increasing preference for convenient, single-serve, and portable beverage formats are accelerating demand for lightweight bottles, cans, cartons, and flexible pouches. Expanding sales of bottled water, carbonated drinks, ready-to-drink tea and coffee, and health-oriented beverages are supporting sustained market momentum. Manufacturers are focusing on packaging designs that enhance product safety, extend shelf life, and improve brand visibility. At the same time, technological advancements in materials and production processes are improving efficiency and cost optimization. The shift toward premiumization, customization, and functional beverage offerings continues to stimulate packaging innovation. Growing retail penetration and the expansion of modern trade channels are further strengthening global demand. Overall, the beverage packaging industry is positioned for steady mid-single-digit growth, supported by evolving consumer preferences, regulatory developments, and ongoing material innovation across the value chain.
| Market Scope | |
|---|---|
| Start Year | 2025 |
| Forecast Year | 2026-2035 |
| Start Value | $174.7 Billion |
| Forecast Value | $295.3 Billion |
| CAGR | 5.6% |
Environmental sustainability plays a pivotal role in reshaping the beverage packaging market landscape. Stricter regulations and heightened consumer awareness regarding environmental impact are encouraging companies to adopt recyclable, biodegradable, and low-emission packaging materials. Industry leaders such as Amcor plc, Ball Corporation, and Tetra Pak International S.A. are investing in circular economy initiatives, lightweight solutions, and higher recycled content integration to align with sustainability targets. In parallel, smart and connected packaging technologies are gaining traction. Features such as digital labeling, traceability tools, and interactive packaging formats are enhancing supply chain transparency and strengthening consumer engagement, particularly within premium beverage categories. Additionally, the rapid rise of e-commerce and direct-to-consumer distribution models is prompting manufacturers to design packaging that offers improved durability, structural integrity, and shelf-life performance during transportation.
The alcoholic beverages segment is expected to grow at a CAGR of 4.7% between 2026 and 2035. Increasing demand for premium alcoholic drinks and convenient ready-to-consume formats is driving innovation in glass and recyclable metal packaging solutions. Rising disposable income levels, evolving consumption patterns, and demand for aesthetically appealing packaging are contributing to segment growth. Sustainable and lightweight packaging formats, along with expanding online retail distribution, are encouraging investment in consumer-focused and environmentally responsible packaging designs.
The plastic segment accounted for 25.3% share in 2025. Growth is supported by the cost efficiency, lightweight characteristics, and compatibility of PET materials with high-speed production lines. Plastic packaging remains widely used across bottled water, soft drinks, and functional beverage categories worldwide. Increased utilization of post-consumer recycled materials and advancements in recycling technologies are strengthening sustainability performance. Ongoing lightweighting initiatives are also reducing raw material consumption and optimizing transportation efficiency.
North America Beverage Packaging Market held 21.3% share in 2025. Regional expansion is driven by rising preference for sustainable and recyclable packaging formats, combined with strong demand for convenient, on-the-go beverage solutions. Advanced manufacturing capabilities and continued product premiumization are reinforcing market development. Investments in lightweight PET bottles, aluminum cans, and smart packaging technologies are enhancing operational efficiency and consumer interaction. Growth in functional beverages and ready-to-drink products is further accelerating packaging innovation across the United States, Canada, and Mexico.
Prominent companies operating in the Global Beverage Packaging Market include Ardagh Group S.A., Crown, Smurfit Westrock, CANPACK, Novelis, Graham Packaging, CPMC Holdings, Plastipak Holdings, Inc., Silgan Plastics, Graphic Packaging International, LLC, SIG, Stora Enso, Visy, CCL Container, and Amcor plc. Companies in the Global Beverage Packaging Market are strengthening their competitive position through continuous investment in sustainable materials, lightweight designs, and recyclable packaging innovations. Strategic mergers, acquisitions, and partnerships are expanding production capabilities and geographic reach. Many firms are enhancing research and development efforts to introduce advanced barrier technologies and smart packaging features that improve traceability and consumer engagement. Optimization of supply chains and automation of manufacturing processes are helping reduce operational costs and improve efficiency.
Table of Contents
Chapter 1 Methodology and Scope
- 1.1 Market scope and definition
- 1.2 Research design
- 1.2.1 Research approach
- 1.2.2 Data collection methods
- 1.3 Data mining sources
- 1.3.1 Global
- 1.3.2 Regional/Country
- 1.4 Base estimates and calculations
- 1.4.1 Base year calculation
- 1.4.2 Key trends for market estimation
- 1.5 Primary research and validation
- 1.5.1 Primary sources
- 1.6 Forecast model
- 1.7 Research assumptions and limitations
Chapter 2 Executive Summary
- 2.1 Industry 360° synopsis, 2022 - 2035
- 2.2 Key market trends
- 2.2.1 System type trends
- 2.2.2 Deployment model trends
- 2.2.3 End-user industry trends
- 2.2.4 Regional trends
- 2.3 TAM analysis, 2026-2035
- 2.4 CXO perspectives: Strategic imperatives
- 2.4.1 Executive decision points
- 2.4.2 Critical success factors
- 2.5 Future outlook and strategic recommendations
Chapter 3 Industry Insights
- 3.1 Industry ecosystem analysis
- 3.1.1 Supplier landscape
- 3.1.2 Profit margin analysis
- 3.1.3 Cost structure
- 3.1.4 Value addition at each stage
- 3.1.5 Factor affecting the value chain
- 3.1.6 Disruptions
- 3.2 Industry impact forces
- 3.2.1 Growth drivers
- 3.2.1.1 Growing demand for sustainability & eco friendly packaging
- 3.2.1.2 Increased consumption in ready to drink (RTD) beverages
- 3.2.1.3 Increasing consumer preference for premium drinks
- 3.2.1.4 Focus on unique branding and personalized packaging
- 3.2.1.5 Rising urbanization & changing lifestyles
- 3.2.2 Industry pitfalls and challenges
- 3.2.2.1 Rising raw material costs
- 3.2.2.2 Inconsistent global recycling capabilities
- 3.2.3 Market opportunities
- 3.2.3.1 Adoption of circular economy & closed loop solutions
- 3.2.3.2 Integration of smart and interactive packaging technologies
- 3.2.1 Growth drivers
- 3.3 Regulatory landscape
- 3.3.1 North America
- 3.3.2 Europe
- 3.3.3 Asia Pacific
- 3.3.4 Latin America
- 3.3.5 Middle East & Africa
- 3.4 Porter's analysis
- 3.5 PESTEL analysis
- 3.6 Technology and innovation landscape
- 3.6.1 Current technological trends
- 3.6.2 Emerging technologies
- 3.7 Emerging business models
- 3.8 Compliance requirements
- 3.9 Patent and IP analysis
- 3.10 Geopolitical and trade dynamics
Chapter 4 Competitive Landscape, 2025
- 4.1 Introduction
- 4.2 Company market share analysis
- 4.2.1 By region
- 4.2.1.1 North America
- 4.2.1.2 Europe
- 4.2.1.3 Asia Pacific
- 4.2.1.4 Latin America
- 4.2.1.5 Middle East & Africa
- 4.2.1 By region
- 4.3 Competitive benchmarking of key players
- 4.3.1 Financial performance comparison
- 4.3.1.1 Revenue
- 4.3.1.2 Profit margin
- 4.3.1.3 R&D
- 4.3.2 Product portfolio comparison
- 4.3.2.1 Product range breadth
- 4.3.2.2 Technology
- 4.3.2.3 Innovation
- 4.3.3 Geographic presence comparison
- 4.3.3.1 Global footprint analysis
- 4.3.3.2 Service network coverage
- 4.3.3.3 Market penetration by region
- 4.3.4 Competitive positioning matrix
- 4.3.4.1 Leaders
- 4.3.4.2 Challengers
- 4.3.4.3 Followers
- 4.3.4.4 Niche players
- 4.3.5 Strategic outlook matrix
- 4.3.1 Financial performance comparison
- 4.4 Key developments, 2022-2025
- 4.4.1 Mergers and acquisitions
- 4.4.2 Partnerships and collaborations
- 4.4.3 Technological advancements
- 4.4.4 Expansion and investment strategies
- 4.4.5 Digital transformation initiatives
- 4.5 Emerging/ startup competitors' landscape
Chapter 5 Market Estimates and Forecast, By Packaging Type, 2022 - 2035 (USD Billion, Units)
- 5.1 Key trends
- 5.2 Rigid Packaging
- 5.3 Semi-Rigid Packaging
- 5.4 Flexible Packaging
Chapter 6 Market Estimates and Forecast, By Product Type, 2022 - 2035 (USD Billion, Units)
- 6.1 Key trends
- 6.2 Bottles
- 6.3 Cans
- 6.4 Cartons
- 6.5 Pouches & Sachets
- 6.6 Kegs & Barrels
- 6.7 Others
Chapter 7 Market Estimates and Forecast, By Material, 2022 - 2035 (USD Billion, Units)
- 7.1 Key trends
- 7.2 Plastic
- 7.3 Glass
- 7.4 Metal
- 7.5 Paper & Boards
- 7.6 Others
Chapter 8 Market Estimates and Forecast, By Beverage Type, 2022 - 2035 (USD Billion, Units)
- 8.1 Key trends
- 8.2 Non-Alcoholic Beverages
- 8.3 Alcoholic Beverages
Chapter 9 Market Estimates and Forecast, By End-User Industry, 2022 - 2035 (USD Billion, Units)
- 9.1 Key trends
- 9.2 Aseptic Packaging
- 9.3 Hot-Fill Packaging
- 9.4 Cold-Fill & Conventional Packaging
Chapter 10 Market Estimates and Forecast, By Region, 2022 - 2035 (USD Billion, Units)
- 10.1 Key trends
- 10.2 North America
- 10.2.1 U.S.
- 10.2.2 Canada
- 10.3 Europe
- 10.3.1 Germany
- 10.3.2 UK
- 10.3.3 France
- 10.3.4 Spain
- 10.3.5 Italy
- 10.3.6 Netherlands
- 10.4 Asia Pacific
- 10.4.1 China
- 10.4.2 India
- 10.4.3 Japan
- 10.4.4 Australia
- 10.4.5 South Korea
- 10.5 Latin America
- 10.5.1 Brazil
- 10.5.2 Mexico
- 10.5.3 Argentina
- 10.6 Middle East and Africa
- 10.6.1 South Africa
- 10.6.2 Saudi Arabia
- 10.6.3 UAE
Chapter 11 Company Profiles
- 11.1 Amcor plc
- 11.2 Ardagh Group S.A.
- 11.3 Ball Corporation
- 11.4 CANPACK
- 11.5 CCL Container
- 11.6 CPMC Holdings
- 11.7 Crown
- 11.8 Graham Packaging
- 11.9 Graphic Packaging International, LLC
- 11.10 Novelis
- 11.11 Plastipak Holdings, Inc.
- 11.12 SIG.
- 11.13 Silgan Plastics
- 11.14 Smurfit Westrock
- 11.15 Stora Enso
- 11.16 Tetra Pak International S.A.
- 11.17 Visy

 全球飲料包裝市場規模、佔有率、趨勢和成長分析報告(2026-2034年)
 飲料包裝市場:2026-2032年全球市場預測(依飲料類型、材料類型、包裝形式、營運模式及通路分類)
 2026年全球飲料包裝市場報告
 全球飲料包裝市場:市場規模與預測(2034 年)
 日本包裝飲料市場規模、佔有率、趨勢和預測:按類型、包裝類型、通路和地區分類,2026-2034年熱灌裝包裝全球市場報告(2026年)日本飲料包裝市場報告:按材料、產品、應用和地區分類(2026-2034年)
 飲料包裝創新市場預測至2032年:按材料、包裝類型、創新類型、飲料類別、技術、最終用戶和地區分類的全球分析
 飲料容器回收市場機會、成長促進因素、產業趨勢分析及預測(2025-2034年)2032 年塑膠中性水市場預測:按產品類型、包裝類型、塑膠中性機制、價格分佈範圍、分銷管道、最終用戶和地區進行的全球分析