


 |
市場調查報告書
商品編碼
1982339
航空衍生燃氣渦輪機市場:成長機會、成長要素、產業趨勢分析及 2026-2035 年預測。Aeroderivative Gas Turbine Market Opportunity, Growth Drivers, Industry Trend Analysis, and Forecast 2026 - 2035 |
||||||
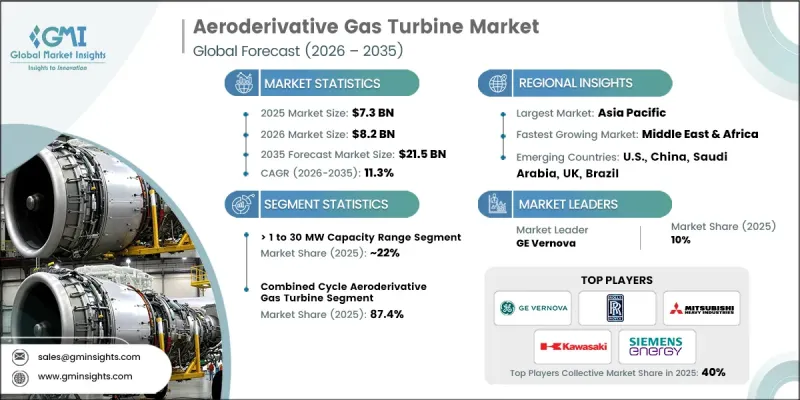
全球航空衍生燃氣渦輪機市場預計到 2025 年價值 73 億美元,預計到 2035 年將達到 215 億美元,年複合成長率為 11.3%。
為滿足日益成長的全球能源需求,天然氣開採和輸送領域的投資不斷增加,推動了該產業的發展。微電網的擴展以及降低大型火力發電廠資本支出的努力,進一步促進了燃氣渦輪機的應用。基於飛機噴射引擎的航空燃氣渦輪機,集輕量化設計、高效率、模組化結構、高壓縮比和快速可再生以及針對尖峰負載和備用電源運行的更嚴格的排放法規,正在提升市場潛力。人工智慧驅動的預測性維護、數位雙胞胎整合以及與可再生能源系統的無縫連接等技術進步,正在推動產業轉型。對能源安全、成本效益和長期永續性的關注,也對市場成長產生影響。
| 市場範圍 | |
|---|---|
| 開始年份 | 2025 |
| 預測期 | 2026-2035 |
| 上市時的市場規模 | 73億美元 |
| 預計金額 | 215億美元 |
| 複合年成長率 | 11.3% |
預計到 2025 年,1-30 兆瓦容量段將佔 22% 的市場佔有率,到 2035 年將以 11.5% 的複合年成長率成長。這些渦輪機非常適合需要高持續輸出的行業,例如石油和天然氣、工業製造以及擴建電網成本高或不切實際的偏遠地區作業。
預計到2025年,複合迴圈和衍生燃氣渦輪機市場佔有率將達到87.4%,到2035年市場規模將達到150億美元。複合迴圈適用於工業園區、校園和公用事業規模計劃的高效、長時運行,具有熱效率低、輸出連續的特性。從燃煤發電轉向更清潔的替代能源進一步推動了市場成長。
預計到 2025 年,美國航空衍生燃氣渦輪機市場將佔據 72% 的佔有率。這一成長是由向先進燃氣渦輪機技術的轉變、減少碳排放的努力以及遵守嚴格的環境法規所推動的。
目錄
第1章:調查方法和範圍
第2章執行摘要
第3章業界考察
- 生態系分析
- 原物料供應及採購分析
- 生產能力評估
- 供應鏈韌性與風險因素
- 配電網路分析
- 影響產業的因素
- 促進因素
- 產業潛在風險與挑戰
- 監理情勢
- 成長潛力分析
- 價格趨勢分析(美元/兆瓦)
- 按地區
- 按產能
- 波特的分析
- 供應商的議價能力
- 買方的議價能力
- 新進入者的威脅
- 替代品的威脅
- PESTEL 分析
- 航空衍生燃氣渦輪機的成本結構分析
- 新機會和趨勢
- 數位化和物聯網整合
- 進入新興市場
- 投資分析及未來展望
第4章 競爭情勢
- 介紹
- 企業市佔率分析:按地區分類
- 北美洲
- 歐洲
- 亞太地區
- 中東和非洲
- 拉丁美洲
- 競爭定位矩陣
- 主要進展
- 併購
- 夥伴關係與合作
- 新產品發布
- 業務拓展計劃及資金籌措
第5章 市場規模及預測:依產能分類,2022-2035年
- 50 kW
- 50~500 kW
- >500 kW~1 MW
- >1~30 MW
- >30~70 MW
- >70 MW
第6章 市場規模及預測:依技術分類,2022-2035年
- 開式循環
- 複合循環
第7章 市場規模及預測:依應用領域分類,2022-2035年
- 發電廠
- 石油和天然氣
- 加工廠
- 航空
- 船
- 其他
第8章 市場規模及預測:依地區分類,2022-2035年
- 北美洲
- 美國
- 加拿大
- 墨西哥
- 歐洲
- 英國
- 法國
- 德國
- 俄羅斯
- 義大利
- 荷蘭
- 丹麥
- 波蘭
- 瑞典
- 亞太地區
- 中國
- 澳洲
- 日本
- 印度
- 韓國
- 印尼
- 泰國
- 馬來西亞
- 中東和非洲
- 沙烏地阿拉伯
- 阿拉伯聯合大公國
- 卡達
- 科威特
- 阿曼
- 埃及
- 土耳其
- 伊拉克
- 南非
- 奈及利亞
- 阿爾及利亞
- 拉丁美洲
- 巴西
- 阿根廷
- 智利
第9章:公司簡介
- Ansaldo Energia
- Baker Hughes
- Capstone Green Energy
- Collins Aerospace
- Destinus Energy
- Doosan Enerbility
- Everllence
- GE Vernova
- Harbin Electric
- Honeywell International
- IHI Corporation
- Kawasaki Heavy Industries
- Mitsubishi Heavy Industries
- Nanjing Turbine &Electric Machinery
- Pratt &Whitney
- Rolls-Royce
- Safran
- Siemens Energy
- Vericor
- Wartsila
The Global Aeroderivative Gas Turbine Market was valued at USD 7.3 billion in 2025 and is estimated to grow at a CAGR of 11.3% to reach USD 21.5 billion by 2035.
The industry is driven by increasing investments in natural gas extraction and distribution to meet growing global energy demand. Expansion of microgrids and the effort to reduce capital expenditures for large-scale thermal plants are further boosting adoption. Aeroderivative gas turbines, adapted from aircraft jet engines, combine lightweight design with high efficiency, modular construction, high compression ratios, and rapid start-up capabilities. These turbines offer broad fuel flexibility, low start-up times, and robust performance, making them suitable for both grid-connected and standalone power systems. The transition to renewable fuels and stricter emission regulations for peak load and backup operations are enhancing market potential. Advancements such as AI-powered predictive maintenance, digital twin integration, and seamless connection with renewable systems are reshaping the industry. A focus on energy security, cost efficiency, and long-term sustainability is also influencing market growth.
| Market Scope | |
|---|---|
| Start Year | 2025 |
| Forecast Year | 2026-2035 |
| Start Value | $7.3 Billion |
| Forecast Value | $21.5 Billion |
| CAGR | 11.3% |
The >1 to 30 MW capacity segment accounted for 22% share in 2025 and is projected to grow at a CAGR of 11.5% through 2035. These turbines are ideal for sectors requiring high continuous power output, including oil and gas, industrial manufacturing, and remote operations where extending the grid is costly or impractical.
The combined cycle aeroderivative gas turbine segment held an 87.4% share in 2025 and is expected to reach USD 15 billion by 2035. Combined cycle systems are favored for high-efficiency, long-duration operations in industrial parks, campuses, and utility-scale projects, offering lower heat rates and continuous output. The shift from coal-based generation to cleaner alternatives is further supporting market growth.
U.S. Aeroderivative Gas Turbine Market held a 72% share in 2025. Adoption is driven by the move toward advanced gas turbine technology, carbon reduction commitments, and compliance with stringent environmental regulations.
Key players operating in the Global Aeroderivative Gas Turbine Market include Ansaldo Energia, Destinus Energy, Capstone Green Energy, Doosan Enerbility, Everllence, GE Vernova, Harbin Electric, Honeywell International, IHI Corporation, Kawasaki Heavy Industries, Mitsubishi Heavy Industries, Nanjing Turbine & Electric Machinery, Pratt & Whitney, Rolls-Royce, Safran, Siemens Energy, Vericor, Baker Hughes, and Collins Aerospace. Companies in the Aeroderivative Gas Turbine Market are implementing multiple strategies to strengthen their foothold. They are investing in research and development to enhance turbine efficiency, fuel flexibility, and start-up speed while integrating AI and predictive maintenance solutions. Strategic partnerships and joint ventures are being formed to expand geographic reach and share development risks. Firms are diversifying portfolios by combining turbines with renewable energy systems and offering turnkey solutions for microgrid and industrial applications. Market leaders are also focusing on servicing, retrofitting, and upgrading existing installations to retain clients while acquiring new ones. Additionally, leveraging government incentives and financing programs helps reduce project costs, increasing market penetration and competitiveness.
Table of Contents
Chapter 1 Methodology & Scope
- 1.1 Research design
- 1.2 Quality commitments
- 1.2.1 GMI AI policy & data integrity commitment
- 1.2.1.1 Source consistency protocol
- 1.2.1 GMI AI policy & data integrity commitment
- 1.3 Research trail & confidence scoring
- 1.3.1 Research trail components
- 1.3.2 Scoring components
- 1.4 Data collection
- 1.4.1 Partial list of primary sources
- 1.5 Data mining sources
- 1.5.1 Paid sources
- 1.5.1.1 Sources, by region
- 1.5.1 Paid sources
- 1.6 Base estimates and calculations
- 1.6.1 Base year calculation for any one approach
- 1.7 Forecast model
- 1.7.1 Quantified market impact analysis
- 1.7.1.1 Mathematical impact of growth parameters on forecast
- 1.7.1 Quantified market impact analysis
- 1.8 Research transparency addendum
- 1.8.1 Source attribution framework
- 1.8.2 Quality assurance metrics
- 1.8.3 Our commitment to trust
- 1.9 Market definitions
Chapter 2 Executive Summary
- 2.1 Industry synopsis, 2022 - 2035
- 2.1.1 Business trends
- 2.1.2 Capacity trends
- 2.1.3 Technology trends
- 2.1.4 Application trends
- 2.1.5 Regional trends
Chapter 3 Industry Insights
- 3.1 Industry ecosystem analysis
- 3.1.1 Raw material availability & sourcing analysis
- 3.1.2 Manufacturing capacity assessment
- 3.1.3 Supply chain resilience & risk factors
- 3.1.4 Distribution network analysis
- 3.2 Industry impact forces
- 3.2.1 Growth drivers
- 3.2.2 Industry pitfalls & challenges
- 3.3 Regulatory landscape
- 3.4 Growth potential analysis
- 3.5 Price trend analysis (USD/MW)
- 3.5.1 By region
- 3.5.2 By capacity
- 3.6 Porter's analysis
- 3.6.1 Bargaining power of suppliers
- 3.6.2 Bargaining power of buyers
- 3.6.3 Threat of new entrants
- 3.6.4 Threat of substitutes
- 3.7 PESTEL analysis
- 3.7.1 Political factors
- 3.7.2 Economic factors
- 3.7.3 Social factors
- 3.7.4 Technological factors
- 3.7.5 Legal factors
- 3.7.6 Environmental factors
- 3.8 Cost structure analysis of aeroderivative gas turbines
- 3.9 Emerging opportunities & trends
- 3.9.1 Digitalization & IoT integration
- 3.9.2 Emerging market penetration
- 3.10 Investment analysis & future prospects
Chapter 4 Competitive Landscape, 2026
- 4.1 Introduction
- 4.2 Company market share analysis, by region, 2025
- 4.2.1 North America
- 4.2.2 Europe
- 4.2.3 Asia Pacific
- 4.2.4 Middle East & Africa
- 4.2.5 Latin America
- 4.3 Competitive positioning matrix
- 4.4 Key developments
- 4.4.1 Mergers & acquisitions
- 4.4.2 Partnerships & collaborations
- 4.4.3 New product launches
- 4.4.4 Expansion plans & funding
Chapter 5 Market Size and Forecast, By Capacity, 2022 - 2035 (USD Million & MW)
- 5.1 Key trends
- 5.2 50 kW
- 5.3 > 50 to 500 kW
- 5.4 > 500 kW to 1 MW
- 5.5 > 1 to 30 MW
- 5.6 > 30 to 70 MW
- 5.7 > 70 MW
Chapter 6 Market Size and Forecast, By Technology, 2022 - 2035 (USD Million & MW)
- 6.1 Key trends
- 6.2 Open cycle
- 6.3 Combined cycle
Chapter 7 Market Size and Forecast, By Application, 2022 - 2035 (USD Million & MW)
- 7.1 Key trends
- 7.2 Power plants
- 7.3 Oil & gas
- 7.4 Process plants
- 7.5 Aviation
- 7.6 Marine
- 7.7 Others
Chapter 8 Market Size and Forecast, By Region, 2022 - 2035 (USD Million & MW)
- 8.1 Key trends
- 8.2 North America
- 8.2.1 U.S.
- 8.2.2 Canada
- 8.2.3 Mexico
- 8.3 Europe
- 8.3.1 UK
- 8.3.2 France
- 8.3.3 Germany
- 8.3.4 Russia
- 8.3.5 Italy
- 8.3.6 Netherlands
- 8.3.7 Denmark
- 8.3.8 Poland
- 8.3.9 Sweden
- 8.4 Asia Pacific
- 8.4.1 China
- 8.4.2 Australia
- 8.4.3 Japan
- 8.4.4 India
- 8.4.5 South Korea
- 8.4.6 Indonesia
- 8.4.7 Thailand
- 8.4.8 Malaysia
- 8.5 Middle East & Africa
- 8.5.1 Saudi Arabia
- 8.5.2 UAE
- 8.5.3 Qatar
- 8.5.4 Kuwait
- 8.5.5 Oman
- 8.5.6 Egypt
- 8.5.7 Turkey
- 8.5.8 Iraq
- 8.5.9 South Africa
- 8.5.10 Nigeria
- 8.5.11 Algeria
- 8.6 Latin America
- 8.6.1 Brazil
- 8.6.2 Argentina
- 8.6.3 Chile
Chapter 9 Company Profiles
- 9.1 Ansaldo Energia
- 9.2 Baker Hughes
- 9.3 Capstone Green Energy
- 9.4 Collins Aerospace
- 9.5 Destinus Energy
- 9.6 Doosan Enerbility
- 9.7 Everllence
- 9.8 GE Vernova
- 9.9 Harbin Electric
- 9.10 Honeywell International
- 9.11 IHI Corporation
- 9.12 Kawasaki Heavy Industries
- 9.13 Mitsubishi Heavy Industries
- 9.14 Nanjing Turbine & Electric Machinery
- 9.15 Pratt & Whitney
- 9.16 Rolls-Royce
- 9.17 Safran
- 9.18 Siemens Energy
- 9.19 Vericor
- 9.20 Wartsila
 2026-2030年全球航空指令燃氣渦輪機市場
 複合迴圈航空燃氣渦輪機市場:商業機會、成長要素、產業趨勢分析及2026-2035年預測
 飛機燃氣渦輪機市場:按產能、技術、應用和地區分類(2026-2034 年)
 航空燃氣渦輪機市場:2026-2032年全球市場預測(按應用、功率範圍、最終用戶、燃料類型、技術和安裝方式分類)
 全球航空衍生燃氣渦輪機市場規模、佔有率、趨勢和成長分析報告(2026-2034)
 航空燃氣渦輪機市場-全球產業規模、佔有率、趨勢、機會與預測:產能、技術、應用、區域和競爭格局,2021-2031年
 航空衍生燃氣渦輪機市場規模、佔有率和成長分析(按技術、循環、功率、燃料類型、應用、最終用途產業和地區分類)-2026-2033年產業預測
 複合迴圈航空衍生燃氣渦輪機的全球市場航空衍生型燃氣渦輪機服務市場機會、成長動力、產業趨勢分析及 2025 - 2034 年預測