


 |
市場調查報告書
商品編碼
1959629
電池驅動電動巴士市場:機會、成長要素、產業趨勢分析以及 2026 年至 2035 年的預測。Battery Electric Buses Market Opportunity, Growth Drivers, Industry Trend Analysis, and Forecast 2026 - 2035 |
||||||
2025 年全球電池驅動電動巴士市場價值 430 億美元,預計到 2035 年將達到 1,968 億美元,年複合成長率為 16.1%。
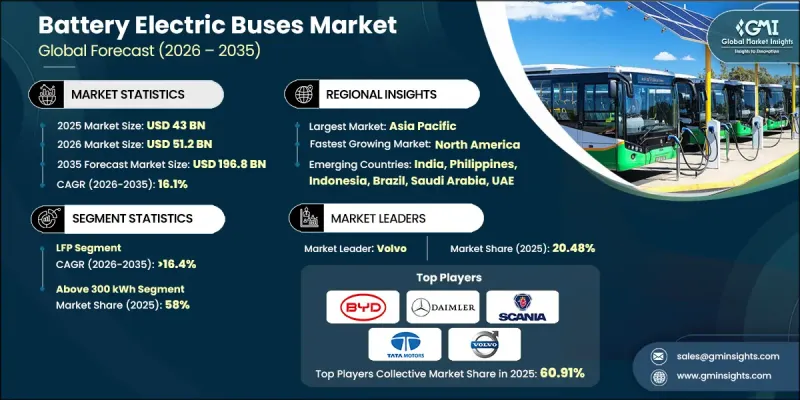
向零排放公共交通的轉型正在改變全球城際和市內公車的規劃、採購和運作方式。為因應都市區空氣污染、溫室氣體排放和噪音污染,純電動公車(BEB)正成為永續交通計劃的核心。與搭乘用電動車不同,純電動公車運行於高頻固定線路,因此可靠性、充電時間和總擁有成本對於車輛的長期部署至關重要。城市電氣化投資的增加、公私合營以及電池租賃和車隊即服務等創新資金籌措模式正在推動市場發展。隨著城市和交通管理部門優先考慮線路最佳化、節能充電基礎設施和全生命週期成本管理,純電動公車正成為現代永續交通網路的重要組成部分。
| 市場範圍 | |
|---|---|
| 開始年份 | 2025 |
| 預測年份 | 2026-2035 |
| 起始值 | 430億美元 |
| 預測金額 | 1968億美元 |
| 複合年成長率 | 16.1% |
純電動公車的研發並非簡單地對柴油公車進行改造,而是作為一體化的出行解決方案。高容量電池組、電力牽引馬達、再生煞車系統、先進的電力電子設備和能源管理軟體等關鍵系統被整合為一個整體,以最大限度地提高效率、續航里程和載客量。如今,原始設備製造商 (OEM) 和運輸業者更加關注營運因素,例如路線適用性、車輛段基礎設施和長期維護成本,而非初始成本。市政當局、能源供應商和充電基礎設施供應商之間的合作正在加速部署,同時降低計劃風險。批量合約、電池租賃模式和基於車輛段的充電網路使營運商能夠保持車隊的穩定運作和財務永續性。
預計到2025年,磷酸鋰鐵(LFP)電池市佔率將達到57%,並在2035年之前以16.4%的複合年成長率成長。由於其卓越的熱穩定性、安全性和長循環壽命,LFP電池正被廣泛應用於電動公車(BEB),成為高運轉率城市公車的理想選擇。在人口密集的都市區, LFP電池能夠承受頻繁的充放電循環,同時最大限度地降低過熱風險,這一點至關重要。此外,LFP電池還具有成本效益高、耐久性強等優點,這些因素進一步推動了車輛營運商將LFP技術作為永續公共運輸的標準解決方案。
到2025年,40-70座公車將佔據顯著的市場佔有率,成為都市區和郊區公共交通網路的標準配置。這種座位容量在乘客容量、出行便利性和線路柔軟性之間實現了最佳平衡。與現有道路、車輛段和充電基礎設施的兼容性使其能夠無縫融入現有交通系統,因此成為車輛營運商最廣泛採用的車型。高效運作高頻線路並在持續使用下保持良好運行性能的能力,進一步鞏固了其市場主導地位。
預計2026年至2035年,中國純電動公車市場將以強勁的複合年成長率成長。國家和地方政府正積極推行電氣化政策、大規模採購計畫以及補貼、稅收減免和零排放車輛專款等財政獎勵。都市區公車車隊的電氣化已基本實現,為技術推廣應用提供了穩定且標準化的環境。政府主導的項目正在支持基礎設施建設,包括車庫充電設施和能源管理系統,進一步加速了技術的普及。政策主導的推廣和國內強大的製造能力相結合,為該地區純電動公車(BEB)的發展創造了有利的環境。
目錄
第1章:調查方法
第2章執行摘要
第3章業界考察
- 生態系分析
- 供應商情況
- 利潤率分析
- 成本結構
- 每個階段增加的價值
- 影響價值鏈的因素
- 中斷
- 影響產業的因素
- 促進因素
- 增加政府補貼和公共交通電氣化計劃
- 都市區空氣污染加劇和嚴格的排放法規
- 提升電池效能並降低電池成本
- 燃油價格上漲和柴油公車的營運成本增加
- 產業潛在風險與挑戰
- 電池驅動電動巴士的初始成本很高
- 對電池劣化和更換成本的擔憂
- 市場機遇
- 高容量電池電動巴士的普及率不斷提高
- 私人車隊營運商的參與度迅速提高
- 增加電池回收和二次利用
- 擴大智慧互聯電動巴士解決方案的應用
- 促進因素
- 成長潛力分析
- 監管環境
- 北美洲
- 聯邦運輸管理局 (FTA) 低排放/零排放公車計劃
- 美國環保署清潔校車計劃
- 加州先進清潔車輛法規 (ACF)
- 歐洲
- 歐盟:清潔車輛指令(CVD)
- 德國:聯邦零排放公車資助計劃
- 英國:零排放公車區域(ZEBRA 和 ZEBRA 2)計劃
- 法國:《綠色成長能源轉型法》
- 亞太地區
- 中國:新能源公車(NEB)的推廣與採購政策
- 日本:公共交通脫碳綠色成長策略
- 韓國:公共運輸環保車輛藍圖
- 新加坡:綠色公共交通計畫(GPTP)
- 拉丁美洲
- 巴西:各市強制採購零排放公車。
- 墨西哥:清潔交通與公共運輸現代化政策
- 智利:國家電動車戰略
- 中東和非洲
- 阿拉伯聯合大公國:國家永續交通與智慧運輸政策
- 沙烏地阿拉伯:2030願景公共交通電氣化框架
- 南非:綠色交通戰略
- 北美洲
- 波特的分析
- PESTEL 分析
- 科技與創新趨勢
- 當前技術趨勢
- 新興技術
- 專利分析
- 永續性和環境影響分析
- 永續努力
- 減少廢棄物策略
- 生產中的能源效率
- 具有環保意識的舉措
- 碳足跡考量
- 成本細分分析
- 永續性和環境影響分析
- 永續努力
- 減少廢棄物策略
- 生產中的能源效率
- 具有環保意識的舉措
- 碳足跡考量
- 充電基礎設施和電網相容性評估
- 艦隊過渡和部署模型
- 未來前景與機遇
第4章 競爭情勢
- 介紹
- 企業市佔率分析
- 主要市場公司的競爭分析
- 競爭定位矩陣
- 主要進展
- 併購
- 夥伴關係與合作
- 新產品發布
- 業務拓展計劃及資金籌措
第5章 市場估價與預測:依電池化學品分類,2022-2035年
- LFP
- NCM/NMC
- NCA
- 其他
第6章 市場估價與預測:依電池容量分類,2022-2035年
- 小於100度
- 100~300 kWh
- 超過300度
第7章 市場估價與預測:依巴士長度分類,2022-2035年
- 小於9米
- 9-14米
- 超過14米
第8章 市場估算與預測:依座位容量分類,2022-2035年
- 不到40個座位
- 40-70個座位
- 超過70個座位
第9章 市場估計與預測:依應用領域分類,2022-2035年
- 線巴士和城市巴士
- 校車
- 教練
- 其他
第10章 市場估價與預測:依最終用途分類,2022-2035年
- 政府/公共部門
- 私人企業經營者
第11章 市場估價與預測:按地區分類,2022-2035年
- 北美洲
- 美國
- 加拿大
- 歐洲
- 德國
- 英國
- 法國
- 義大利
- 西班牙
- 俄羅斯
- 比利時
- 荷蘭
- 瑞典
- 亞太地區
- 中國
- 印度
- 日本
- 澳洲
- 韓國
- 菲律賓
- 印尼
- 新加坡
- 拉丁美洲
- 巴西
- 墨西哥
- 阿根廷
- 中東和非洲
- 南非
- 沙烏地阿拉伯
- 阿拉伯聯合大公國
第12章:公司簡介
- 世界玩家
- Alexander Dennis(ADL)
- BYD Company
- Daimler Truck(Mercedes-Benz Buses)
- Higer Bus Company
- King Long United Automotive Industry
- MAN Truck &Bus
- NFI(New Flyer)
- Scania
- VDL Bus &Coach
- Volvo
- Yutong
- Zhongtong Bus
- 本地製造商
- Ashok Leyland
- Blue Bird
- Ebusco
- Gillig
- Irizar e-mobility
- Lion Electric Company
- Solaris Bus &Coach
- Tata Motors
- Temsa
- 新興製造商
- Ankai Automobile
- Arrival
- CRRC Electric Vehicle
- Foton Motor
- GreenPower Motor Company.
- JBM Auto
- Phoenix Motor
- Switch Mobility
- Wrightbus
The Global Battery Electric Buses Market was valued at USD 43 billion in 2025 and is estimated to grow at a CAGR of 16.1% to reach USD 196.8 billion in 2035.
The shift toward zero-emission public transportation is transforming the planning, procurement, and operation of urban and intercity bus fleets worldwide. Battery electric buses (BEBs) are becoming central to sustainable mobility initiatives, tackling urban air pollution, greenhouse gas emissions, and noise pollution. Unlike passenger EVs, BEBs operate on high-frequency, fixed routes, making reliability, charging time, and total cost of ownership crucial for long-term fleet deployment. The market is benefiting from increasing investment in urban electrification, public-private partnerships, and innovative financing models such as battery leasing and fleet-as-a-service. Cities and transit authorities are prioritizing route optimization, energy-efficient charging infrastructure, and lifecycle cost management, making BEBs an essential component of modern, sustainable transportation networks.
| Market Scope | |
|---|---|
| Start Year | 2025 |
| Forecast Year | 2026-2035 |
| Start Value | $43 Billion |
| Forecast Value | $196.8 Billion |
| CAGR | 16.1% |
Battery electric buses are being developed as integrated mobility solutions rather than simple conversions of diesel buses. Key systems such as high-capacity battery packs, electric traction motors, regenerative braking, advanced power electronics, and energy management software are designed together to maximize efficiency, range, and passenger capacity. OEMs and transit operators now focus on operational factors like route compatibility, depot infrastructure, and long-term maintenance costs over upfront pricing. Collaborative approaches among city governments, energy utilities, and charging infrastructure providers are accelerating adoption while reducing project risks. Bundled contracts, battery leasing models, and depot-based charging networks are enabling operators to maintain consistent fleet performance and financial sustainability.
The LFP (Lithium Iron Phosphate) battery segment accounted for 57% share in 2025 and is projected to grow at a CAGR of 16.4% through 2035. LFP batteries are preferred in BEBs for their enhanced thermal stability, safety profile, and long cycle life, making them ideal for high-utilization urban buses. They can endure frequent charging and discharging cycles while minimizing risks of overheating, which is critical in densely populated urban areas. Their cost efficiency and durability further encourage fleet operators to adopt LFP technology as a standard solution for sustainable public transportation.
The buses with 40-70 seats segment held a sizeable share in 2025, representing the standard configuration for urban and suburban public transit networks. This seating range offers the optimal balance between passenger capacity, maneuverability, and route flexibility. Compatibility with existing roads, depots, and charging infrastructure facilitates seamless integration into current transit systems, making this category the most widely adopted among fleet operators. Their ability to serve high-frequency routes efficiently while maintaining operational performance under continuous use drives their market dominance.
China Battery Electric Buses Market will grow at a decent CAGR during 2026-2035. National and local governments are implementing aggressive electrification mandates, large-scale procurement initiatives, and financial incentives such as subsidies, tax benefits, and dedicated funding for zero-emission fleets. Urban centers have already achieved near-full electrification of bus fleets, ensuring a stable and standardized technology deployment environment. Government-led programs support infrastructure expansion, including depot charging and energy management systems, further strengthening adoption. The policy-driven push, combined with domestic manufacturing capabilities, is creating a favorable growth ecosystem for BEBs in the region.
Key players in the Global Battery Electric Buses Market include Volvo, BYD, MAN Bus, Scania, Daimler, Zhongtong Bus, Tata Motors, NFI, Proterra, and Solaris Bus & Coach. Companies in the Global Battery Electric Buses Market are strengthening their presence by investing in R&D to enhance battery efficiency, reduce charging times, and increase vehicle range. Strategic alliances with energy providers, city transit authorities, and technology partners allow manufacturers to offer integrated mobility solutions. Expansion into emerging markets, development of scalable depot-based charging infrastructure, and deployment of fleet-as-a-service and battery leasing models help operators manage capital costs while ensuring operational reliability. OEMs are also standardizing vehicle components, modularizing designs for different fleet sizes, and enhancing after-sales support to maintain performance and build long-term customer relationships, thereby solidifying market foothold and accelerating adoption worldwide.
Table of Contents
Chapter 1 Methodology
- 1.1 Research approach
- 1.2 Quality commitments
- 1.2.1 GMI AI policy & data integrity commitment
- 1.3 Research trail & confidence scoring
- 1.3.1 Research trail components
- 1.3.2 Scoring components
- 1.4 Data collection
- 1.4.1 Partial list of primary sources
- 1.5 Data mining sources
- 1.5.1 Paid sources
- 1.6 Base estimates and calculations
- 1.6.1 Base year calculation
- 1.7 Forecast model
- 1.8 Research transparency addendum
Chapter 2 Executive Summary
- 2.1 Industry 360° synopsis, 2022 - 2035
- 2.2 Key market trends
- 2.2.1 Regional
- 2.2.2 Battery Chemistry
- 2.2.3 Battery Capacity
- 2.2.4 Bus Length
- 2.2.5 Seating Capacity
- 2.2.6 Application
- 2.2.7 End Use
- 2.3 TAM Analysis, 2026-2035
- 2.4 CXO perspectives: Strategic imperatives
Chapter 3 Industry Insights
- 3.1 Industry ecosystem analysis
- 3.1.1 Supplier landscape
- 3.1.2 Profit margin analysis
- 3.1.3 Cost structure
- 3.1.4 Value addition at each stage
- 3.1.5 Factor affecting the value chain
- 3.1.6 Disruptions
- 3.2 Industry impact forces
- 3.2.1 Growth drivers
- 3.2.1.1 Rise in government subsidies and public transport electrification programs
- 3.2.1.2 Surge in urban air pollution and stringent emission regulations
- 3.2.1.3 Increase in battery performance and decline in battery costs
- 3.2.1.4 Rise in fuel prices and operating costs of diesel buses
- 3.2.2 Industry pitfalls and challenges
- 3.2.2.1 High upfront cost of battery electric buses
- 3.2.2.2 Battery degradation and replacement cost concerns
- 3.2.3 Market opportunities
- 3.2.3.1 Increase in adoption of high-capacity battery electric buses
- 3.2.3.2 Surge in participation of private fleet operators
- 3.2.3.3 Rise in battery recycling and second-life applications
- 3.2.3.4 Increase in deployment of smart and connected electric bus solutions
- 3.2.1 Growth drivers
- 3.3 Growth potential analysis
- 3.4 Regulatory landscape
- 3.4.1 North America
- 3.4.1.1 Federal Transit Administration (FTA) Low or No Emission Bus Program
- 3.4.1.2 EPA Clean School Bus Program
- 3.4.1.3 California Advanced Clean Fleets (ACF) Regulation.
- 3.4.2 Europe
- 3.4.2.1 European Union: Clean Vehicles Directive (CVD)
- 3.4.2.2 Germany: Federal Zero-Emission Bus Funding Program
- 3.4.2.3 United Kingdom: Zero-Emission Bus Regional Areas (ZEBRA & ZEBRA 2) Program
- 3.4.2.4 France: Energy Transition for Green Growth Law
- 3.4.3 Asia Pacific
- 3.4.3.1 China: New Energy Bus (NEB) Promotion & Procurement Policies
- 3.4.3.2 Japan: Green Growth Strategy for Decarbonized Public Transport
- 3.4.3.3 South Korea: Eco-Friendly Vehicle Roadmap for Public Transport
- 3.4.3.4 Singapore: Green Public Transport Programme (GPTP)
- 3.4.4 Latin America
- 3.4.4.1 Brazil: Municipal Zero-Emission Bus Procurement Mandates
- 3.4.4.2 Mexico: Clean Transport and Public Fleet Modernization Policies
- 3.4.4.3 Chile: National Electric Mobility Strategy
- 3.4.5 MEA
- 3.4.5.1 United Arab Emirates: National Sustainable Transport & Smart Mobility Policies
- 3.4.5.2 Saudi Arabia: Vision 2030 Public Transport Electrification Framework
- 3.4.5.3 South Africa:Green Transport Strategy
- 3.4.1 North America
- 3.5 Porter’s analysis
- 3.6 PESTEL analysis
- 3.7 Technology and Innovation landscape
- 3.7.1 Current technological trends
- 3.7.2 Emerging technologies
- 3.8 Patent analysis
- 3.9 Sustainability and environmental impact analysis
- 3.9.1 Sustainable practices
- 3.9.2 Waste reduction strategies
- 3.9.3 Energy efficiency in production
- 3.9.4 Eco-friendly initiatives
- 3.9.5 Carbon footprint considerations
- 3.10 Cost breakdown analysis
- 3.11 Sustainability and environmental impact analysis
- 3.11.1 Sustainable practices
- 3.11.2 Waste reduction strategies
- 3.11.3 Energy efficiency in production
- 3.11.4 Eco-friendly initiatives
- 3.11.5 Carbon footprint considerations
- 3.12 Charging Infrastructure & Grid Readiness Assessment
- 3.13 Fleet Transition & Deployment Models
- 3.14 Future outlook & opportunities
Chapter 4 Competitive Landscape, 2025
- 4.1 Introduction
- 4.2 Company market share analysis
- 4.2.1 North America
- 4.2.2 Europe
- 4.2.3 Asia Pacific
- 4.2.4 Latin America
- 4.2.5 MEA
- 4.3 Competitive analysis of major market players
- 4.4 Competitive positioning matrix
- 4.5 Key developments
- 4.5.1 Mergers & acquisitions
- 4.5.2 Partnerships & collaborations
- 4.5.3 New Product Launches
- 4.5.4 Expansion Plans and funding
Chapter 5 Market Estimates & Forecast, By Battery Chemistry, 2022 - 2035 ($Bn, Units)
- 5.1 Key trends
- 5.2 LFP
- 5.3 NCM/NMC
- 5.4 NCA
- 5.5 Others
Chapter 6 Market Estimates & Forecast, By Battery Capacity, 2022 - 2035 ($Bn, Units)
- 6.1 Key trends
- 6.2 Below 100 kWh
- 6.3 100-300 kWh
- 6.4 Above 300 kWh
Chapter 7 Market Estimates & Forecast, By Bus Length, 2022 - 2035 ($Bn, Units)
- 7.1 Key trends
- 7.2 Less than 9 meters
- 7.3 9-14 meters
- 7.4 More than 14 meters
Chapter 8 Market Estimates & Forecast, By Seating Capacity, 2022 - 2035 ($Bn, Units)
- 8.1 Key trends
- 8.2 Below 40 Seats
- 8.3 40-70 Seats
- 8.4 Above 70 Seats
Chapter 9 Market Estimates & Forecast, By Application, 2022 - 2035 ($Bn, Units)
- 9.1 Key trends
- 9.2 Transit & City Buses
- 9.3 School Buses
- 9.4 Coaches
- 9.5 Other
Chapter 10 Market Estimates & Forecast, By End Use, 2022 - 2035 ($Bn, Units)
- 10.1 Key trends
- 10.2 Government & Public Sector
- 10.3 Private Operators
Chapter 11 Market Estimates & Forecast, By Region, 2022 - 2035 ($Bn, Units)
- 11.1 Key trends
- 11.2 North America
- 11.2.1 US
- 11.2.2 Canada
- 11.3 Europe
- 11.3.1 Germany
- 11.3.2 UK
- 11.3.3 France
- 11.3.4 Italy
- 11.3.5 Spain
- 11.3.6 Russia
- 11.3.7 Belgium
- 11.3.8 Netherlands
- 11.3.9 Sweden
- 11.4 Asia Pacific
- 11.4.1 China
- 11.4.2 India
- 11.4.3 Japan
- 11.4.4 Australia
- 11.4.5 South Korea
- 11.4.6 Philippines
- 11.4.7 Indonesia
- 11.4.8 Singapore
- 11.5 Latin America
- 11.5.1 Brazil
- 11.5.2 Mexico
- 11.5.3 Argentina
- 11.6 MEA
- 11.6.1 South Africa
- 11.6.2 Saudi Arabia
- 11.6.3 UAE
Chapter 12 Company Profiles
- 12.1 Global Players
- 12.1.1 Alexander Dennis (ADL)
- 12.1.2 BYD Company
- 12.1.3 Daimler Truck (Mercedes-Benz Buses)
- 12.1.4 Higer Bus Company
- 12.1.5 King Long United Automotive Industry
- 12.1.6 MAN Truck & Bus
- 12.1.7 NFI (New Flyer)
- 12.1.8 Scania
- 12.1.9 VDL Bus & Coach
- 12.1.10 Volvo
- 12.1.11 Yutong
- 12.1.12 Zhongtong Bus
- 12.2 Regional Players
- 12.2.1 Ashok Leyland
- 12.2.2 Blue Bird
- 12.2.3 Ebusco
- 12.2.4 Gillig
- 12.2.5 Irizar e-mobility
- 12.2.6 Lion Electric Company
- 12.2.7 Solaris Bus & Coach
- 12.2.8 Tata Motors
- 12.2.9 Temsa
- 12.3 Emerging Players
- 12.3.1 Ankai Automobile
- 12.3.2 Arrival
- 12.3.3 CRRC Electric Vehicle
- 12.3.4 Foton Motor
- 12.3.5 GreenPower Motor Company.
- 12.3.6 JBM Auto
- 12.3.7 Phoenix Motor
- 12.3.8 Switch Mobility
- 12.3.9 Wrightbus
 2026年全球中大型(9-14公尺)電動客車市場報告2026年全球電動巴士市場報告2026年全球電動校車車輛管理市場報告
 學校和校園的電動出行解決方案市場預測(至2034年):按車輛類型、電池容量、驅動系統、乘客容量、應用和地區分類的全球分析電動接駁車和校園交通網路市場預測至2034年-全球分析(按組件、自動駕駛等級、推進方式、應用、最終用戶和地區分類)
 電動中重型客車市場:依動力類型、車身尺寸、充電方式、所有權類型、電池容量和應用分類-2026-2032年全球市場預測
 歐洲電動巴士:市場佔有率分析、產業趨勢與統計、成長預測(2026-2031)
 全球電動巴士市場規模、佔有率、趨勢和成長分析報告(2026-2034年)全球電池驅動電動巴士市場規模、佔有率、趨勢和成長分析報告(2026-2034)燃料電池電動巴士全球市場規模、佔有率、趨勢和成長分析報告(2026-2034)