

 |
市場調查報告書
商品編碼
1959328
晶片互連市場機會、成長要素、產業趨勢分析及2026年至2035年預測Chiplet Interconnect Market Opportunity, Growth Drivers, Industry Trend Analysis, and Forecast 2026 - 2035 |
||||||
2025 年全球晶片互連市場價值為 21.7 億美元,預計到 2035 年將達到 412 億美元,複合年成長率為 34.4%。
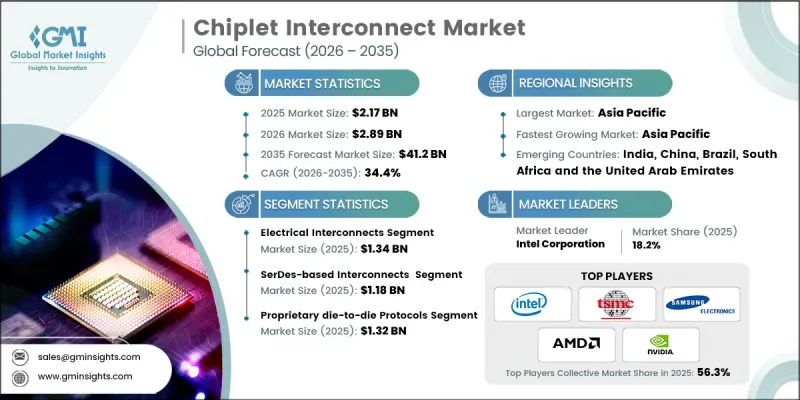
市場擴張的驅動力來自對異質整合日益成長的需求、先進製程節點成本最佳化以及擴展人工智慧和高效能運算 (HPC) 工作負載的需求。晶片組架構實現了模組化設計的柔軟性、提高了產量比率並降低了對單片式晶片的依賴,同時支援生態系統標準化和開放互連通訊協定。政府和產業項目正在推動先進封裝和模組化晶片策略,以加速創新、增加晶片多樣性並縮短複雜運算系統的上市時間。邊緣設備、資料中心和企業運算平台正受益於晶片組,晶片組克服了人工智慧、高效能運算和伺服器應用中單晶片的局限性,可提供高頻寬、低延遲和可擴展的效能。對設計工具、中介層技術和基板開發的策略性投資正在進一步加強產業對晶片組的應用。
| 市場範圍 | |
|---|---|
| 開始年份 | 2025 |
| 預測年份 | 2026-2035 |
| 起始值 | 21.7億美元 |
| 預測金額 | 412億美元 |
| 複合年成長率 | 34.4% |
預計到2025年,電氣互連市場規模將達到13.4億美元。由於其可靠性、易整合性和與現有封裝生態系統的兼容性,電氣互連在晶片設計中仍然佔據主導地位。它們尤其適用於人工智慧、高效能運算和伺服器處理器,其成熟的製造流程、廣泛的代工廠支援和完善的設計基礎設施使其能夠以經濟高效的方式擴展。製造商可以在資料中心、網路設備和企業運算系統中大規模部署電氣互連,從而支援大規模部署。
預計到2025年,基於SerDes的互連市場規模將達到11.8億美元,主要得益於其在多晶粒架構中實現的遠距離、高速資料傳輸能力。 SerDes與UCIe和PCIe等業界標準的高度相容性使其成為高階人工智慧、高效能運算和網路應用的理想選擇。 SerDes整合可降低設計風險,加速技術普及,並實現與企業半導體平台的無縫部署。
預計到2025年,北美晶片互連市場佔有率將達到42.7%。該地區受益於強大的半導體生態系統、先進的研發能力以及對尖端封裝技術的早期應用,這些技術能夠實現人工智慧和高效能運算系統所必需的低延遲、高頻寬互連。政府獎勵、研究夥伴關係以及對中介層和基板技術的投資,進一步鞏固了北美在異構整合、模組化晶片設計和穩健的半導體供應鏈方面的地位。
目錄
第1章:調查方法和範圍
第2章執行摘要
第3章業界考察
- 生態系分析
- 供應商情況
- 利潤率
- 成本結構
- 每個階段增加的價值
- 影響價值鏈的因素
- 中斷
- 影響產業的因素
- 促進因素
- 對異質一體化的需求
- 先進節點的成本最佳化
- 擴展人工智慧和高效能運算工作負載
- 產量比率和設計柔軟性
- 生態系標準化和開放互聯
- 挑戰與困難
- 缺乏普遍的互通性
- 熱管理和功率管理限制
- 促進因素
- 成長潛力分析
- 監理情勢
- 北美洲
- 歐洲
- 亞太地區
- 拉丁美洲
- 中東和非洲
- 波特的分析
- PESTEL 分析
- 科技與創新趨勢
- 當前技術趨勢
- 新興技術
- 新興經營模式
- 合規要求
- 供應鏈韌性
- 地緣政治分析
第4章 競爭情勢
- 介紹
- 企業市佔率分析
- 按地區
- 北美洲
- 歐洲
- 亞太地區
- 拉丁美洲
- 中東和非洲
- 市場集中度分析
- 按地區
- 主要企業的競爭標竿分析
- 產品系列比較
- 產品線的廣度
- 科技
- 創新
- 區域擴張比較
- 全球擴張分析
- 服務網路覆蓋
- 按地區分類的市場滲透率
- 競爭定位矩陣
- 領導企業
- 受讓人
- 追蹤者
- 小眾玩家
- 戰略展望矩陣
- 產品系列比較
- 2022-2025 年重大發展
- 併購
- 合作夥伴關係和合資企業
- 技術進步
- 擴張和投資策略
- 永續發展計劃
- 數位轉型計劃
- 新興/Start-Ups競爭對手的發展趨勢
第5章 市場估計與預測:依互連類型分類,2022-2035年
- 電氣互連
- 光連接模組
第6章 市場估算與預測:依訊號傳輸法分類,2022-2035年
- 基於SerDes的互連
- 基於平行互連
第7章 市場估計與預測:依通訊協定模型分類,2022-2035年
- 主要趨勢
- 開放標準通訊協定
- UCIe
- BoW(一束電線)
- OpenHBI
- 專有的晶粒間通訊協定
第8章 市場估算與預測:依互連IP層分類,2022-2035年
- 主要趨勢
- 物理層 (PHY) IP
- SerDes PHY IP
- 並行PHY IP
- 光物理層 (PHY) IP
- 控制器和通訊協定層 IP
- 通訊協定控制器 IP
- 連結和流量控制 IP
- 相干引擎 IP
- 通訊協定適配器和橋接 IP
第9章 市場估價與預測:依互連硬體分類,2022-2035年
- 主要趨勢
- 矽中介層
- 嵌入式矽膠橋
- 有機中介層和扇出RDL
第10章 市場估價與預測:依最終用途分類,2022-2035年
- 主要趨勢
- 高效能運算(HPC)
- 人工智慧/機器學習加速器
- 資料中心雲端基礎設施
- 用於網路和交換的專用積體電路
- 汽車電子
- 消費計算
- 工業和邊緣運算
- 其他
第11章 市場估價與預測:按地區分類,2022-2035年
- 北美洲
- 美國
- 加拿大
- 歐洲
- 德國
- 英國
- 法國
- 西班牙
- 義大利
- 荷蘭
- 亞太地區
- 中國
- 印度
- 日本
- 澳洲
- 韓國
- 拉丁美洲
- 巴西
- 墨西哥
- 阿根廷
- 中東和非洲
- 沙烏地阿拉伯
- 南非
- 阿拉伯聯合大公國
第12章:公司簡介
- 主要企業
- Advanced Micro Devices(AMD)
- Intel Corporation
- NVIDIA Corporation
- Broadcom Inc.
- Samsung Electronics
- 按地區分類的主要企業
- 北美洲
- Marvell Technology
- Cadence Design Systems
- Synopsys
- 歐洲
- Alphawave Semi
- Siemens EDA(Mentor Graphics)
- 亞太地區
- Taiwan Semiconductor Manufacturing Company(TSMC)
- Amkor Technology
- ASE Technology Holding
- 北美洲
- 小眾/顛覆性公司
- Ayar Labs
- Rambus Inc.
The Global Chiplet Interconnect Market was valued at USD 2.17 billion in 2025 and is estimated to grow at a CAGR of 34.4% to reach USD 41.2 billion by 2035.
The market is expanding due to the rising demand for heterogeneous integration, cost optimization at advanced process nodes, and the need to scale AI and high-performance computing (HPC) workloads. Chiplet architecture provides modular design flexibility, improved yield, and reduced reliance on monolithic chips while supporting ecosystem standardization and open interconnect protocols. Governments and industrial programs are promoting advanced packaging and modular chip strategies to accelerate innovation, increase silicon diversity, and reduce time-to-market for complex computing systems. Edge devices, data centers, and enterprise computing platforms benefit from chiplets that deliver high bandwidth, low latency, and scalable performance, addressing the limitations of standalone chips in AI, HPC, and server applications. Industry adoption is further strengthened by strategic investments in design tools, interposer technology, and substrate development.
| Market Scope | |
|---|---|
| Start Year | 2025 |
| Forecast Year | 2026-2035 |
| Start Value | $2.17 Billion |
| Forecast Value | $41.2 Billion |
| CAGR | 34.4% |
The electrical interconnects segment accounted for USD 1.34 billion in 2025. Electrical interconnects remain dominant in chiplet designs due to their reliability, ease of integration, and compatibility with existing packaging ecosystems. They are particularly suited for AI, HPC, and server processors, where mature manufacturing processes, widespread foundry support, and established design infrastructure make scaling cost-effective. Manufacturers can deploy electrical interconnects at scale in data centers, networking equipment, and enterprise computing systems, supporting high-volume adoption.
The SerDes-based interconnects segment reached USD 1.18 billion in 2025, driven by their capability to transmit high-speed data over long distances across multi-die architectures. These interconnects are ideal for advanced AI, HPC, and networking applications due to strong alignment with industry standards such as UCIe and PCIe. SerDes integration reduces design risks, accelerates adoption, and enables seamless deployment in enterprise semiconductor platforms.
North America Chiplet Interconnect Market held a 42.7% share in 2025. The region benefits from a robust semiconductor ecosystem, advanced R&D, and early access to cutting-edge packaging technologies that enable low-latency, high-bandwidth interconnects essential for AI and HPC systems. Government incentives, research partnerships, and investment in interposer and substrate technologies further strengthen North America's position in heterogeneous integration, modular chip design, and resilient semiconductor supply chains.
Leading companies in the Global Chiplet Interconnect Market include Intel Corporation, NVIDIA Corporation, Advanced Micro Devices (AMD), Taiwan Semiconductor Manufacturing Company (TSMC), Samsung Electronics, Broadcom Inc., Marvell Technology, Synopsys, Cadence Design Systems, Siemens EDA (Mentor Graphics), Alphawave Semi, Rambus Inc., Ayar Labs, ASE Technology Holding, and Amkor Technology. Key strategies adopted by companies to strengthen their position in the Global Chiplet Interconnect Market include investing heavily in R&D to develop high-bandwidth, low-latency interconnects optimized for AI, HPC, and enterprise applications. Firms are forming strategic alliances with semiconductor foundries, design tool providers, and cloud computing companies to ensure seamless ecosystem integration. Companies focus on adopting open standards such as UCIe to enhance modularity and reduce interoperability risks. They are expanding global manufacturing capabilities, including interposer and substrate production, to meet regional demand.
Table of Contents
Chapter 1 Methodology and Scope
- 1.1 Market scope and definition
- 1.2 Research design
- 1.2.1 Research approach
- 1.2.2 Data collection methods
- 1.3 Data mining sources
- 1.3.1 Global
- 1.3.2 Regional/Country
- 1.4 Base estimates and calculations
- 1.4.1 Base year calculation
- 1.4.2 Key trends for market estimation
- 1.5 Primary research and validation
- 1.5.1 Primary sources
- 1.6 Forecast model
- 1.7 Research assumptions and limitations
Chapter 2 Executive Summary
- 2.1 Industry 360° synopsis
- 2.2 Key market trends
- 2.2.1 Interconnect type trends
- 2.2.2 Signalling architecture trends
- 2.2.3 Protocol model trends
- 2.2.4 Interconnect IP layer trends
- 2.2.5 Interconnect-enabling hardware
- 2.2.6 End-use trends
- 2.2.7 Regional trends
- 2.3 TAM Analysis, 2026-2035 (USD Million)
- 2.4 CXO perspectives: Strategic imperatives
- 2.4.1 Executive decision points
- 2.4.2 Critical success factors
- 2.5 Future outlook and strategic recommendations
Chapter 3 Industry Insights
- 3.1 Industry ecosystem analysis
- 3.1.1 Supplier landscape
- 3.1.2 Profit margin
- 3.1.3 Cost structure
- 3.1.4 Value addition at each stage
- 3.1.5 Factor affecting the value chain
- 3.1.6 Disruptions
- 3.2 Industry impact forces
- 3.2.1 Growth drivers
- 3.2.1.1 Heterogeneous integration demand
- 3.2.1.2 Advanced node cost optimization
- 3.2.1.3 Ai and hpc workload scaling
- 3.2.1.4 Yield improvement and design flexibility
- 3.2.1.5 Ecosystem standardization and open interconnects
- 3.2.2 Pitfalls and challenges
- 3.2.2.1 Lack of universal interoperability
- 3.2.2.2 Thermal and power management constraints
- 3.2.1 Growth drivers
- 3.3 Growth potential analysis
- 3.4 Regulatory landscape
- 3.4.1 North America
- 3.4.2 Europe
- 3.4.3 Asia Pacific
- 3.4.4 Latin America
- 3.4.5 Middle East & Africa
- 3.5 Porter’s analysis
- 3.6 PESTEL analysis
- 3.7 Technology and Innovation landscape
- 3.7.1 Current technological trends
- 3.7.2 Emerging technologies
- 3.8 Emerging Business Models
- 3.9 Compliance Requirements
- 3.10 Supply Chain Resilience
- 3.11 Geopolitical Analysis
Chapter 4 Competitive Landscape, 2025
- 4.1 Introduction
- 4.2 Company market share analysis
- 4.2.1 By region
- 4.2.1.1 North America
- 4.2.1.2 Europe
- 4.2.1.3 Asia Pacific
- 4.2.1.4 Latin America
- 4.2.1.5 Middle East & Africa
- 4.2.2 Market concentration analysis
- 4.2.1 By region
- 4.3 Competitive benchmarking of key players
- 4.3.1 Product portfolio comparison
- 4.3.1.1 Product range breadth
- 4.3.1.2 Technology
- 4.3.1.3 Innovation
- 4.3.2 Geographic presence comparison
- 4.3.2.1 Global footprint analysis
- 4.3.2.2 Service network coverage
- 4.3.2.3 Market penetration by region
- 4.3.3 Competitive positioning matrix
- 4.3.3.1 Leaders
- 4.3.3.2 Challengers
- 4.3.3.3 Followers
- 4.3.3.4 Niche players
- 4.3.4 Strategic outlook matrix
- 4.3.1 Product portfolio comparison
- 4.4 Key developments, 2022-2025
- 4.4.1 Mergers and acquisitions
- 4.4.2 Partnerships and collaborations
- 4.4.3 Technological advancements
- 4.4.4 Expansion and investment strategies
- 4.4.5 Sustainability initiatives
- 4.4.6 Digital transformation initiatives
- 4.5 Emerging/ startup competitors landscape
Chapter 5 Market Estimates and Forecast, By Interconnect Type, 2022 - 2035 (USD Million)
- 5.1 Key trends
- 5.2 Electrical interconnects
- 5.3 Optical interconnects
Chapter 6 Market Estimates and Forecast, By Signaling Architecture, 2022 - 2035 (USD Million)
- 6.1 Key trends
- 6.2 SerDes-based interconnects
- 6.3 Parallel-based interconnects
Chapter 7 Market Estimates and Forecast, By Protocol Model, 2022 - 2035 (USD Million)
- 7.1 Key Trends
- 7.2 Open standard protocols
- 7.2.1 UCIe
- 7.2.2 BoW (Bunch of Wires)
- 7.2.3 OpenHBI
- 7.3 Proprietary die-to-die protocols
Chapter 8 Market Estimates and Forecast, By Interconnect IP Layer, 2022 - 2035 (USD Million)
- 8.1 Key Trends
- 8.2 Physical Layer (PHY) IP
- 8.2.1 SerDes PHY IP
- 8.2.2 Parallel PHY IP
- 8.2.3 Optical PHY IP
- 8.3 Controller & Protocol Layer IP
- 8.3.1 Protocol controller IP
- 8.3.2 Link & flow control IP
- 8.3.3 Coherency engine IP
- 8.3.4 Protocol adapter & bridging IP
Chapter 9 Market Estimates and Forecast, By Interconnect-Enabling Hardware, 2022 - 2035 (USD Million)
- 9.1 Key Trends
- 9.2 Silicon interposers
- 9.3 Embedded silicon bridges
- 9.4 Organic interposers & Fan-Out RDL
Chapter 10 Market Estimates and Forecast, By End-use, 2022 - 2035 (USD Million)
- 10.1 Key Trends
- 10.2 High-performance computing (HPC)
- 10.3 Artificial intelligence / machine learning accelerators
- 10.4 Data center & cloud infrastructure
- 10.5 Networking & switching ASICs
- 10.6 Automotive electronics
- 10.7 Consumer computing
- 10.8 Industrial & edge computing
- 10.9 Others
Chapter 11 Market Estimates and Forecast, By Region, 2022 - 2035 (USD Million)
- 11.1 Key trends
- 11.2 North America
- 11.2.1 U.S.
- 11.2.2 Canada
- 11.3 Europe
- 11.3.1 Germany
- 11.3.2 UK
- 11.3.3 France
- 11.3.4 Spain
- 11.3.5 Italy
- 11.3.6 Netherlands
- 11.4 Asia Pacific
- 11.4.1 China
- 11.4.2 India
- 11.4.3 Japan
- 11.4.4 Australia
- 11.4.5 South Korea
- 11.5 Latin America
- 11.5.1 Brazil
- 11.5.2 Mexico
- 11.5.3 Argentina
- 11.6 Middle East and Africa
- 11.6.1 Saudi Arabia
- 11.6.2 South Africa
- 11.6.3 UAE
Chapter 12 Company Profiles
- 12.1 Global Key Players
- 12.1.1 Advanced Micro Devices (AMD)
- 12.1.2 Intel Corporation
- 12.1.3 NVIDIA Corporation
- 12.1.4 Broadcom Inc.
- 12.1.5 Samsung Electronics
- 12.2 Regional Key Players
- 12.2.1 North America
- 12.2.1.1 Marvell Technology
- 12.2.1.2 Cadence Design Systems
- 12.2.1.3 Synopsys
- 12.2.2 Europe
- 12.2.2.1 Alphawave Semi
- 12.2.2.2 Siemens EDA (Mentor Graphics)
- 12.2.3 Asia Pacific
- 12.2.3.1 Taiwan Semiconductor Manufacturing Company (TSMC)
- 12.2.3.2 Amkor Technology
- 12.2.3.3 ASE Technology Holding
- 12.2.1 North America
- 12.3 Niche / Disruptors
- 12.3.1 Ayar Labs
- 12.3.2 Rambus Inc.
 晶片整合解決方案市場分析及預測(至2035年):依類型、產品類型、服務、技術、組件、應用、材料類型、製程、最終用戶、解決方案分類
 晶片組:市場佔有率分析、行業趨勢和統計數據、成長預測(2026-2031)
 Chiplet平台市場預測至2034年—按處理器類型、封裝技術、最終用戶和地區分類的全球分析晶片整合市場分析及至2035年預測:按類型、產品、服務、技術、應用和最終用戶分類晶片互連標準市場預測至2034年—按標準類型、互連技術、應用、最終用戶和地區分類的全球分析
 2026-2034年全球奈米晶片市場規模、佔有率、趨勢和成長分析報告
 Chiplet市場:2026年至2032年全球市場預測(依Chiplet類型、處理器類型、封裝技術、設計架構、構裝基板、應用、產業及最終用戶分類)
 晶片市場:按處理器類型、封裝技術和地區分類Chiplets市場分析及預測至2035年:按類型、產品類型、技術、應用、材料類型、最終用戶、組件、功能、安裝類型、解決方案分類全球晶片技術市場:預測(至 2034 年)—按組件、互連類型、封裝技術、應用、最終用戶和地區進行分析