

 |
市場調查報告書
商品編碼
1959281
物聯網賦能的工業壓力感測器市場:機會、成長要素、產業趨勢分析、預測(2026-2035年)Industrial Pressure Sensor with IoT Market Opportunity, Growth Drivers, Industry Trend Analysis, and Forecast 2026 - 2035 |
||||||
2025 年全球物聯網工業壓力感測器市場價值 63 億美元,預計到 2035 年將達到 114 億美元,年複合成長率為 6.3%。
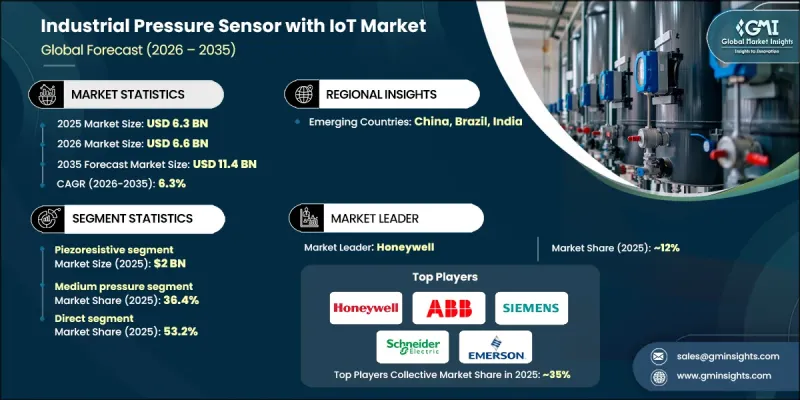
這一成長得益於壓力感測技術與自動化生產環境的融合,不間斷的資料收集和分析為持續生產提供了保障。智慧壓力感測器能夠實現即時監控和數據驅動的決策,且不會中斷生產流程。它們支援預測性維護,顯著降低了設備意外故障的風險,並幫助製造商最佳化生產計畫和庫存管理。這些感測器旨在作為數位互聯工廠的原生組件運行,加速向全自動化智慧生產系統的轉型。更高的測量精度和一致性使製造商能夠更嚴格地控制流程,提高產品質量,最大限度地減少材料損耗,並實現更高的效率。隨著工業4.0的深入應用,物聯網賦能的壓力感測器正成為營運韌性和長期生產力提升的關鍵工具。
| 市場範圍 | |
|---|---|
| 開始年份 | 2025 |
| 預測年份 | 2026-2035 |
| 起始金額 | 63億美元 |
| 預測金額 | 114億美元 |
| 複合年成長率 | 6.3% |
預計到2025年,壓阻式感測器市場規模將達到20億美元,並在2026年至2035年間以5.8%的複合年成長率成長。該技術憑藉其高靈敏度、穩定的性能以及即使在嚴苛的工作條件下也能保持一致的測量精度,在市場上佔據領先地位。壓阻式感測器廣泛應用於需要可靠壓力監測和長期可靠性的領域,而物聯網在工業環境中的日益普及也推動了其持續成長。
預計到2025年,中壓感測器市場佔有率將達到36.4%,並在2035年之前以6.8%的複合年成長率成長。此範圍的感測器能夠有效平衡性能、精度和系統耐久性,從而滿足各種運作需求。其經濟高效且功能可靠,使其成為需要穩定壓力控制且系統複雜度不高的應用的首選。
美國物聯網賦能的工業壓力感測器市場預計到2025年將達到11億美元,並在2026年至2035年間以5.9%的複合年成長率成長。對智慧製造的大力投資和先進數位技術的早期應用正在鞏固其市場領先地位。成熟的工業基礎和嚴格的營運標準持續推動對兼具精度、安全性和高效性的互聯壓力感測解決方案的需求。
目錄
第1章:調查方法和範圍
第2章執行摘要
第3章業界考察
- 生態系分析
- 供應商情況
- 利潤率
- 每個階段增加的價值
- 影響價值鏈的因素
- 影響產業的因素
- 促進因素
- 工業4.0實施現狀
- 能源效率和安全法規
- 與雲端和人工智慧分析的整合
- 挑戰與困難
- 初始成本高且整合複雜
- 網路安全風險
- 機會
- 新興智慧基礎設施計劃
- 無線和低功耗技術的進步
- 促進因素
- 成長潛力分析
- 未來市場趨勢
- 科技與創新趨勢
- 當前技術趨勢
- 新興技術
- 價格趨勢
- 按地區
- 依產品
- 監理情勢
- 北美洲
- 美國:消費品安全委員會(CPSC)聯邦法規(CFR)第16篇第1512部分
- 加拿大:國際標準化組織(ISO)4210
- 歐洲
- 德國:德國標準化協會 (DIN)、歐洲標準 (EN)、ISO 4210
- 英國:歐洲標準 (EN) ISO 4210 /英國合格評定 (UKCA)
- 法國:歐洲標準 (EN) ISO 4210
- 亞太地區
- 中國:國家標準(GB)3565
- 印度:印度標準 (IS) 10613
- 日本:日本工業標準(JIS)D 9110
- 拉丁美洲
- 巴西:巴西技術標準協會 (ABNT)、巴西標準局 (NBR)、ISO 4210
- 墨西哥:國際標準化組織(ISO)4210
- 中東和非洲
- 南非:南非國家標準 (SANS) 311
- 沙烏地阿拉伯:沙烏地阿拉伯標準、計量和品質組織 (SASO)、海灣標準化組織 (GSO)、ISO 4210
- 北美洲
- 貿易統計(HS編碼 - 9026.20)
- 主要進口國
- 主要出口國
- 波特的分析
- PESTEL 分析
第4章 競爭情勢
- 介紹
- 企業市佔率分析
- 按地區
- 北美洲
- 歐洲
- 亞太地區
- 拉丁美洲
- 中東和非洲
- 按地區
- 公司矩陣分析
- 主要市場公司的競爭分析
- 競爭定位矩陣
- 主要進展
- 併購
- 夥伴關係與合作
- 新產品發布
- 擴張計劃
第5章 市場估算與預測:依感測器類型分類,2022-2035年
- 壓阻式
- 電容式
- 共振類型
- 光學的
- 電磁
- 壓電
第6章 市場估計與預測:依壓力範圍分類,2022-2035年
- 低壓(低於 1,000 psi)
- 中等壓力(1,000–10,000 psi)
- 高壓(超過 10,000 psi)
第7章 市場估計與預測:依應用領域分類,2022-2035年
- 製程監控與控制
- 預測性保護
- 洩漏檢測
- 液位測量
- 流量測量
- 暖通空調系統
- 液壓/氣壓系統
- 環境監測
第8章 市場估算與預測:依最終用戶產業分類,2022-2035年
- 商業農場
- 石油和天然氣
- 製造業
- 車
- 製藥
- 食品/飲料
- 供水/污水處理
- 發電
- 化學品
- 航太和國防工業
第9章 市場估價與預測:依通路分類,2022-2035年
- 直銷
- 間接銷售
第10章 市場估價與預測:依地區分類,2022-2035年
- 北美洲
- 美國
- 加拿大
- 歐洲
- 德國
- 英國
- 法國
- 義大利
- 西班牙
- 亞太地區
- 中國
- 印度
- 日本
- 韓國
- 澳洲
- 拉丁美洲
- 巴西
- 墨西哥
- 阿根廷
- 中東和非洲
- 沙烏地阿拉伯
- 阿拉伯聯合大公國
- 南非
第11章:公司簡介
- ABB Ltd.
- AMETEK Inc.
- Baumer Group
- Bosch Sensortec
- Emerson Electric
- Endress+Hauser Group
- Honeywell International Inc.
- Murata Manufacturing Co., Ltd.
- Omron Corporation
- Rockwell Automation
- Schneider Electric
- Siemens AG
- TDK Corporation
- TE Connectivity
- Yokogawa Electric Corp.
The Global Industrial Pressure Sensor with IoT Market was valued at USD 6.3 billion in 2025 and is estimated to grow at a CAGR of 6.3% to reach USD 11.4 billion by 2035.
Growth is driven by the integration of connected pressure-sensing technologies into automated production environments, where uninterrupted data collection and analysis support continuous operations. Smart pressure sensors enable real-time monitoring and data-driven decision-making without disrupting manufacturing workflows. Their ability to support predictive maintenance significantly lowers the risk of unexpected equipment failure, allowing manufacturers to optimize production planning and inventory management. These sensors are designed to operate as native components within digitally connected factories, accelerating the transition toward fully automated and intelligent production systems. Enhanced measurement accuracy and consistency allow manufacturers to maintain tighter process control, improve output quality, minimize material loss, and achieve higher levels of efficiency. As Industry 4.0 adoption deepens, IoT-enabled pressure sensors are becoming essential tools for achieving operational resilience and long-term productivity gains.
| Market Scope | |
|---|---|
| Start Year | 2025 |
| Forecast Year | 2026-2035 |
| Start Value | $6.3 Billion |
| Forecast Value | $11.4 Billion |
| CAGR | 6.3% |
The piezoresistive segment generated USD 2 billion in 2025 and is expected to grow at a CAGR of 5.8% from 2026 to 2035. This technology leads the market due to its strong sensitivity, stable performance, and consistent measurement accuracy in demanding operating conditions. Piezoresistive sensors are widely selected for applications that require dependable pressure monitoring and long-term reliability, supporting their continued adoption as IoT integration expands across industrial environments.
The medium pressure segment accounted for 36.4% share in 2025 and is forecast to grow at a CAGR of 6.8% through 2035. Sensors in this range address a broad spectrum of operational requirements by offering an effective balance between performance, precision, and system durability. Their cost efficiency and reliable functionality make them a preferred option for applications that demand consistent pressure control without excessive system complexity.
U.S. Industrial Pressure Sensor with IoT Market generated USD 1.1 billion in 2025 and is projected to grow at a CAGR of 5.9% from 2026 to 2035. Market leadership is supported by strong investment in smart manufacturing and early adoption of advanced digital technologies. A well-established industrial base and rigorous operational standards continue to drive demand for connected pressure sensing solutions that deliver accuracy, safety, and efficiency.
Key companies operating in the Global Industrial Pressure Sensor with IoT Market include Siemens AG, Honeywell International Inc., Schneider Electric, ABB Ltd., Yokogawa Electric Corp., Emerson Electric, TE Connectivity, Rockwell Automation, AMETEK Inc., Omron Corporation, Endress+Hauser Group, TDK Corporation, Murata Manufacturing Co., Ltd., Baumer Group, and Bosch Sensortec. Companies in the industrial pressure sensor with IoT market focus on innovation, system integration, and global expansion to strengthen their market position. Many invest in advanced sensor design to enhance accuracy, durability, and data reliability. Integration with digital platforms and analytics tools is prioritized to support predictive maintenance and real-time monitoring. Strategic partnerships help expand solution ecosystems and improve interoperability. Manufacturers also emphasize compliance with industrial standards and cybersecurity requirements to build customer confidence.
Table of Contents
Chapter 1 Methodology & Scope
- 1.1 Market scope & definitions
- 1.2 Research design
- 1.2.1 Research approach
- 1.2.2 Data collection methods
- 1.3 Base estimates and calculations
- 1.3.1 Base year calculation
- 1.3.2 Market estimates & forecasts parameters
- 1.4 Forecast Model
- 1.4.1 Key trends for market estimates
- 1.4.2 Quantified market impact analysis
- 1.4.2.1 Mathematical impact of growth parameters on forecast
- 1.4.3 Scenario analysis framework
- 1.5 Primary research and validation
- 1.5.1 Some of the primary sources (but not limited to)
- 1.6 Data mining sources
- 1.6.1 Paid Sources
- 1.7 Research Trail & confidence scoring
- 1.7.1 Research trail components
- 1.7.2 Scoring components
- 1.8 Research transparency addendum
- 1.8.1 Source attribution framework
- 1.8.2 Quality assurance metrics
- 1.8.3 Our commitment to trust
- 1.9 Market Definitions
Chapter 2 Executive Summary
- 2.1 Industry 360° synopsis
- 2.2 Key market trends
- 2.2.1 Regional
- 2.2.2 Sensor type
- 2.2.3 Pressure range
- 2.2.4 Application
- 2.2.5 End user industry
- 2.2.6 Distribution channel
- 2.3 CXO perspectives: Strategic imperatives
- 2.3.1 Key decision points for industry executives
- 2.3.2 Critical success factors for market players
- 2.4 Future outlook and strategic recommendations
Chapter 3 Industry Insights
- 3.1 Industry ecosystem analysis
- 3.1.1 Supplier landscape
- 3.1.2 Profit margin
- 3.1.3 Value addition at each stage
- 3.1.4 Factor affecting the value chain
- 3.2 Industry impact forces
- 3.2.1 Growth drivers
- 3.2.1.1 Industry 4.0 adoption
- 3.2.1.2 Energy efficiency & safety regulations
- 3.2.1.3 Integration with cloud & ai analytics
- 3.2.2 Pitfalls & Challenges
- 3.2.2.1 High initial cost & integration complexity
- 3.2.2.2 Cybersecurity risks
- 3.2.3 Opportunities
- 3.2.3.1 Emerging smart infrastructure projects
- 3.2.3.2 Advancements in wireless & low-power technologies
- 3.2.1 Growth drivers
- 3.3 Growth potential analysis
- 3.4 Future market trends
- 3.5 Technology and innovation landscape
- 3.5.1 Current technological trends
- 3.5.2 Emerging technologies
- 3.6 Price trends
- 3.6.1 By region
- 3.6.2 By product
- 3.7 Regulatory landscape
- 3.7.1 North America
- 3.7.1.1 US: Consumer Product Safety Commission (CPSC) 16 Code of Federal Regulations (CFR) part 1512
- 3.7.1.2 Canada: International Organization for Standardization (ISO) 4210
- 3.7.2 Europe
- 3.7.2.1 Germany: Deutsches Institut fur Normung (DIN) European Norm (EN) ISO 4210
- 3.7.2.2 UK: European Norm (EN) ISO 4210 / United Kingdom Conformity Assessed (UKCA)
- 3.7.2.3 France: European Norm (EN) ISO 4210
- 3.7.3 Asia Pacific
- 3.7.3.1 China: Guobiao (GB) 3565
- 3.7.3.2 India: Indian Standard (IS) 10613
- 3.7.3.3 Japan: Japanese Industrial Standard (JIS) D 9110
- 3.7.4 Latin America
- 3.7.4.1 Brazil: Associacao Brasileira de Normas Tecnicas (ABNT) Norma Brasileira (NBR) ISO 4210
- 3.7.4.2 Mexico: International Organization for Standardization (ISO) 4210
- 3.7.5 Middle East & Africa
- 3.7.5.1 South Africa: South African National Standard (SANS) 311
- 3.7.5.2 Saudi Arabia: Saudi Standards, Metrology and Quality Organization (SASO) Gulf Standardization Organization (GSO) ISO 4210
- 3.7.1 North America
- 3.8 Trade statistics (HS code- 9026.20)
- 3.8.1 Major importing countries
- 3.8.2 Major exporting countries
- 3.9 Porter’s analysis
- 3.10 PESTEL analysis
Chapter 4 Competitive Landscape, 2025
- 4.1 Introduction
- 4.2 Company market share analysis
- 4.2.1 By Region
- 4.2.1.1 North America
- 4.2.1.2 Europe
- 4.2.1.3 Asia Pacific
- 4.2.1.4 Latin America
- 4.2.1.5 Middle East & Africa
- 4.2.1 By Region
- 4.3 Company matrix analysis
- 4.4 Competitive analysis of major market players
- 4.5 Competitive positioning matrix
- 4.6 Key developments
- 4.6.1 Mergers & acquisitions
- 4.6.2 Partnerships & collaborations
- 4.6.3 New product launches
- 4.6.4 Expansion plans
Chapter 5 Market Estimates & Forecast, By Sensor Type, 2022 - 2035, (USD Billion) (Thousand Units)
- 5.1 Key trends
- 5.2 Piezoresistive
- 5.3 Capacitive
- 5.4 Resonant
- 5.5 Optical
- 5.6 Electromagnetic
- 5.7 Piezoelectric
Chapter 6 Market Estimates & Forecast, By Pressure Range, 2022 - 2035, (USD Billion) (Thousand units)
- 6.1 Key trends
- 6.2 Low Pressure (less than 1,000 psi)
- 6.3 Medium Pressure (1,000-10,000 psi)
- 6.4 High Pressure (more than 10,000 psi)
Chapter 7 Market Estimates & Forecast, By Application, 2022 - 2035, (USD Billion) (Thousand units)
- 7.1 Key trends
- 7.2 Process monitoring & control
- 7.3 Predictive maintenance
- 7.4 Leak detection
- 7.5 Level measurement
- 7.6 Flow measurement
- 7.7 Hvac systems
- 7.8 Hydraulic/pneumatic systems
- 7.9 Environmental monitoring
Chapter 8 Market Estimates & Forecast, By End User Industry, 2022 - 2035, (USD Billion) (Thousand units)
- 8.1 Key trends
- 8.2 Commercial farms
- 8.3 Oil & gas
- 8.4 Manufacturing
- 8.5 Automotive
- 8.6 Pharmaceuticals
- 8.7 Food and beverages
- 8.8 Water & wastewater
- 8.9 Power generation
- 8.10 Chemicals
- 8.11 Aerospace & defense
Chapter 9 Market Estimates & Forecast, By Distribution Channel, 2022 - 2035, (USD Billion) (Thousand Units)
- 9.1 Key trends
- 9.2 Direct
- 9.3 Indirect
Chapter 10 Market Estimates & Forecast, By Region, 2022 - 2035, (USD Billion) (Thousand Units)
- 10.1 Key trends
- 10.2 North America
- 10.2.1 U.S.
- 10.2.2 Canada
- 10.3 Europe
- 10.3.1 Germany
- 10.3.2 UK
- 10.3.3 France
- 10.3.4 Italy
- 10.3.5 Spain
- 10.4 Asia Pacific
- 10.4.1 China
- 10.4.2 India
- 10.4.3 Japan
- 10.4.4 South Korea
- 10.4.5 Australia
- 10.5 Latin America
- 10.5.1 Brazil
- 10.5.2 Mexico
- 10.5.3 Argentina
- 10.6 MEA
- 10.6.1 Saudi Arabia
- 10.6.2 UAE
- 10.6.3 South Africa
Chapter 11 Company Profiles
- 11.1 ABB Ltd.
- 11.2 AMETEK Inc.
- 11.3 Baumer Group
- 11.4 Bosch Sensortec
- 11.5 Emerson Electric
- 11.6 Endress+Hauser Group
- 11.7 Honeywell International Inc.
- 11.8 Murata Manufacturing Co., Ltd.
- 11.9 Omron Corporation
- 11.10 Rockwell Automation
- 11.11 Schneider Electric
- 11.12 Siemens AG
- 11.13 TDK Corporation
- 11.14 TE Connectivity
- 11.15 Yokogawa Electric Corp.
 2026-2030年全球物聯網(IoT)安全市場
 物聯網安全市場規模、佔有率、趨勢和預測:按組件、安全類型、行業和地區分類,2026-2034 年
 物聯網市場追蹤調查:家庭安全與自動化
 2026年全球安防自動化市場報告
 物聯網安全市場:按組件、安全類型、部署模式、組織規模和產業分類-2026-2032年全球市場預測2026年物聯網安全全球市場報告工業鍵盤(帶軌跡球)市場:按連接類型、工業垂直應用、安裝類型、材料、防護等級、配銷通路和最終用戶分類,全球預測,2026-2032年
 面向物聯網設備的先進網路安全市場分析及預測(至 2035 年):按類型、產品類型、服務、技術、組件、應用、部署類型、最終用戶和解決方案分類2026年全球物聯網智慧壓力感測器市場報告
 物聯網安全市場 - 全球產業規模、佔有率、趨勢、機會及預測(按組件、部署、公司、安全類型、應用、區域和競爭格局分類),2021-2031年