


 |
市場調查報告書
商品編碼
1959270
2026-2035年減糖膳食纖維成分的市場機會、成長要素、產業趨勢分析及預測Fiber Ingredients for Sugar Reduction Market Opportunity, Growth Drivers, Industry Trend Analysis, and Forecast 2026 - 2035 |
||||||
2025 年全球用於減糖的膳食纖維成分市場價值為 53 億美元,預計到 2035 年將達到 121 億美元,年複合成長率為 8.7%。
全球健康意識的增強以及人們對過量攝取糖分負面影響的日益關注,推動了市場成長。消費者越來越傾向於選擇既能提供甜味和口感,又不犧牲營養價值的產品。富含膳食纖維的成分因其能夠改善口感、平衡甜味感知、提升整體感官品質,同時提供極低的熱量和血糖生成指數,而被廣泛接受為一種有效的減糖方案。這些成分還有助於開發機能性食品,以滿足維持消化健康、代謝平衡和體重管理等目標。對於食品飲料生產商而言,無需使用人工甜味劑即可實現潔淨標示配方的能力尤其具有吸引力。儘管監管部門日益加強要求減少加工食品中的糖分,進一步刺激了市場需求,但持續的配方創新正在拓展其在各類產品類型中的應用潛力。
| 市場範圍 | |
|---|---|
| 開始年份 | 2025 |
| 預測年份 | 2026-2035 |
| 起始金額 | 53億美元 |
| 預測金額 | 121億美元 |
| 複合年成長率 | 8.7% |
預計到2025年,水溶性膳食纖維市佔率將達到77.1%,並在2035年之前以8.7%的複合年成長率成長。消費者對健康營養和預防醫學日益成長的興趣是推動該細分市場需求的主要因素。水溶性膳食纖維廣泛應用於機能性食品、飲料和營養配方中,因為它有助於控制膽固醇、調節血糖值和維持消化器官系統平衡。其功能多樣性和對不同配方的適應性持續推動著整個行業的高普及率。
預計到2025年,植物來源纖維市佔率將達到76.2%,並在2026年至2035年間以8.8%的複合年成長率成長。源自穀物、豆類、水果和根莖類的纖維因其廣泛的來源和功能性而保持市場主導地位。消費者對兼具營養和感官益處的纖維需求日益成長,尤其是那些具有益生元特性和天然甜味的纖維。豐富的植物來源原料使生產商能夠滿足各種配方需求,同時也能滿足消費者對天然且易於識別的成分的期望。
預計到2025年,北美減糖膳食纖維配料市場佔有率將達到36%。消費者營養意識的提高,以及功能性食品飲料產業的蓬勃發展,正在推動該地區市場的擴張。先進的加工能力和持續的產品創新進一步促進了美國和加拿大市場的繁榮發展。
目錄
第1章:調查方法和範圍
第2章執行摘要
第3章業界考察
- 生態系分析
- 供應商情況
- 利潤率
- 每個階段增加的價值
- 影響價值鏈的因素
- 中斷
- 影響產業的因素
- 促進因素
- 產業潛在風險與挑戰
- 市場機遇
- 成長潛力分析
- 監理情勢
- 波特五力分析
- PESTEL 分析
- 價格趨勢
- 按地區
- 按類型
- 未來市場趨勢
- 科技與創新趨勢
- 當前技術趨勢
- 新興技術
- 專利狀態
- 貿易統計(HS編碼)
- 主要進口國
- 主要出口國
- 永續性和環境方面
- 永續計劃
- 減少廢棄物策略
- 生產中的能源效率
- 具有環保意識的舉措
- 考慮碳足跡
第4章 競爭情勢
- 介紹
- 企業市佔率分析
- 按地區
- 北美洲
- 歐洲
- 亞太地區
- 拉丁美洲
- 中東和非洲
- 按地區
- 公司矩陣分析
- 主要市場公司的競爭分析
- 競爭定位矩陣
- 主要進展
- 併購
- 夥伴關係與合作
- 新產品發布
- 業務拓展計劃
第5章 市場估算與預測:依紡織品類型分類,2022-2035年
- 水溶性膳食纖維
- 不溶性膳食纖維
第6章 市場估算與預測:依原料分類,2022-2035年
- 植物來源纖維
- 穀物衍生纖維
- 豆類纖維
- 根和塊莖纖維
- 水果來源的纖維
- 其他
- 合成纖維和加工纖維
- 聚葡萄糖
- 不可消化的麥芽糊精
- 產酵素纖維
- 半乳寡糖(GOS)
- 寡果醣(FOS)
- 其他
第7章 市場估計與預測:依類型分類,2022-2035年
- 粉末/顆粒
- 液體/糖漿
第8章 市場估計與預測:依應用領域分類,2022-2035年
- 烘焙點心
- 麵包捲
- 蛋糕和酥皮點心
- 餅乾和曲奇
- 穀物棒/點心棒
- 飲料
- 乳製品和冷凍甜點
- 糖果甜點
- 巧克力和巧克力糖果甜點
- 糖果甜點和軟糖
- 特殊營養食品
- 營養補充品
- 醫用營養食品
- 運動營養
- 體重管理產品
- 其他
第9章 市場估計與預測:依地區分類,2022-2035年
- 北美洲
- 美國
- 加拿大
- 歐洲
- 德國
- 英國
- 法國
- 西班牙
- 義大利
- 其他歐洲地區
- 亞太地區
- 中國
- 印度
- 日本
- 澳洲
- 韓國
- 亞太其他地區
- 拉丁美洲
- 巴西
- 墨西哥
- 阿根廷
- 其他拉丁美洲地區
- 中東和非洲
- 沙烏地阿拉伯
- 南非
- 阿拉伯聯合大公國
- 其他中東和非洲地區
第10章:公司簡介
- ADM
- BENEO
- BioNeutra
- Cargill
- Ingredion
- Kerry Group
- Nexira
- Roquette
- Sensus
- Tate & Lyle
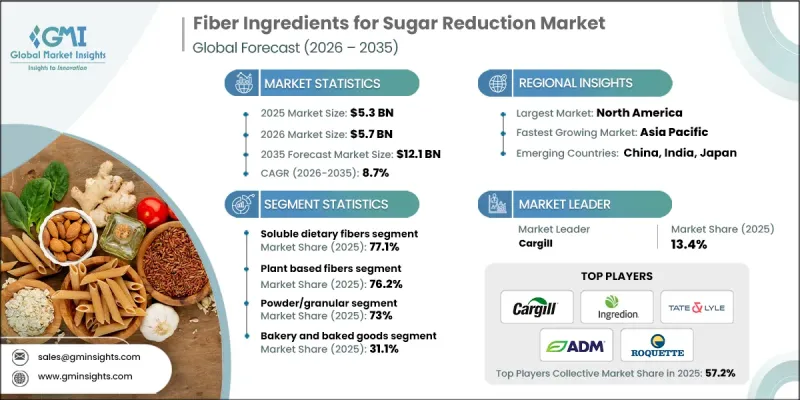
The Global Fiber Ingredients for Sugar Reduction Market was valued at USD 5.3 billion in 2025 and is estimated to grow at a CAGR of 8.7% to reach USD 12.1 billion by 2035.
Market growth is driven by a strong global shift toward healthier eating habits and rising awareness of the negative effects of excess sugar consumption. Consumers are increasingly seeking products that deliver sweetness and texture without compromising nutritional value. Fiber-based ingredients are gaining widespread adoption as effective sugar-reduction solutions because they enhance mouthfeel, balance sweetness perception, and improve overall sensory quality while contributing minimal calories and low glycemic impact. These ingredients also support the development of functional food products aligned with digestive wellness, metabolic balance, and weight management goals. Their ability to deliver clean-label formulations without artificial sweeteners makes them particularly attractive to food and beverage manufacturers. Growing regulatory pressure to reduce sugar levels in packaged foods is further accelerating demand, while continuous formulation innovation is expanding application potential across a broad range of product categories.
| Market Scope | |
|---|---|
| Start Year | 2025 |
| Forecast Year | 2026-2035 |
| Start Value | $5.3 Billion |
| Forecast Value | $12.1 Billion |
| CAGR | 8.7% |
The soluble dietary fibers segment accounted for 77.1% share in 2025 and is expected to grow at a CAGR of 8.7% through 2035. Demand for this segment is supported by increasing consumer focus on wellness-oriented nutrition and preventive health. Soluble fibers are widely incorporated into functional foods, beverages, and nutrition-focused formulations due to their role in supporting cholesterol management, blood sugar regulation, and digestive balance. Their functional versatility and compatibility with diverse formulations continue to drive strong adoption across the industry.
The plant-based fibers segment held a 76.2% share in 2025 and is forecast to grow at a CAGR of 8.8% from 2026 to 2035. Market leadership is sustained by the broad availability and functionality of fibers sourced from grains, legumes, fruits, and root crops. Demand is rising for fibers that deliver both nutritional and sensory benefits, particularly those offering prebiotic functionality and naturally derived sweetness. This diversity of plant-based sources enables manufacturers to address varying formulation needs while meeting consumer expectations for natural and recognizable ingredients.
North America Fiber Ingredients for Sugar Reduction Market held 36% share in 2025. High consumer awareness around nutrition, coupled with a strong functional food and beverage sector, supports regional expansion. Advanced processing capabilities and continuous product innovation further strengthen market development across the United States and Canada.
Key companies operating in the Global Fiber Ingredients for Sugar Reduction Market include Tate & Lyle, ADM, Ingredion, Cargill, BENEO, Roquette, Kerry Group, Nexira, Sensus, and BioNeutra. Companies in the fiber ingredients for sugar reduction market are strengthening their market foothold through sustained investment in research and development aimed at improving taste, texture, and formulation performance. Many players are expanding their portfolios with clean-label and multifunctional fiber solutions to meet evolving consumer and regulatory demands. Strategic collaborations with food and beverage manufacturers are being used to accelerate innovation and application development. Capacity expansion, supply chain optimization, and sourcing transparency are also key priorities. Firms are increasingly focusing on sustainability initiatives and regulatory compliance to enhance brand trust, while geographic expansion into high-growth regions supports long-term competitive positioning.
Table of Contents
Chapter 1 Methodology & Scope
- 1.1 Market scope and definition
- 1.2 Research design
- 1.2.1 Research approach
- 1.2.2 Data collection methods
- 1.3 Data mining sources
- 1.3.1 Global
- 1.3.2 Regional/Country
- 1.4 Base estimates and calculations
- 1.4.1 Base year calculation
- 1.4.2 Key trends for market estimation
- 1.5 Primary research and validation
- 1.5.1 Primary sources
- 1.6 Forecast model
- 1.7 Research assumptions and limitations
Chapter 2 Executive Summary
- 2.1 Industry 360° synopsis
- 2.2 Key market trends
- 2.2.1 Regional
- 2.2.2 Fiber type
- 2.2.3 Sources
- 2.2.4 Form
- 2.2.5 Application
- 2.3 TAM Analysis, 2026-2035
- 2.4 CXO perspectives: Strategic imperatives
- 2.4.1 Executive decision points
- 2.4.2 Critical success factors
- 2.5 Future Outlook and Strategic Recommendations
Chapter 3 Industry Insights
- 3.1 Industry ecosystem analysis
- 3.1.1 Supplier landscape
- 3.1.2 Profit margin
- 3.1.3 Value addition at each stage
- 3.1.4 Factor affecting the value chain
- 3.1.5 Disruptions
- 3.2 Industry impact forces
- 3.2.1 Growth drivers
- 3.2.2 Industry pitfalls and challenges
- 3.2.3 Market opportunities
- 3.3 Growth potential analysis
- 3.4 Regulatory landscape
- 3.4.1 North America
- 3.4.2 Europe
- 3.4.3 Asia Pacific
- 3.4.4 Latin America
- 3.4.5 Middle East & Africa
- 3.5 Porter's analysis
- 3.6 PESTEL analysis
- 3.7 Price trends
- 3.7.1 By region
- 3.7.2 By type
- 3.8 Future market trends
- 3.9 Technology and Innovation landscape
- 3.9.1 Current technological trends
- 3.9.2 Emerging technologies
- 3.10 Patent Landscape
- 3.11 Trade statistics (HS code)
- 3.11.1 Major importing countries
- 3.11.2 Major exporting countries
- 3.12 Sustainability and environmental aspects
- 3.12.1 Sustainable practices
- 3.12.2 Waste reduction strategies
- 3.12.3 Energy efficiency in production
- 3.12.4 Eco-friendly initiatives
- 3.13 Carbon footprint consideration
Chapter 4 Competitive Landscape, 2025
- 4.1 Introduction
- 4.2 Company market share analysis
- 4.2.1 By region
- 4.2.1.1 North America
- 4.2.1.2 Europe
- 4.2.1.3 Asia Pacific
- 4.2.1.4 LATAM
- 4.2.1.5 MEA
- 4.2.1 By region
- 4.3 Company matrix analysis
- 4.4 Competitive analysis of major market players
- 4.5 Competitive positioning matrix
- 4.6 Key developments
- 4.6.1 Mergers & acquisitions
- 4.6.2 Partnerships & collaborations
- 4.6.3 New Product Launches
- 4.6.4 Expansion Plans
Chapter 5 Market Estimates and Forecast, By Fiber Type, 2022-2035 (USD Billion) (Kilo Tons)
- 5.1 Key trends
- 5.2 Soluble dietary fibers
- 5.3 Insoluble dietary fibers
Chapter 6 Market Estimates and Forecast, By Source, 2022-2035 (USD Billion) (Kilo Tons)
- 6.1 Key trends
- 6.2 Plant-based fibers
- 6.2.1 Cereal-derived fibers
- 6.2.2 Legume-derived fibers
- 6.2.3 Root & tuber-derived fibers
- 6.2.4 Fruit-derived fibers
- 6.2.5 Others
- 6.3 Synthetic/modified fibers
- 6.3.1 Polydextrose
- 6.3.2 Resistant maltodextrin
- 6.4 Enzymatically-produced fibers
- 6.4.1 Galactooligosaccharides (GOS)
- 6.4.2 Fructooligosaccharides (FOS)
- 6.4.3 Others
Chapter 7 Market Estimates and Forecast, By Form, 2022-2035 (USD Billion) (Kilo Tons)
- 7.1 Key trends
- 7.2 Powder/granular
- 7.3 Liquid/syrup
Chapter 8 Market Estimates and Forecast, By Application, 2022-2035 (USD Billion) (Kilo Tons)
- 8.1 Key trends
- 8.2 Bakery & baked goods
- 8.2.1 Breads & rolls
- 8.2.2 Cakes & pastries
- 8.2.3 Cookies & biscuits
- 8.2.4 Cereal bars & snack bars
- 8.3 Beverages
- 8.4 Dairy & frozen desserts
- 8.5 Confectionery
- 8.5.1 Chocolate & chocolate confectionery
- 8.5.2 Sugar confectionery & gummies
- 8.6 Specialized nutrition
- 8.6.1 Dietary supplements
- 8.6.2 Medical nutrition
- 8.6.3 Sports nutrition
- 8.6.4 Weight management products
- 8.7 Others
Chapter 9 Market Estimates and Forecast, By Region, 2022-2035 (USD Billion) (Kilo Tons)
- 9.1 Key trends
- 9.2 North America
- 9.2.1 U.S.
- 9.2.2 Canada
- 9.3 Europe
- 9.3.1 Germany
- 9.3.2 UK
- 9.3.3 France
- 9.3.4 Spain
- 9.3.5 Italy
- 9.3.6 Rest of Europe
- 9.4 Asia Pacific
- 9.4.1 China
- 9.4.2 India
- 9.4.3 Japan
- 9.4.4 Australia
- 9.4.5 South Korea
- 9.4.6 Rest of Asia Pacific
- 9.5 Latin America
- 9.5.1 Brazil
- 9.5.2 Mexico
- 9.5.3 Argentina
- 9.5.4 Rest of Latin America
- 9.6 Middle East and Africa
- 9.6.1 Saudi Arabia
- 9.6.2 South Africa
- 9.6.3 UAE
- 9.6.4 Rest of Middle East and Africa
Chapter 10 Company Profiles
- 10.1 ADM
- 10.2 BENEO
- 10.3 BioNeutra
- 10.4 Cargill
- 10.5 Ingredion
- 10.6 Kerry Group
- 10.7 Nexira
- 10.8 Roquette
- 10.9 Sensus
- 10.10 Tate & Lyle
 2026-2034年全球食品減量材料市場規模、佔有率、趨勢及成長分析報告
 減糖和天然甜味劑市場預測至2032年:按產品類型、成分、形態、應用、分銷管道和地區分類的全球分析
 甜性降低成分的全球市場:功能·用途·流通管道·不同地區的預測 (~2030年)