


 |
市場調查報告書
商品編碼
1936658
整合艦橋系統市場機會、成長要素、產業趨勢分析及預測(2026年至2035年)Integrated Bridge Systems Market Opportunity, Growth Drivers, Industry Trend Analysis, and Forecast 2026 - 2035 |
||||||
全球整合艦橋系統市場預計到 2025 年將達到 71.3 億美元,到 2035 年將達到 140.7 億美元,年複合成長率為 7.2%。
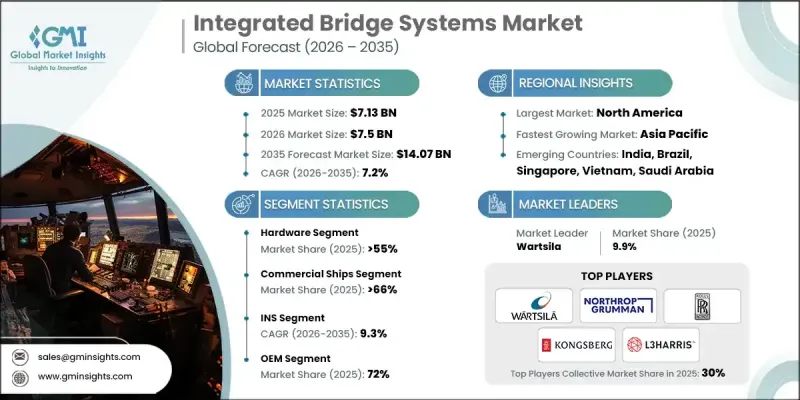
國際海運貿易的擴張和持續的船隊更新正在推動新船建造,直接增加了對工廠預裝的整合艦橋系統的需求,這些系統能夠提高航行效率、航線規劃精度和作業協調性。船東和營運商越來越注重最佳化遠洋作業,同時降低燃油消耗和整體航程成本。整合艦橋系統透過將導航智慧、效能分析和即時作業資料整合到一個統一的指揮環境中,幫助實現這些目標。配備數位技術的船舶數量不斷增加,進一步強化了對集中式控制系統的需求,這些系統能夠最大限度地減少船員的工作負荷,同時提高情境察覺。有關航行安全、監控透明度和標準化作業規範的監管壓力,並持續推動私營和政府營運船隊採用整合式駕駛台系統。隨著海上作業變得越來越資料密集和主導,整合艦橋系統正逐漸成為現代船舶架構的核心組成部分。
| 市場覆蓋範圍 | |
|---|---|
| 開始年份 | 2025 |
| 預測年份 | 2026-2035 |
| 起始值 | 71.3億美元 |
| 預測金額 | 140.7億美元 |
| 複合年成長率 | 7.2% |
2025 年,硬體部分佔 55% 的市場佔有率,預計到 2035 年將達到 73.5 億美元。整合艦橋系統中的硬體不斷發展,透過提高顯示解析度、模組化系統設計以及注重冗餘的架構,提高運行可靠性,並支援多個船舶類別的高級自動化。
到 2025 年,商船運輸領域將佔 66% 的市場佔有率,市場規模將達到 47.3 億美元。推動該領域採用的因素包括滿足安全法規、提高導航效率以及透過整合數位導航和控制平台獲得大規模營運支援的需求。
預計2025年,美國整合艦橋系統市場規模將達15.2億美元。持續進行的艦艇更新和現代化改造項目正在推動對安全、互通性且具有彈性的艦橋系統的需求,這些系統旨在滿足先進的運行需求和長期任務可靠性要求。此外,人們對網路安全的日益關注也加速了網路彈性架構的普及,這些架構能夠保護導航和控制系統免受潛在故障的影響。
目錄
第1章調查方法
第2章執行摘要
第3章業界考察
- 生態系分析
- 供應商情況
- 利潤率分析
- 成本結構
- 每個階段的附加價值
- 影響價值鏈的因素
- 中斷
- 產業影響因素
- 促進要素
- 智慧與自主船舶的普及應用日益廣泛
- 嚴格的國際海事安全法規
- 全球海運貿易的成長
- 提高燃油效率和最佳化航程的需求
- 海洋電子技術的進步
- 產業潛在風險與挑戰
- 較高的初始實施和整合成本
- 現有船舶改造的複雜性
- 市場機遇
- 完全整合橋樑系統擴展
- 新興航運經濟體的需求不斷成長
- 整合數位化和數據分析
- 海軍和國防艦隊現代化計劃
- 成長潛力分析
- 監管環境
- 北美洲
- 美國:美國海岸警衛隊航行與船舶檢查通告 (NVIC) 01-20 - 海事網路風險管理
- 加拿大:《加拿大航運法》(2001 年)-海事安全條例
- 歐洲
- 英國:商船(航行安全)條例
- 德國:BSH整合導航系統型式核准要求
- 法國:SOLAS(國際海上人命安全公約)-船舶設備要求
- 義大利:IMO SOLAS一體化駕駛室與導航系統
- 西班牙:歐盟海事設備指令(MED)-導航設備
- 亞太地區
- 中國:中國船級社關於航海設備和IBS的規則
- 日本國土交通省船舶導航設備技術標準
- 印度:商船(航海設備)規則
- 拉丁美洲
- 巴西:NORMAM-01 - 導航設備需求
- 墨西哥:SEMAR 海事安全法規
- 阿根廷:SOLAS——航行裝備合規性
- 中東和非洲
- 阿拉伯聯合大公國:海上安全法規 - SOLAS
- 南非:商船(航行安全)規則
- 沙烏地阿拉伯:SACS關於船舶導航設備的規定
- 北美洲
- 波特五力分析
- PESTEL 分析
- 科技與創新趨勢
- 當前技術趨勢
- 新興技術
- 成本細分分析
- 專利分析
- 永續性和環境方面
- 永續實踐
- 減少廢棄物策略
- 生產中的能源效率
- 環保舉措
- 未來市場展望與機遇
- 定價、商業模式和合約類型
- 硬體定價(駕駛室主機、感應器、顯示器)
- 軟體授權模式(按船舶/按模組)
- 服務和維護合約(5-20年生命週期)
- OEM捆綁定價與模組化升級
- 比較國防採購和商業運輸價格
- 安裝經濟性和生命週期成本分析
- 新船IBS安裝的成本結構
- 改造整合成本與風險
- 校準、培訓和認證費用
- 軟體更新及持續營運成本
- 新建和改造專案採用分析
- 依船舶船齡及等級分類的改裝需求
- 監管主導的改裝週期
- 投資報酬率比較:改裝vs. 全面更換
- 買家和採購決策的趨勢
- 網路安全與功能安全經濟學
第4章 競爭情勢
- 介紹
- 公司市佔率分析
- 北美洲
- 歐洲
- 亞太地區
- 拉丁美洲
- 中東和非洲
- 主要市場公司的競爭分析
- 競爭定位矩陣
- 戰略展望矩陣
- 重大進展
- 併購
- 夥伴關係與合作
- 新產品發布
- 企業擴張計畫和資金籌措
第5章 按組件分類的市場估算與預測,2022-2035年
- 硬體
- 展示
- 控制單元
- 資料儲存設備
- 感應器
- 警報裝置
- 其他
- 軟體
- 服務
- 專業服務
- 託管服務
第6章 按船舶類型分類的市場估算與預測,2022-2035年
- 商船
- 防禦艦
7. 2022-2035年各子系統市場估算與預測
- INS
- 自動氣象觀測系統(AWOS)
- 航行數據記錄儀
- 自動辨識系統(AIS)
第8章 依最終用途分類的市場估算與預測,2022-2035年
- OEM
- 售後市場
9. 依整合程度分類的市場估計與預測,2022-2035 年
- 部分
- 完全的
第10章 2022-2035年各地區市場估計與預測
- 北美洲
- 美國
- 加拿大
- 歐洲
- 德國
- 英國
- 法國
- 義大利
- 西班牙
- 俄羅斯
- 北歐國家
- 葡萄牙
- 克羅埃西亞
- 比荷盧經濟聯盟
- 亞太地區
- 中國
- 印度
- 日本
- 澳洲
- 韓國
- 新加坡
- 泰國
- 印尼
- 越南
- 拉丁美洲
- 巴西
- 墨西哥
- 阿根廷
- 哥倫比亞
- 中東和非洲
- 南非
- 沙烏地阿拉伯
- 阿拉伯聯合大公國
- 土耳其
第11章 公司簡介
- 世界玩家
- Consilium
- Furuno Electric
- Hensoldt
- Kongsberg Gruppen
- L3 Harris Technologies
- Mitsubishi Electric
- Northrop Grumman
- Rolls-Royce
- Sperry Marine
- Wartsila
- 區域玩家
- Alphatron Marine
- Beier Integrated Systems
- Japan Radio Company(JRC)
- Naudeq
- Norwegian Electric Systems
- Praxis Automation Technology
- Prime Mover Controls
- Tokyo Keiki
- Emerging/Disruptor Players
- ComNav Marine
- Hatteland Technology
- Høglund Marine Automation
- Mackay Marine
- Marine Technologies
- Naval Group Navigation Systems
- Raytheon Anschutz
- Saab Marine Electronics
- Tokyo Sensor
- Trelleborg Marine Systems
The Global Integrated Bridge Systems Market was valued at USD 7.13 billion in 2025 and is estimated to grow at a CAGR of 7.2% to reach USD 14.07 billion by 2035.
Rising international seaborne trade and continuous fleet renewal initiatives are driving the construction of new vessels, which directly increases demand for factory-installed integrated bridge systems that enhance navigational efficiency, voyage planning accuracy, and operational coordination. Shipowners and operators are increasingly focused on optimizing long-distance operations while reducing fuel consumption and overall voyage costs. Integrated bridge systems support these objectives by combining navigation intelligence, performance analytics, and real-time operational data within a single command environment. The growing presence of digitally enabled vessels is further reinforcing the need for centralized control systems that improve situational awareness while minimizing crew workload. Regulatory pressure related to navigation safety, monitoring transparency, and standardized operational practices continues to drive adoption across commercial and government-operated fleets. As maritime operations become more data-intensive and automation-driven, integrated bridge systems are positioned as a core component of modern vessel architecture.
| Market Scope | |
|---|---|
| Start Year | 2025 |
| Forecast Year | 2026-2035 |
| Start Value | $7.13 Billion |
| Forecast Value | $14.07 Billion |
| CAGR | 7.2% |
In 2025, the hardware segment held 55% share and is forecast to reach USD 7.35 billion by 2035. Hardware within integrated bridge systems continues to advance through improved display resolution, modular system design, and redundancy-focused architectures that enhance operational reliability and support higher levels of automation across multiple vessel categories.
The commercial ships segment accounted for 66% share in 2025 and generated USD 4.73 billion. Adoption within this segment is driven by the need to meet safety regulations, improve voyage efficiency, and support large-scale operations through integrated digital navigation and control platforms.
US Integrated Bridge Systems Market was valued at USD 1.52 billion in 2025. Ongoing fleet upgrades and modernization programs are driving demand for secure, interoperable, and resilient bridge systems designed to support advanced operational requirements and long-term mission reliability. Rising concerns around digital security are also accelerating the adoption of cyber-resilient architectures that protect navigation and control systems from potential disruptions.
Key companies operating in the Global Integrated Bridge Systems Market include Kongsberg Gruppen, Wartsila, Furuno Electric, Rolls-Royce, Northrop Grumman, L3Harris Technologies, Tokyo Keiki, Japan Radio Company, Alphatron Marine, and Consilium. Companies in the integrated bridge systems market strengthen their market position by investing in advanced digital navigation platforms and scalable system architectures. Many focus on integrating automation-ready hardware with intelligent software to support future vessel upgrades. Strategic partnerships with shipbuilders and fleet operators enable early system integration and long-term service contracts. Firms also emphasize compliance with evolving regulatory standards while improving cybersecurity and system redundancy. Expanding global service networks and lifecycle support capabilities helps maintain customer retention. Continuous innovation in display technologies, data fusion, and decision-support tools allows companies to differentiate offerings and capture a greater share across both commercial and government maritime sectors.
Table of Contents
Chapter 1 Methodology
- 1.1 Research approach
- 1.2 Quality commitments
- 1.2.1 GMI AI policy & data integrity commitment
- 1.3 Research trail & confidence scoring
- 1.3.1 Research trail components
- 1.3.2 Scoring components
- 1.4 Data collection
- 1.4.1 Partial list of primary sources
- 1.5 Data mining sources
- 1.5.1 Paid sources
- 1.6 Base estimates and calculations
- 1.6.1 Base year calculation
- 1.7 Forecast
- 1.8 Research transparency addendum
Chapter 2 Executive Summary
- 2.1 Industry 360° synopsis, 2022 - 2035
- 2.2 Key market trends
- 2.2.1 Regional
- 2.2.2 Component
- 2.2.3 Ship
- 2.2.4 Sub system
- 2.2.5 Level of integration
- 2.2.6 End use
- 2.3 TAM Analysis, 2026-2034
- 2.4 CXO perspectives: Strategic imperatives
- 2.4.1 Executive decision points
- 2.4.2 Critical success factors
- 2.5 Future outlook & strategic recommendations
Chapter 3 Industry Insights
- 3.1 Industry ecosystem analysis
- 3.1.1 Supplier landscape
- 3.1.2 Profit margin analysis
- 3.1.3 Cost structure
- 3.1.4 Value addition at each stage
- 3.1.5 Factor affecting the value chain
- 3.1.6 Disruptions
- 3.2 Industry impact forces
- 3.2.1.1 Growth drivers
- 3.2.1.2 Rising adoption of smart and autonomous vessels
- 3.2.1.3 Stringent international maritime safety regulations
- 3.2.1.4 Growth in global seaborne trade
- 3.2.1.5 Need for fuel efficiency and voyage optimization
- 3.2.1.6 Technological advancements in marine electronics
- 3.2.2 Industry pitfalls and challenges
- 3.2.2.1 High initial installation and integration costs
- 3.2.2.2 Complexity of retrofitting existing vessels
- 3.2.3 Market opportunities
- 3.2.3.1 Expansion of fully integrated bridge systems
- 3.2.3.2 Rising demand from emerging maritime economies
- 3.2.3.3 Digitalization and data analytics integration
- 3.2.3.4 Naval and defence fleet modernization programs
- 3.3 Growth potential analysis
- 3.4 Regulatory landscape
- 3.4.1 North America
- 3.4.1.1 United States: U.S. Coast Guard Navigation and Vessel Inspection Circular (NVIC) 01-20 - Maritime Cyber Risk Management
- 3.4.1.2 Canada: Canada Shipping Act, 2001 - Marine Safety Regulations
- 3.4.2 Europe
- 3.4.2.1 United Kingdom: Merchant Shipping (Safety of Navigation) Regulations
- 3.4.2.2 Germany: BSH Type Approval Requirements for Integrated Navigation Systems
- 3.4.2.3 France: SOLAS- Ship Navigation Equipment Requirements
- 3.4.2.4 Italy: IMO SOLAS- Integrated Bridge and Navigation Systems
- 3.4.2.5 Spain: EU Marine Equipment Directive (MED) - Navigation Equipment
- 3.4.3 Asia Pacific
- 3.4.3.1 China: China Classification Society Rules for Navigation Equipment and IBS
- 3.4.3.2 Japan: MLIT Technical Standards for Ship Navigation Equipment
- 3.4.3.3 India: Merchant Shipping (Navigational Equipment) Rules
- 3.4.4 Latin America
- 3.4.4.1 Brazil: NORMAM-01 - Navigation Equipment Requirements
- 3.4.4.2 Mexico: SEMAR Maritime Navigation Safety Regulations
- 3.4.4.3 Argentina: SOLAS- Navigation Equipment Compliance
- 3.4.5 Middle East & Africa
- 3.4.5.1 United Arab Emirates: Marine Navigation Safety Regulations - SOLAS
- 3.4.5.2 South Africa: Merchant Shipping (Safe Navigation) Regulations
- 3.4.5.3 Saudi Arabia: SACS Rules for Ship Navigation Equipment
- 3.4.1 North America
- 3.5 Porter's analysis
- 3.6 PESTEL analysis
- 3.7 Technology and innovation landscape
- 3.7.1 Current technological trends
- 3.7.2 Emerging technologies
- 3.8 Cost breakdown analysis
- 3.9 Patent analysis
- 3.10 Sustainability and environmental aspects
- 3.10.1 Sustainable practices
- 3.10.2 Waste reduction strategies
- 3.10.3 Energy efficiency in production
- 3.10.4 Eco-friendly Initiatives
- 3.11 Future market outlook & opportunities
- 3.12 Pricing, Commercial & Contracting Models
- 3.12.1 Hardware pricing (bridge consoles, sensors, displays)
- 3.12.2 Software license models (per vessel / per module)
- 3.12.3 Service & AMC contracts (5-20 year lifecycle)
- 3.12.4 OEM bundle pricing vs modular upgrades
- 3.12.5 Defense procurement vs commercial shipping pricing
- 3.13 Installation Economics & Lifecycle Cost Analysis
- 3.13.1 Newbuild IBS installation cost structure
- 3.13.2 Retrofit integration costs & risks
- 3.13.3 Calibration, training & certification costs
- 3.13.4 Software updates & recurring OPEX
- 3.14 Newbuild vs Retrofit Adoption Analysis
- 3.14.1 Retrofit demand by ship age & class
- 3.14.2 Regulatory-driven retrofit cycles
- 3.14.3 ROI comparison: retrofit vs full replacement
- 3.15 Buyer & Procurement Decision Dynamics
- 3.16 Cybersecurity & Functional Safety Economics
Chapter 4 Competitive Landscape, 2025
- 4.1 Introduction
- 4.2 Company market share analysis
- 4.2.1 North America
- 4.2.2 Europe
- 4.2.3 Asia Pacific
- 4.2.4 LATAM
- 4.2.5 MEA
- 4.3 Competitive analysis of major market players
- 4.4 Competitive positioning matrix
- 4.5 Strategic outlook matrix
- 4.6 Key developments
- 4.6.1 Mergers & acquisitions
- 4.6.2 Partnerships & collaborations
- 4.6.3 New Product Launches
- 4.6.4 Expansion Plans and funding
Chapter 5 Market Estimates & Forecast By Component, 2022 - 2035 ($Bn)
- 5.1 Key trends
- 5.2 Hardware
- 5.2.1 Displays
- 5.2.2 Control Unit
- 5.2.3 Data Storage Devices
- 5.2.4 Sensors
- 5.2.5 Alarms
- 5.2.6 Others
- 5.3 Software
- 5.4 Services
- 5.4.1 Professional services
- 5.4.2 Managed services
Chapter 6 Market Estimates & Forecast, By Ship, 2022 - 2035 ($Bn)
- 6.1 Key trends
- 6.2 Commercial Ship
- 6.3 Defense Ship
Chapter 7 Market Estimates & Forecast, By Sub system, 2022 - 2035 ($Bn)
- 7.1 Key trends
- 7.2 INS
- 7.3 Automatic Weather Observation System (AWOS)
- 7.4 Voyage Data Recorder
- 7.5 Automatic Identification System (AIS)
Chapter 8 Market Estimates & Forecast, By End use, 2022 - 2035 ($Bn)
- 8.1 Key trends
- 8.2 OEM
- 8.3 Aftermarket
Chapter 9 Market Estimates & Forecast, By Level of Integration, 2022 - 2035 ($Bn)
- 9.1 Key trends
- 9.2 Partial
- 9.3 Fully
Chapter 10 Market Estimates & Forecast, By Region, 2022 - 2035 ($Bn)
- 10.1 Key trends
- 10.2 North America
- 10.2.1 US
- 10.2.2 Canada
- 10.3 Europe
- 10.3.1 Germany
- 10.3.2 UK
- 10.3.3 France
- 10.3.4 Italy
- 10.3.5 Spain
- 10.3.6 Russia
- 10.3.7 Nordics
- 10.3.8 Portugal
- 10.3.9 Croatia
- 10.3.10 Benelux
- 10.4 Asia Pacific
- 10.4.1 China
- 10.4.2 India
- 10.4.3 Japan
- 10.4.4 Australia
- 10.4.5 South Korea
- 10.4.6 Singapore
- 10.4.7 Thailand
- 10.4.8 Indonesia
- 10.4.9 Vietnam
- 10.5 Latin America
- 10.5.1 Brazil
- 10.5.2 Mexico
- 10.5.3 Argentina
- 10.5.4 Colombia
- 10.6 MEA
- 10.6.1 South Africa
- 10.6.2 Saudi Arabia
- 10.6.3 UAE
- 10.6.4 Turkey
Chapter 11 Company Profiles
- 11.1 Global Players
- 11.1.1 Consilium
- 11.1.2 Furuno Electric
- 11.1.3 Hensoldt
- 11.1.4 Kongsberg Gruppen
- 11.1.5. L3 Harris Technologies
- 11.1.6 Mitsubishi Electric
- 11.1.7 Northrop Grumman
- 11.1.8 Rolls-Royce
- 11.1.9 Sperry Marine
- 11.1.10 Wartsila
- 11.2 Regional Players
- 11.2.1 Alphatron Marine
- 11.2.2 Beier Integrated Systems
- 11.2.3 Japan Radio Company (JRC)
- 11.2.4 Naudeq
- 11.2.5 Norwegian Electric Systems
- 11.2.6 Praxis Automation Technology
- 11.2.7 Prime Mover Controls
- 11.2.8 Tokyo Keiki
- 11.3 Emerging / Disruptor Players
- 11.3.1 ComNav Marine
- 11.3.2 Hatteland Technology
- 11.3.3 Høglund Marine Automation
- 11.3.4 Mackay Marine
- 11.3.5 Marine Technologies
- 11.3.6 Naval Group Navigation Systems
- 11.3.7 Raytheon Anschutz
- 11.3.8 Saab Marine Electronics
- 11.3.9 Tokyo Sensor
- 11.3.10 Trelleborg Marine Systems
 整合艦橋系統市場:按組件類型、整合等級、安裝類型和船舶類型分類 - 全球市場預測 2026-2032 年
 2026年全球綜合橋樑系統市場報告
 船舶綜合橋樑系統市場-全球產業規模、佔有率、趨勢、機會及預測(按子系統、船舶類型、應用、地區及競爭格局分類,2021-2031年)
 整合橋樑系統市場規模、佔有率和成長分析(按組件、船舶類型、子系統、最終用途和地區分類)—產業預測(2026-2033 年)
 全球整合艦橋系統市場規模、佔有率、產業分析報告(按子系統、組件、平台和地區分類的展望和預測,2025-2032 年)
 整合艦橋系統市場規模、佔有率、趨勢分析報告:按組件、子系統、平台、地區、細分市場預測,2025-2030 年美國整合駕駛台系統市場規模、佔有率、趨勢分析報告:按組件、子系統、平台、細分市場預測、主要企業、競爭分析,2025-2030 年
 整合艦橋系統的全球市場:市場規模·佔有率·趨勢,產業分析 (各零件·子系統·各平台·各終端用戶·各地區),未來預測 (2025年~2034年)