


 |
市場調查報告書
商品編碼
1910556
氫氣:市場佔有率分析、產業趨勢與統計、成長預測(2026-2031)Hydrogen Gas - Market Share Analysis, Industry Trends & Statistics, Growth Forecasts (2026 - 2031) |
||||||
※ 本網頁內容可能與最新版本有所差異。詳細情況請與我們聯繫。
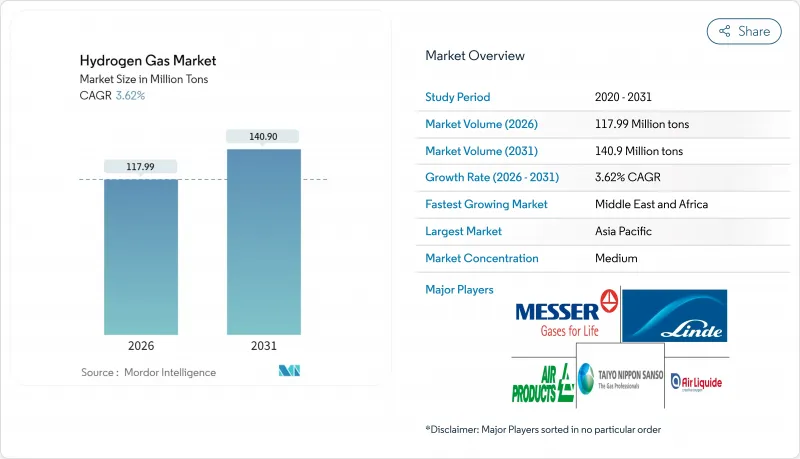
預計氫氣市場將從 2025 年的 1.1386 億噸成長到 2026 年的 1.1799 億噸,到 2031 年將達到 1.409 億噸,2026 年至 2031 年的複合年成長率為 3.62%。
基於成本競爭力、政府補貼和脫碳政策的區域競爭是影響氫氣市場的關鍵因素。日本累計200億美元用於全國範圍內的基礎建設,歐盟則推動到2030年將20%的氫氣摻入天然氣管網。生產地點和碳排放正在影響戰略選址決策,促使生產商將電解和藍氫生產設施建在低成本可再生能源和天然氣資源附近。中東和澳洲等新興出口中心為貿易增添了新的維度,而燃料電池汽車的穩步普及正在推動基礎設施需求的成長,並為建立更廣泛的加氫網路奠定基礎。
全球氫氣市場趨勢及展望
對低碳氨生產的需求
航運業的脫碳進程正在推動對綠色氨的需求,而隨著托運人尋求碳中和的船舶加註解決方案,氫氣市場的重要性日益凸顯。國際海事組織(IMO)2050年淨零排放承諾正在加速生產商的轉型,例如Yara和Angie等公司已將可再生能源連接到其化肥生產基地,以確保在碳排放受限的市場中獲得出口合格。競爭優勢取決於氫氣的碳排放強度,而不僅僅是原料價格,這為氨相關氫氣的長期結構性成長提供了保障。
煉油廠脫硫法規
2020年國際海事組織(IMO)硫含量上限和區域燃料品質標準使煉油廠的氫氣需求增加了約15%,從而為氫氣市場奠定了基本負載需求。加工高黏度原油需要更先進的加氫處理流程,這推動了煉油廠附近藍氫的投資。這些專有的整合模式透過共用公用設施確保了需求的穩定性,並簡化了碳捕獲的經濟性。
綠色/藍氫生產高成本
目前,綠氫的生產成本在每公斤3至8美元之間,具體價格取決於再生能源價格和電解性能,遠高於每公斤1至2美元的灰色氫氣。藍氫縮小了成本差距,但需要承擔碳捕獲成本並接受監管。目前,只有符合碳定價機制的高價值應用才能承擔這些增加的成本,這暫時限制了藍色氫氣在氫氣市場的普及。
細分市場分析
2025年,隨著大型工業走廊充分利用現有路權資源,管道運輸網路將佔據氫氣市場58.36%的佔有率,預計到2031年,這種運輸方式的複合年成長率將達到4.06%。歐洲氫能骨幹網全長28,000公里,與公路拖車運輸相比,可降低30%至50%的運輸成本,進而增強氫氣市場的規模經濟效益。高壓管網拖車仍將是偏遠地區需求中心和早期部署階段的重要運輸方式,而氣瓶則將用於特殊應用和偏遠地區的使用者。
在新興市場,由於缺乏現有的天然氣管網,管網運輸可以彌補基礎設施的不足,即使運輸成本高昂,也能促進氫氣技術的早期應用。隨著歐洲和美國核准流程的加快,專用氫氣管道將從叢集延伸至鋼鐵和化工廠,為深化工業脫碳和擴大氫氣市場奠定必要的基礎。
本氫氣市場報告按分銷方式(管道、高壓管束拖車、鋼瓶)、應用領域(氨、甲醇、煉油、直接還原鐵、燃料電池汽車及其他應用)和地區(亞太、北美、歐洲、南美、中東和非洲)進行分析。市場預測以噸為單位。
區域分析
預計到2025年,亞太地區將佔全球氫氣市場規模的34.12%,主要得益於中國重工業的快速發展、日本的氫能協會計劃以及韓國燃料電池發電的普及。中國的碳中和承諾和氫能煉鋼先導計畫也持續推高了該地區的氫氣需求。日本200億美元的公共資金投入正在加速氫氣供需基礎設施的建設,而韓國的「K-New Deal」計畫則將氫能融入其電力和交通發展策略。
在「再生能源賦能歐盟」(REPowerEU)計劃下,歐洲已將氫能定位為天然氣供應多元化的戰略工具,推動國內電解工廠的建設和進口碼頭的投資。德國在電解能力方面處於領先地位,荷蘭正在將鹿特丹改造為全球氫氣運輸的歐洲進口樞紐。北歐的水力和風能資源是綠色氫氣出口的基礎,挪威正在開發管道和海上運輸路線以滿足歐洲的需求。
北美正利用其豐富的天然氣蘊藏量,大力發展藍氫經濟,同時計畫投資95億美元建設氫能中心,擴大綠色氫生產。加州的低碳燃料標準支撐著除亞洲以外全球最大的加氫網路,而加拿大則致力於透過向亞洲出口液態氫來提升出口價格競爭力。中東和非洲地區在沙烏地阿拉伯NEOM計劃和阿拉伯聯合大公國出口藍圖的推動下,實現了4.03%的年複合成長率,成為成長最快的地區。這些措施旨在將豐富的太陽能資源與大規模電解技術相結合,為當地工業和國際消費者提供氫氣。
其他福利:
- Excel格式的市場預測(ME)表
- 3個月的分析師支持
目錄
第1章 引言
- 研究假設和市場定義
- 調查範圍
第2章調查方法
第3章執行摘要
第4章 市場情勢
- 市場概覽
- 市場促進因素
- 對低碳氨生產的需求
- 煉油廠脫硫法規
- 政府對綠氫能的激勵措施
- 擴大燃料電池汽車的引入
- 強制混合氫氣
- 市場限制
- 綠色/藍氫生產成本高
- 高成本的倉儲和運輸物流
- 當地民眾反對新建氫氣管道
- 價值鏈分析
- 波特五力模型
- 供應商的議價能力
- 買方的議價能力
- 新進入者的威脅
- 替代品的威脅
- 競爭對手之間的競爭
第5章 市場規模與成長預測
- 透過散佈
- 管道
- 高壓管拖車
- 圓柱
- 透過使用
- 氨
- 甲醇
- 純化
- 直接還原鐵(DRI)
- 燃料電池汽車(FCV)
- 其他用途
- 按地區
- 亞太地區
- 中國
- 印度
- 日本
- 韓國
- 東南亞國協
- 亞太其他地區
- 北美洲
- 美國
- 加拿大
- 墨西哥
- 歐洲
- 德國
- 英國
- 法國
- 義大利
- 俄羅斯
- 北歐國家
- 其他歐洲地區
- 南美洲
- 巴西
- 阿根廷
- 其他南美洲
- 中東和非洲
- 沙烏地阿拉伯
- 南非
- 其他中東和非洲地區
- 亞太地區
第6章 競爭情勢
- 市場集中度
- 策略趨勢
- 市佔率/排名分析
- 公司簡介
- Aditya Birla Chemicals
- Air Liquide
- Air Products and Chemicals, Inc.
- BASF SE
- Equinor ASA
- Gulf Cryo
- Iwatani Corp.
- Kawasaki Heavy Industries, Ltd.
- Linde plc
- MATHESON Tri-Gas, Inc.
- Messer SE & Co. KGaA
- TAIYO NIPPON SANSO CORPORATION
第7章 市場機會與未來展望
The Hydrogen Gas Market is expected to grow from 113.86 million tons in 2025 to 117.99 million tons in 2026 and is forecast to reach 140.9 million tons by 2031 at 3.62% CAGR over 2026-2031.
Cost-driven regional competitiveness, government subsidies, and decarbonization mandates are the principal forces shaping the hydrogen gas market, with Japan earmarking USD 20 billion for nationwide infrastructure and the European Union pressing toward a 20% hydrogen blend in natural-gas grids by 2030. Production location and carbon intensity now dictate strategic positioning, pushing producers to co-locate electrolysis or blue-hydrogen facilities near low-cost renewable or natural-gas resources. Emerging export hubs in the Middle East and Australia add a new trade dimension, while the steady rollout of fuel-cell vehicles builds anchor demand that underwrites a wider refueling network.
Global Hydrogen Gas Market Trends and Insights
Demand for Low-Carbon Ammonia Production
Global maritime decarbonization triggers demand for green ammonia, elevating the hydrogen gas market as shippers seek carbon-neutral bunkering solutions. The International Maritime Organization's 2050 net-zero pledge accelerates producer pivots, with Yara and Engie linking renewable power to fertilizer complexes to safeguard export eligibility in carbon-constrained markets. Competitive advantage now hinges on hydrogen carbon intensity rather than merely feedstock price, injecting long-term structural growth into ammonia-linked hydrogen volumes.
Refinery Desulfurization Regulations
The 2020 IMO sulfur cap and regional fuel-quality standards lifted refinery hydrogen offtake by nearly 15%, anchoring base-load demand in the hydrogen gas market. Heavier crude slates need deeper hydroprocessing, prompting blue-hydrogen investments adjacent to refineries. These captive integration models ensure offtake certainty and streamline carbon-capture economics through shared utilities.
High Cost of Green/Blue H2 Production
Green hydrogen currently ranges between USD 3 and 8 per kg depending on renewable electricity pricing and electrolyzer performance, outstripping gray alternatives at USD 1-2 per kg. Blue hydrogen narrows the gap but entails carbon-capture costs and regulatory scrutiny. Only premium applications with carbon-pricing compliance can presently absorb these premiums, temporarily limiting widespread uptake across the hydrogen gas market.
Other drivers and restraints analyzed in the detailed report include:
- Government Incentives for Green H2
- Rising Fuel-Cell Vehicle Rollout
- Expensive Storage and Transport Logistics
For complete list of drivers and restraints, kindly check the Table Of Contents.
Segment Analysis
Pipeline networks captured 58.36% of the hydrogen gas market share in 2025 as large industrial corridors exploit existing right-of-way assets, and this modality is growing at 4.06% CAGR through 2031. The European Hydrogen Backbone's planned 28,000 km of lines will lower delivered costs by 30-50% relative to road trailers, reinforcing scale economies across the hydrogen gas market. High-pressure tube trailers remain crucial for islanded demand centers and early-stage deployments, while cylinders serve specialized or remote users.
In emerging markets without legacy gas grids, tube-trailer logistics bridge the readiness gap, fostering early adoption despite premium transport costs. As permitting accelerates in Europe and the United States, dedicated hydrogen pipelines will broaden from refining clusters to include steel and chemical plants, providing the backbone required for deeper industrial decarbonization and wider hydrogen gas market reach.
The Hydrogen Gas Market Report is Segmented by Distribution (Pipeline, High-Pressure Tube Trailer, and Cylinder), Application (Ammonia, Methanol, Refining, Direct Reduced Iron, Fuel-Cell Vehicles, and Other Applications), and Geography (Asia-Pacific, North America, Europe, South America, and Middle East and Africa). The Market Forecasts are Provided in Terms of Volume (Tons).
Geography Analysis
Asia-Pacific accounted for 34.12% of the hydrogen gas market size in 2025, anchored by China's heavy-industry uptake, Japan's hydrogen-society agenda, and South Korea's fuel-cell power rollouts. China's carbon-neutrality pledge and pilot hydrogen-steel projects keep regional volumes elevated. Japan's USD 20 billion public-funding pool accelerates both supply and demand infrastructure, while South Korea's K-New Deal integrates hydrogen into power and transport goals.
Europe positions hydrogen as a strategic lever for gas-supply diversification under REPowerEU, catalyzing domestic electrolyzer builds and import-terminal investments. Germany leads installed electrolysis capacity, and the Netherlands is remaking Rotterdam into a continental intake hub for global hydrogen shipments. Nordic hydro and wind resources underpin green-hydrogen export ambitions, with Norway exploring pipeline and maritime routes to serve continental demand.
North America leverages ample natural-gas reserves for blue-hydrogen economics while boosting green output under the USD 9.5 billion hydrogen-hubs program. California's Low Carbon Fuel Standard underwrites the world's largest non-Asian refueling network, and Canada targets export parity with liquefied shipments to Asia. Middle East and Africa score the fastest 4.03% CAGR, led by Saudi Arabia's NEOM and the UAE's export road map, stitching together sun-rich renewable resources with scale electrolysis to supply both local industry and overseas consumers.
- Aditya Birla Chemicals
- Air Liquide
- Air Products and Chemicals, Inc.
- BASF SE
- Equinor ASA
- Gulf Cryo
- Iwatani Corp.
- Kawasaki Heavy Industries, Ltd.
- Linde plc
- MATHESON Tri-Gas, Inc.
- Messer SE & Co. KGaA
- TAIYO NIPPON SANSO CORPORATION
Additional Benefits:
- The market estimate (ME) sheet in Excel format
- 3 months of analyst support
TABLE OF CONTENTS
1 Introduction
- 1.1 Study Assumptions and Market Definition
- 1.2 Scope of the Study
2 Research Methodology
3 Executive Summary
4 Market Landscape
- 4.1 Market Overview
- 4.2 Market Drivers
- 4.2.1 Demand for Low-Carbon Ammonia Production
- 4.2.2 Refinery Desulfurization Regulations
- 4.2.3 Government Incentives for Green H2
- 4.2.4 Rising Fuel-Cell Vehicle Rollout
- 4.2.5 Hydrogen-Gas-Grid Blending Mandates
- 4.3 Market Restraints
- 4.3.1 High Cost of Green/Blue H2 Production
- 4.3.2 Expensive Storage and Transport Logistics
- 4.3.3 Community Opposition to New H2 Pipelines
- 4.4 Value Chain Analysis
- 4.5 Porter's Five Forces
- 4.5.1 Bargaining Power of Suppliers
- 4.5.2 Bargaining Power of Buyers
- 4.5.3 Threat of New Entrants
- 4.5.4 Threat of Substitutes
- 4.5.5 Competitive Rivalry
5 Market Size and Growth Forecasts (Volume)
- 5.1 By Distribution
- 5.1.1 Pipeline
- 5.1.2 High-pressure tube trailer
- 5.1.3 Cylinder
- 5.2 By Application
- 5.2.1 Ammonia
- 5.2.2 Methanol
- 5.2.3 Refining
- 5.2.4 Direct Reduced Iron (DRI)
- 5.2.5 Fuel-cell Vehicles (FCVs)
- 5.2.6 Other Applications
- 5.3 By Geography
- 5.3.1 Asia-Pacific
- 5.3.1.1 China
- 5.3.1.2 India
- 5.3.1.3 Japan
- 5.3.1.4 South Korea
- 5.3.1.5 ASEAN Countries
- 5.3.1.6 Rest of Asia-Pacific
- 5.3.2 North America
- 5.3.2.1 United States
- 5.3.2.2 Canada
- 5.3.2.3 Mexico
- 5.3.3 Europe
- 5.3.3.1 Germany
- 5.3.3.2 United Kingdom
- 5.3.3.3 France
- 5.3.3.4 Italy
- 5.3.3.5 Russia
- 5.3.3.6 NORDIC Countries
- 5.3.3.7 Rest of Europe
- 5.3.4 South America
- 5.3.4.1 Brazil
- 5.3.4.2 Argentina
- 5.3.4.3 Rest of South America
- 5.3.5 Middle East and Africa
- 5.3.5.1 Saudi Arabia
- 5.3.5.2 South Africa
- 5.3.5.3 Rest of Middle East and Africa
- 5.3.1 Asia-Pacific
6 Competitive Landscape
- 6.1 Market Concentration
- 6.2 Strategic Moves
- 6.3 Market Share/Ranking Analysis
- 6.4 Company Profiles (includes Global level Overview, Market level overview, Core Segments, Financials as available, Strategic Information, Market Rank/Share for key companies, Products and Services, and Recent Developments)
- 6.4.1 Aditya Birla Chemicals
- 6.4.2 Air Liquide
- 6.4.3 Air Products and Chemicals, Inc.
- 6.4.4 BASF SE
- 6.4.5 Equinor ASA
- 6.4.6 Gulf Cryo
- 6.4.7 Iwatani Corp.
- 6.4.8 Kawasaki Heavy Industries, Ltd.
- 6.4.9 Linde plc
- 6.4.10 MATHESON Tri-Gas, Inc.
- 6.4.11 Messer SE & Co. KGaA
- 6.4.12 TAIYO NIPPON SANSO CORPORATION
7 Market Opportunities and Future Outlook
- 7.1 White-space and Unmet-need Assessment
 電能轉氣市場:按組件、技術、應用和最終用戶分類 - 2026-2032年全球市場預測氣化市場:氣化設備類型、原料類型、技術、計劃產能與最終用途-2026-2032年全球市場預測
 2026年全球P2H2(電制氫)市場報告
 氣化市場規模、佔有率、成長及全球產業分析:按類型、應用和地區的洞察,2026-2034年的預測全球Power-to-X市場:市場規模、佔有率、成長率、產業分析、依類型、應用和地區劃分的考察以及未來預測(2026-2034)
 電能轉氣市場機會、成長要素、產業趨勢分析及預測(2026年至2035年)
 氣化市場-全球產業規模、佔有率、趨勢、機會、預測:依原料、應用、區域和競爭格局分類,2021-2031年電轉氣市場-全球產業規模、佔有率、趨勢、機會和預測:按技術、產能、最終用戶、地區和競爭格局分類,2021-2031年Power-To-X 市場 - 全球產業規模、佔有率、趨勢、機會和預測,按技術、最終用途、地區和競爭格局分類,2021-2031 年預測
 氣化市場規模、佔有率及成長分析(依原料、氣化爐類型、應用、最終用戶及地區分類)-2026-2033年產業預測