


 |
市場調查報告書
商品編碼
1936591
汽車變速箱市場機會、成長要素、產業趨勢分析及預測(2026年至2035年)Automotive Transmission Market Opportunity, Growth Drivers, Industry Trend Analysis, and Forecast 2026 - 2035 |
||||||
全球汽車變速箱市場預計到 2025 年將達到 1,835 億美元,到 2035 年將達到 3,115 億美元,年複合成長率為 5.6%。
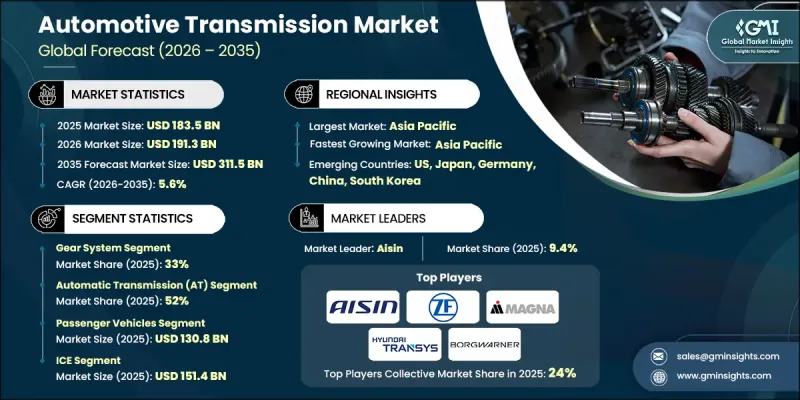
全球日益嚴格的燃油經濟性和排放氣體法規正在塑造市場成長,迫使汽車製造商採用先進的變速箱技術,在不犧牲駕駛舒適性的前提下提高燃油經濟性。主要汽車市場的法規結構推動了變速箱檔位數量的增加、智慧換檔邏輯的改進以及與混合動力傳動系統的兼容性,從而鞏固了整車製造商(OEM)的研發策略和供應商的長期投資。同時,消費者偏好的轉變正在加速手排變速箱的淘汰,因為駕駛者越來越傾向於平順、便利和精緻的駕駛體驗,尤其是在擁擠的城市環境中。自動變速箱、雙離合器變速箱和無段變速箱在大眾市場和豪華車型中正變得越來越普遍。電池式電動車( BEV)通常採用簡化的動力傳動系統,但不斷成長的產量正在推動對變速箱組件、差速器和整合式電力驅動模組的需求。這種轉變凸顯了軟體整合、熱控制和噪音最佳化的重要性,在日益複雜的機械結構中提升了系統的價值。
| 市場覆蓋範圍 | |
|---|---|
| 開始年份 | 2025 |
| 預測年份 | 2026-2035 |
| 起始值 | 1835億美元 |
| 預測金額 | 3115億美元 |
| 複合年成長率 | 5.6% |
預計到2025年,齒輪系統市佔率將達到33%,並在2035年之前以5.5%的複合年成長率成長。齒輪系統是任何傳動系統架構的重要組成部分,也是傳統汽車和電動車實現扭力轉換、動力分配和效率最佳化的基礎元件。齒輪設計、精密製造和降噪技術的不斷改進,進一步鞏固了齒輪系統在現代動力傳動系統中的核心地位。
到2025年,自動變速箱將佔據52%的市場佔有率,預計在2026年至2035年間將以6%的複合年成長率成長。先進的控制單元現在利用自適應邏輯,根據駕駛行為和運行狀況最佳化換檔時機,從而實現更平順的性能和更高的燃油效率。這些優勢持續推動所有車型領域對手排變速箱的廣泛替代品。
預計到2025年,中國汽車變速箱市場規模將達到351億美元。作為全球最大的汽車生產基地,中國對自動變速箱、CVT變速箱和雙離合器變速箱的需求持續強勁,同時,依賴先進減速和整合驅動技術的電動動力傳動系統總成也實現了快速成長。
目錄
第1章調查方法和範圍
第2章執行摘要
第3章業界考察
- 生態系分析
- 供應商情況
- 系統平台提供者
- 硬體供應商
- 動力傳動系統和軟體整合合作夥伴
- 利基專家
- 最終用途
- 成本結構
- 利潤率
- 每個階段的附加價值
- 影響供應鏈的因素
- 顛覆者
- 供應商情況
- 影響因素
- 促進要素
- 嚴格的排放氣體和燃油經濟法規
- 對舒適性和性能的需求日益成長
- 對電池式電動車(BEV)的需求不斷成長
- 新興市場汽車擁有量不斷成長
- 產業潛在風險與挑戰
- 技術複雜性與成本壓力
- 電動車的普及正在蠶食傳統變速箱的市場佔有率。
- 市場機遇
- 擴大電氣化和混合動力輸電系統
- 商用車和非公路用車輛電氣化發展
- 軟體定義和模組化運輸平台
- 促進要素
- 成長潛力分析
- 監管環境
- 北美洲
- CAFE 標準
- 美國環保署溫室氣體排放標準
- 美墨加協定汽車原產地規則
- 加州空氣資源委員會(CARB)先進清潔汽車和先進清潔卡車法規
- 歐洲
- 歐盟碳排放績效標準
- 歐7排放氣體法規
- 適用於 55 包裝
- REACH 指令和報廢車輛 (ELV) 指令
- 亞太地區
- 中國第六排放氣體法規
- 中國新能源汽車強制政策
- BS-VI排放氣體法規(印度)
- 日本燃油效率標準領導者
- 拉丁美洲
- PROCONVE(巴西排放標準)
- 阿根廷車輛排放氣體法規
- 墨西哥NOM排放標準
- 中東和非洲
- 海灣合作理事會(GCC)燃油經濟性與排放氣體法規
- 南非汽車生產與發展計畫(APDP)
- 國內電動車和產業本地化政策
- 北美洲
- 波特五力分析
- PESTEL 分析
- 科技與創新趨勢
- 當前技術趨勢
- 新興技術
- 定價分析
- 依產品
- 按地區
- 成本細分分析
- 專利分析
- 生產統計
- 生產基地
- 消費基礎
- 進出口
- 永續性和環境方面
- 永續實踐
- 減少廢棄物策略
- 生產中的能源效率
- 環保舉措
- 碳足跡考量
- 傳動系統價格基準
- 總擁有成本 (TCO) 比較
- 製造和生產能力分析
- 客戶和OEM廠商的購買行為
- 軟體經濟學與策略
第4章 競爭情勢
- 介紹
- 公司市佔率分析
- 北美洲
- 歐洲
- 亞太地區
- 拉丁美洲
- 中東和非洲
- 主要市場公司的競爭分析
- 競爭定位矩陣
- 戰略展望矩陣
- 重大進展
- 併購
- 夥伴關係與合作
- 新產品發布
- 企業擴張計畫和資金籌措
第5章 依輸電方式分類的市場估計與預測,2022-2035年
- 手排變速箱(MT)
- 自動變速箱(AT)
- 無段變速箱(CVT)
- 雙離合器變速箱(DCT)
- 自動手排變速箱(AMT)
第6章 按組件分類的市場估算與預測,2022-2035年
- 齒輪系統
- 離合器總成
- 液力變矩器
- 機電一體化與控制單元(TCU)
- 車軸和差速器系統
- 其他
第7章 依車輛類型分類的市場估計與預測,2022-2035年
- 搭乘用車
- 掀背車
- 轎車
- SUV/跨界車
- 商用車輛
- 輕型商用車(LCV)
- 中型商用車(MCV)
- 重型商用車(HCV)
第8章 2022-2035年按推進方式分類的市場估算與預測
- 內燃機(ICE)
- 電動車
- 混合動力電動車(HEV)
- 插電式混合動力電動車(PHEV)
- 電池式電動車(BEV)
第9章 依銷售管道分類的市場估計與預測,2022-2035年
- OEM
- 售後市場
第10章 2022-2035年各地區市場估計與預測
- 北美洲
- 美國
- 加拿大
- 歐洲
- 德國
- 英國
- 法國
- 義大利
- 西班牙
- 俄羅斯
- 北歐國家
- 比荷盧經濟聯盟
- 亞太地區
- 中國
- 印度
- 日本
- 澳洲
- 韓國
- 菲律賓
- 印尼
- 新加坡
- 拉丁美洲
- 巴西
- 墨西哥
- 阿根廷
- 智利
- 中東和非洲
- 南非
- 沙烏地阿拉伯
- 阿拉伯聯合大公國
第11章 公司簡介
- Global leaders
- ZF Friedrichshafen
- Aisin
- Magna International
- BorgWarner
- Schaeffler
- Hyundai Transys
- JATCO
- Allison Transmission
- Eaton
- GKN Automotive
- 本地製造商
- Punch Powertrain
- Dana
- AVL List
- Ricardo
- Nidec
- GETRAG
- Yutong Group Powertrain Division
- SAIC Transmission Systems
- AVTEC
- FEV
- 新興企業
- Inovance Automotive
- Zhejiang Wanliyang Transmission
- Hofer Powertrain
- Xtrac
- Blue Nexus
The Global Automotive Transmission Market was valued at USD 183.5 billion in 2025 and is estimated to grow at a CAGR of 5.6% to reach USD 311.5 billion by 2035.
Market growth is shaped by increasingly stringent global efficiency and emission regulations, which are pushing automakers to adopt advanced transmission technologies that enhance fuel economy without compromising driving comfort. Regulatory frameworks across major automotive regions are encouraging higher gear counts, intelligent shift logic, and compatibility with hybrid powertrains, firmly anchoring OEM development strategies and long-term supplier investments. At the same time, changing consumer preferences are accelerating the transition away from manual transmissions, as drivers increasingly favor smooth, convenient, and refined driving experiences, especially in congested urban environments. Automatic, dual-clutch, and continuously variable transmissions are gaining traction across both mass-market and premium vehicles. While battery electric vehicles typically rely on simplified drivetrains, their rising volumes are generating strong demand for reduction gearsets, differentials, and integrated electric drive modules. This shift is increasing the importance of software integration, thermal control, and noise optimization, raising system value even as mechanical complexity evolves.
| Market Scope | |
|---|---|
| Start Year | 2025 |
| Forecast Year | 2026-2035 |
| Start Value | $183.5 Billion |
| Forecast Value | $311.5 Billion |
| CAGR | 5.6% |
The gear system segment held 33% share in 2025 and is expected to grow at a CAGR of 5.5% through 2035. Gear systems remain fundamental across all transmission architectures, supporting torque conversion, power distribution, and efficiency optimization in both conventional and electrified vehicles. Continuous improvements in gear design, precision manufacturing, and noise reduction are reinforcing their central role in modern drivetrains.
The automatic transmissions accounted for 52% share in 2025 and are forecast to grow at a CAGR of 6% from 2026 to 2035. Advanced control units now leverage adaptive logic to optimize shift timing based on driving behavior and operating conditions, delivering smoother performance and improved fuel efficiency. These benefits continue to drive widespread replacement of manual gearboxes across vehicle segments.
China Automotive Transmission Market reached USD 35.1 billion in 2025. As the world's largest vehicle manufacturing hub, the country continues to see strong demand for automatic, CVT, and dual-clutch systems, alongside rapid growth in electrified powertrains that rely on advanced reduction and integrated drive technologies.
Key players in the Global Automotive Transmission Market include ZF Friedrichshafen, Aisin, BorgWarner, Magna International, Allison Transmission, Schaeffler, JATCO, Eaton, GKN Automotive, and Hyundai Transys. Companies operating in the automotive transmission market are strengthening their competitive position by investing in next-generation transmission platforms that support electrification, hybridization, and improved efficiency. Strategic collaborations with automakers enable early integration of advanced systems into new vehicle architectures. Firms are prioritizing software-driven optimization, modular transmission designs, and lightweight materials to enhance performance and reduce costs. Expanding production capacity in high-growth regions, improving vertical integration, and focusing on reliability and durability are also key priorities. Additionally, manufacturers are advancing e-axle solutions and intelligent control technologies to align with long-term electrification trends and evolving regulatory requirements.
Table of Contents
Chapter 1 Methodology & Scope
- 1.1 Research approach
- 1.2 Quality Commitments
- 1.2.1 GMI AI policy & data integrity commitment
- 1.3 Research Trail & Confidence Scoring
- 1.3.1 Research Trail Components
- 1.3.2 Scoring Components
- 1.4 Data Collection
- 1.4.1 Partial list of primary sources
- 1.5 Data mining sources
- 1.5.1 Paid sources
- 1.6 Base estimates and calculations
- 1.6.1 Base year calculation for any one approach
- 1.7 Forecast model
- 1.8 Research transparency addendum
Chapter 2 Executive Summary
- 2.1 Industry 3600 synopsis, 2022-2035
- 2.2 Key market trends
- 2.2.1 Regional
- 2.2.2 Transmission
- 2.2.3 Component
- 2.2.4 Vehicle
- 2.2.5 Propulsion
- 2.2.6 Sales Channel
- 2.3 TAM Analysis, 2026-2035
- 2.4 CXO perspectives: Strategic imperatives
- 2.4.1 Key decision points for industry executives
- 2.4.2 Critical success factors for market players
- 2.5 Future outlook and strategic recommendations
Chapter 3 Industry Insights
- 3.1 Industry ecosystem analysis
- 3.1.1 Supplier landscape
- 3.1.1.1 System & platform providers
- 3.1.1.2 Hardware suppliers
- 3.1.1.3 Powertrain & software integration partners
- 3.1.1.4 Niche specialists
- 3.1.1.5 End use
- 3.1.2 Cost structure
- 3.1.3 Profit margin
- 3.1.4 Value addition at each stage
- 3.1.5 Factors impacting the supply chain
- 3.1.6 Disruptors
- 3.1.1 Supplier landscape
- 3.2 Impact on forces
- 3.2.1 Growth drivers
- 3.2.1.1 Stringent emission & fuel economy regulations
- 3.2.1.2 Rising demand for comfort & performance
- 3.2.1.3 Increasing demand in battery electric vehicles (BEVs)
- 3.2.1.4 Rising vehicle ownership across emerging markets
- 3.2.2 Industry pitfalls & challenges
- 3.2.2.1 Technological complexity & cost pressure
- 3.2.2.2 Ev transition cannibalizing traditional transmissions
- 3.2.3 Market opportunities
- 3.2.3.1 Expansion of electrified and hybrid transmission systems
- 3.2.3.2 Growth in commercial and off-highway electrification
- 3.2.3.3 Software-defined and modular transmission platforms
- 3.2.1 Growth drivers
- 3.3 Growth potential analysis
- 3.4 Regulatory landscape
- 3.4.1 North America
- 3.4.1.1 CAFE Standards
- 3.4.1.2 EPA Greenhouse Gas (GHG) Emission Standards
- 3.4.1.3 USMCA Automotive Rules of Origin
- 3.4.1.4 CARB Advanced Clean Cars & Advanced Clean Trucks Regulations
- 3.4.2 Europe
- 3.4.2.1 EU CO2 Emission Performance Standards
- 3.4.2.2 Euro 7 Emission Regulations
- 3.4.2.3 Fit for 55 Package
- 3.4.2.4 REACH & End-of-Life Vehicle (ELV) Directives
- 3.4.3 Asia Pacific
- 3.4.3.1 China VI Emission Standards
- 3.4.3.2 NEV (New Energy Vehicle) Mandate - China
- 3.4.3.3 BS-VI Emission Norms (India)
- 3.4.3.4 Japan Top Runner Fuel Economy Program
- 3.4.4 Latin America
- 3.4.4.1 PROCONVE (Brazil Emission Standards)
- 3.4.4.2 Argentina Vehicle Emission Regulations
- 3.4.4.3 Mexico NOM Emission Standards
- 3.4.5 Middle East & Africa
- 3.4.5.1 GCC Fuel Economy and Emission Regulations
- 3.4.5.2 South Africa Automotive Production and Development Programme (APDP)
- 3.4.5.3 National EV & Industrial Localization Policies
- 3.4.1 North America
- 3.5 Porter's analysis
- 3.6 PESTEL analysis
- 3.7 Technology and innovation landscape
- 3.7.1 Current technological trends
- 3.7.2 Emerging technologies
- 3.8 Pricing analysis
- 3.8.1 By product
- 3.8.2 By region
- 3.9 Cost breakdown analysis
- 3.10 Patent analysis
- 3.11 Production statistics
- 3.11.1 Production hubs
- 3.11.2 Consumption hubs
- 3.11.3 Export and import
- 3.12 Sustainability and environmental aspects
- 3.12.1 Sustainable practices
- 3.12.2 Waste reduction strategies
- 3.12.3 Energy efficiency in production
- 3.12.4 Eco-friendly initiatives
- 3.12.5 Carbon footprint considerations
- 3.13 Transmission system pricing benchmarks
- 3.14 Total Cost of Ownership (TCO) comparison
- 3.15 Manufacturing & capacity analysis
- 3.16 Customer & OEM buying behavior
- 3.17 Software economics & strategy
Chapter 4 Competitive Landscape, 2025
- 4.1 Introduction
- 4.2 Company market share analysis
- 4.2.1 North America
- 4.2.2 Europe
- 4.2.3 Asia Pacific
- 4.2.4 LATAM
- 4.2.5 MEA
- 4.3 Competitive analysis of major market players
- 4.4 Competitive positioning matrix
- 4.5 Strategic outlook matrix
- 4.6 Key developments
- 4.6.1 Mergers & acquisitions
- 4.6.2 Partnerships & collaborations
- 4.6.3 New product launches
- 4.6.4 Expansion plans and funding
Chapter 5 Market Estimates & Forecast, By Transmission, 2022 - 2035 ($Bn, Units)
- 5.1 Key trends
- 5.2 Manual transmission (MT)
- 5.3 Automatic transmission (AT)
- 5.4 Continuously variable transmission (CVT)
- 5.5 Dual-clutch transmission (DCT)
- 5.6 Automated manual transmission (AMT)
Chapter 6 Market Estimates & Forecast, By Component, 2022 - 2035 ($Bn, Units)
- 6.1 Key trends
- 6.2 Gear systems
- 6.3 Clutch assemblies
- 6.4 Torque converters
- 6.5 Mechatronics & control units (TCU)
- 6.6 Axle & differential systems
- 6.7 Others
Chapter 7 Market Estimates & Forecast, By Vehicle, 2022 - 2035 ($Bn, Units)
- 7.1 Key trends
- 7.2 Passenger vehicles
- 7.2.1 Hatchback
- 7.2.2 Sedan
- 7.2.3 SUV / Crossover
- 7.3 Commercial vehicles
- 7.3.1 Light commercial vehicles (LCV)
- 7.3.2 Medium commercial vehicles (MCV)
- 7.3.3 Heavy commercial vehicles (HCV)
Chapter 8 Market Estimates & Forecast, By Propulsion, 2022 - 2035 ($Bn, Units)
- 8.1 Key trends
- 8.2 Internal combustion engine (ICE)
- 8.3 Electric Vehicles
- 8.3.1 Hybrid electric vehicles (HEV)
- 8.3.2 Plug-in hybrid electric vehicles (PHEV)
- 8.3.3 Battery electric vehicles (BEV)
Chapter 9 Market Estimates & Forecast, By Sales Channel, 2022 - 2035 ($Bn, Units)
- 9.1 Key trends
- 9.2 OEM
- 9.3 Aftermarket
Chapter 10 Market Estimates & Forecast, By Region, 2022 - 2035 ($Bn, Units)
- 10.1 Key trends
- 10.2 North America
- 10.2.1 US
- 10.2.2 Canada
- 10.3 Europe
- 10.3.1 Germany
- 10.3.2 UK
- 10.3.3 France
- 10.3.4 Italy
- 10.3.5 Spain
- 10.3.6 Russia
- 10.3.7 Nordics
- 10.3.8 Benelux
- 10.4 Asia Pacific
- 10.4.1 China
- 10.4.2 India
- 10.4.3 Japan
- 10.4.4 Australia
- 10.4.5 South Korea
- 10.4.6 Philippines
- 10.4.7 Indonesia
- 10.4.8 Singapore
- 10.5 Latin America
- 10.5.1 Brazil
- 10.5.2 Mexico
- 10.5.3 Argentina
- 10.5.4 Chile
- 10.6 MEA
- 10.6.1 South Africa
- 10.6.2 Saudi Arabia
- 10.6.3 UAE
Chapter 11 Company Profiles
- 11.1 Global leaders
- 11.1.1 ZF Friedrichshafen
- 11.1.2 Aisin
- 11.1.3 Magna International
- 11.1.4 BorgWarner
- 11.1.5 Schaeffler
- 11.1.6 Hyundai Transys
- 11.1.7 JATCO
- 11.1.8 Allison Transmission
- 11.1.9 Eaton
- 11.1.10 GKN Automotive
- 11.2 Regional players
- 11.2.1 Punch Powertrain
- 11.2.2 Dana
- 11.2.3 AVL List
- 11.2.4 Ricardo
- 11.2.5 Nidec
- 11.2.6 GETRAG
- 11.2.7 Yutong Group Powertrain Division
- 11.2.8 SAIC Transmission Systems
- 11.2.9 AVTEC
- 11.2.10 FEV
- 11.3 Emerging players
- 11.3.1 Inovance Automotive
- 11.3.2 Zhejiang Wanliyang Transmission
- 11.3.3 Hofer Powertrain
- 11.3.4 Xtrac
- 11.3.5 Blue Nexus
 2026年全球汽車變速箱工程服務外包市場報告
 汽車自動變速箱:市場佔有率分析、行業趨勢和統計數據、成長預測(2026-2031)
 全球自動變速箱市場規模、佔有率、趨勢和成長分析報告(2026-2034年)汽車變速箱市場規模、佔有率、成長率和全球產業分析:按類型、應用和地區的洞察,2026-2034年預測
 中重型商用車變速箱市場-全球產業規模、佔有率、趨勢、機會及預測(按類型、燃料類型、齒輪類型、地區和競爭格局分類,2021-2031年)汽車變速箱工程服務外包市場-全球產業規模、佔有率、趨勢、機會及預測(按變速箱類型、動力傳動系統類型、服務、地區和競爭格局分類,2021-2031)
 變速箱再製造市場:按變速箱類型、車輛類型、工藝類型和分銷管道分類,全球預測,2026-2032年變速箱同步器用黃銅環市場按類型、分銷管道、車輛類型和最終用途行業分類-2026年至2032年全球預測
 汽車自動變速箱市場規模、佔有率和成長分析(按變速箱類型、車輛類型、驅動系統和地區分類)-2026-2033年產業預測汽車自排變速箱市場-全球產業規模、佔有率、趨勢、機會及預測。依車輛類型、燃料類型、類型、地區和競爭格局分類(2021-2031年預測)