

 |
市場調查報告書
商品編碼
1928944
資料中心液冷市場機會、成長要素、產業趨勢分析及2026年至2035年預測Data Center Liquid Cooling Market Opportunity, Growth Drivers, Industry Trend Analysis, and Forecast 2026 - 2035 |
||||||
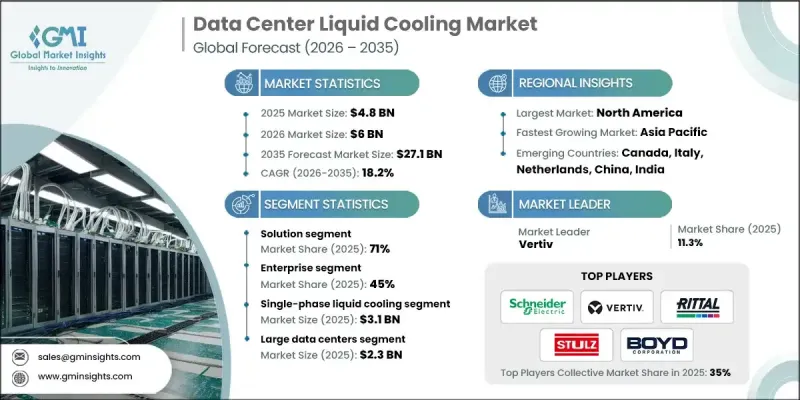
全球資料中心液冷市場預計到 2025 年將達到 48 億美元,到 2035 年將達到 271 億美元,年複合成長率為 18.2%。
能源成本不斷上漲,加上日益嚴格的永續性要求,正在加速資料中心採用液冷技術。與傳統風冷設施的1.4至1.8相比,液冷系統的電源使用效率 (PUE) 顯著降低,僅1.05至1.15,直接降低電力消耗並減少二氧化碳排放。歐盟能源效率指令、德國能源效率法案(目標是到2027年將PUE降至1.3)以及加州能源效率標準等監管要求,正推動營運商採用先進的冷卻解決方案。此外,液冷系統能夠回收廢熱用於區域供熱或工業流程,使資料中心成為循環能源經濟的貢獻者,幫助企業實現淨零排放目標,並提升營運的永續性。北美地區持續引領資料中心液冷市場,這主要得益於該地區高度集中的超大規模雲端營運商、半導體製造商和系統整合商,他們部署了高密度人工智慧和高效能運算基礎設施。
| 市場覆蓋範圍 | |
|---|---|
| 開始年份 | 2025 |
| 預測年份 | 2026-2035 |
| 起始值 | 48億美元 |
| 預測金額 | 271億美元 |
| 複合年成長率 | 18.2% |
預計到2025年,解決方案領域將佔據71%的市場佔有率,並在2026年至2035年間以15%的複合年成長率成長。晶片級直接冷卻是成長最快的技術,它使用直接連接到處理器、GPU或記憶體的冷板或微通道冷卻器,在熱量散發到大氣之前將其去除60-80%。這些系統在晶片表面循環冷卻劑,例如含有抑制劑的水或乙二醇混合物,從而實現低至0.01-0.05 度C/W的熱阻。
預計2025年,單相液冷系統市場規模將達31億美元。這類系統在整個循環過程中保持冷卻劑處於液態,透過傳導和對流傳遞熱量,無需發生相變。依設計不同,冷卻劑在18-50°C(60-122°F)的溫度下循環流經冷板、浸沒式水箱或熱交換器,然後由冷卻器、乾式冷卻器或冷卻塔將熱量從循環迴路中排出。
2025 年美國資料中心液冷市場價值 12.9 億美元。推動公共部門資料中心採用液冷技術的關鍵因素包括聯邦政府的各項舉措,例如人工智慧和高效能運算計畫、CHIPS 法案下的半導體資金,以及包含人工智慧的國防現代化計劃。
目錄
第1章調查方法和範圍
第2章執行摘要
第3章業界考察
- 生態系分析
- 供應商情況
- 元件供應商
- 製造商
- 系統整合商
- 管道路徑分析
- 雲端服務供應商
- 最終用戶
- 成本結構
- 利潤率
- 每個階段的附加價值
- 影響供應鏈的因素
- 顛覆者
- 供應商情況
- 影響因素
- 促進要素
- 人工智慧和高效能運算工作負載的指數級成長
- 能源成本上漲和對永續性的需求
- 超大規模和託管資料中心基礎架構擴展
- 邊緣運算和分散式架構的興起
- 產業潛在風險與挑戰
- 初始投資高且複雜
- 技術風險和操作問題
- 市場機遇
- 對現有資料中心設施維修和現代化改造
- 混合冷卻架構的開發
- 市場上冷氣即服務和託管服務模式的興起
- 促進要素
- 成長潛力分析
- 監管環境
- 北美洲
- 美國能源政策法案(PUE 標準)
- 加州第24號能源效率法規
- NERC關鍵基礎設施保護(冷卻可靠性)
- 歐洲
- 歐盟能源效率指令(EED)
- 德國能源保護法(PUE<=1.3)
- 英國能源產品政策框架
- 氣候中和資料中心協議
- 法國資料中心能源報告法規
- 亞太地區
- 中國 GB 50174 PUE 標準(要求 PUE 值低於 1.3)
- 數位印度效率指南
- 新加坡綠色資料中心藍圖
- 日本地震冷卻標準
- 澳洲資料中心能源監管
- 拉丁美洲
- 巴西ANATEL能源效率標準
- 墨西哥資料中心永續性指南
- 智利綠色資料中心激勵措施
- 中東和非洲
- 阿拉伯聯合大公國2030年綠色議程
- 沙烏地阿拉伯2030年資料效率願景
- 南非關鍵基礎建設法規
- 北美洲
- 波特的分析
- PESTEL 分析
- 技術與創新展望
- 當前技術趨勢
- 新興技術
- 成本細分分析
- 按機架密度等級分類的每千瓦冷卻成本
- 新安裝與維修之間的成本差異
- 總擁有成本 (TCO)
- 專利分析
- 案例研究
- 永續性和環境方面
- 永續實踐
- 減少廢棄物策略
- 生產中的能源效率
- 環保舉措
- 碳足跡考量
- 架構分析
- 晶片級液冷
- 浸沒式冷卻
- 空氣冷卻至液體冷卻過渡分析
- 資料中心功率密度趨勢
- 對高效能運算的需求日益成長
- 加速邊緣運算
- 先進的冷卻技術
- 空間最佳化
- 客製化工作負載解決方案
- 建立關係和加強夥伴關係
- 策略整合夥伴關係模式
- 聯合工程服務
- 聯合製定綜合標準
- 聯合競標超大規模資料中心計劃
- 試辦合作機會
- 與超大規模資料中心業者營運商的示範計劃
- 企業維修中的策略實施
- 策略整合夥伴關係模式
- 與現有基礎設施的整合和效率最佳化
- 整合策略
- 維修之路
- 利用現有冷水系統進行晶片直接貼裝
- 後門熱交換器直接安裝改裝
- 模組化添加浸入式艙
- 混合整合
- 空氣冷卻+液體冷卻區
- 部分機架液體輔助(GPU機架)
- 適應新環境
- 如果是校園的一部分,則需與現有系統進行整合設計。
- 隔離式液冷二次迴路
- 效率最佳化方法
- 熱效率
- 機架級散熱最佳化
- 整合式冷熱通道封閉系統
- 最大限度減少再循環和旁通氣流
- 整合策略
第4章 競爭情勢
- 介紹
- 公司市佔率分析
- 北美洲
- 歐洲
- 亞太地區
- LATAM
- 中東和非洲
- 主要市場公司的競爭分析
- 競爭定位矩陣
- 戰略展望矩陣
- 重大進展
- 併購
- 夥伴關係與合作
- 新產品發布
- 擴張計劃和資金籌措
- 整合與維修的基準
- 在現有機架上安裝液冷系統所需時間
- 維修期間停機的影響
- 與現有中央空調/中央空調或附屬機組相容
- 擴展營運複雜性
第5章 按組件分類的市場估算與預測,2022-2035年
- 解決方案
- 直接到尖端
- 冷板
- 微通道冷卻器
- 身臨其境型
- IT底盤
- 浴缸/開放式浴缸
- 後門熱交換器
- 主動式(泵浦驅動)
- 被動元件
- 直接到尖端
- 服務
- 託管服務
- 遠端監控
- 效能最佳化
- 維護和支援服務
- 專業服務
- 諮詢與設計
- 安裝與實施
- 託管服務
第6章 依冷卻機制分類的市場估計與預測,2022-2035年
- 單相液體冷卻
- 兩相液冷
7. 冷媒市場估算與預測,2022-2035年
- 水性冷卻劑
- 介電液
- 合成流體
- 礦物油
- 生物基/天然系冷卻劑
第8章 資料中心市場估算與預測,2022-2035年
- 小規模資料中心
- 中型資料中心
- 大型資料中心
第9章 按應用領域分類的市場估算與預測,2022-2035年
- 伺服器冷卻
- CPU散熱
- GPU/AI加速器冷卻
- 儲冷
- 網路冷卻
- 其他
第10章 依最終用途分類的市場估計與預測,2022-2035年
- 對於企業
- BFSI
- 零售與電子商務
- 政府
- 衛生保健
- 製造業
- IT相關服務(ITeS)
- 其他
- 通訊服務供應商
- 雲端服務供應商
第11章 2022-2035年各地區市場估計與預測
- 北美洲
- 美國
- 加拿大
- 墨西哥
- 歐洲
- 英國
- 德國
- 法國
- 義大利
- 西班牙
- 波蘭
- 比荷盧經濟聯盟
- 亞太地區
- 中國
- 印度
- 日本
- 澳洲
- 韓國
- 東南亞
- 拉丁美洲
- 巴西
- 哥倫比亞
- 阿根廷
- 智利
- 中東和非洲
- 南非
- 沙烏地阿拉伯
- 阿拉伯聯合大公國
第12章:公司簡介
- Global leaders
- Alfa Laval
- Asetek
- Boyd
- CoolIT Systems
- Green Revolution Cooling(GRC)
- LiquidStack
- Rittal
- Schneider Electric
- Stulz
- Vertiv
- 區域玩家
- Asperitas
- DCX Liquid Cooling Systems
- Delta Electronics
- DUG Technology
- Iceotope Technologies
- Kaori Heat Treatment
- Submer Technologies
- 新興企業
- Accelsius
- Chilldyne
- JETCOOL Technologies
- LiquidCool Solutions
- Midas Green Technologies
- Seguente
- ZutaCore
The Global Data Center Liquid Cooling Market was valued at USD 4.8 billion in 2025 and is estimated to grow at a CAGR of 18.2% to reach USD 27.1 billion by 2035.
Rising energy costs, coupled with stringent sustainability requirements, are accelerating the adoption of liquid cooling technologies across data centers. Liquid cooling systems offer significantly lower Power Usage Effectiveness (PUE) ratios ranging from 1.05 to 1.15 compared to 1.4-1.8 for traditional air-cooled facilities, which directly lowers electricity consumption and reduces carbon emissions. Regulatory mandates, including the EU Energy Efficiency Directive, Germany's Energy Efficiency Act targeting PUE 1.3 by 2027, and California's energy efficiency standards, are pushing operators toward advanced cooling solutions. Furthermore, the ability of liquid cooling systems to recover waste heat for district heating or industrial processes transforms data centers into contributors to circular energy economies, supporting corporate net-zero initiatives and enhancing operational sustainability. North America continues to lead the data center liquid cooling market, driven by a dense concentration of hyperscale cloud operators, semiconductor manufacturers, and systems integrators deploying high-density AI and HPC infrastructure.
| Market Scope | |
|---|---|
| Start Year | 2025 |
| Forecast Year | 2026-2035 |
| Start Value | $4.8 Billion |
| Forecast Value | $27.1 Billion |
| CAGR | 18.2% |
The solution segment held a 71% share in 2025 and is forecast to grow at a CAGR of 15% from 2026 to 2035. Direct-to-chip cooling is the fastest-growing technology, employing cold plates and micro-channel coolers attached directly to processors, GPUs, and memory to remove 60-80% of heat before it enters the air. These systems circulate coolants such as water with inhibitors or glycol mixtures across chip surfaces, achieving thermal resistances as low as 0.01-0.05°C/W.
The single-phase liquid cooling systems segment reached USD 3.1 billion in 2025. These systems maintain coolant in liquid form throughout the cycle, transferring heat via conduction and convection without phase change. Coolants circulate through cold plates, immersion tanks, or heat exchangers at 18-50°C, depending on design, while facility chillers, dry coolers, or towers remove heat from the loop.
U.S. Data Center Liquid Cooling Market captured USD 1.29 billion in 2025. Federal initiatives, including AI and HPC programs, semiconductor funding under the CHIPS Act, and defense modernization projects incorporating AI, are key drivers of liquid cooling adoption in public sector data centers.
Leading companies in the Data Center Liquid Cooling Market include Alfa Laval, Asetek, Boyd, CoolIT Systems, Green Revolution Cooling, LiquidStack, Rittal, Schneider Electric (Motivair), Stulz, and Vertiv. Key strategies adopted by companies in the Data Center Liquid Cooling Market focus on technological innovation, such as developing high-efficiency immersion and direct-to-chip cooling solutions for next-generation processors and GPUs. Firms are forming strategic partnerships with hyperscale cloud providers, semiconductor manufacturers, and HPC integrators to expand deployment. Investments in R&D for energy-efficient, modular, and scalable systems strengthen product differentiation. Companies are also emphasizing geographic expansion into emerging markets, supporting sustainability initiatives, and integrating IoT-enabled monitoring tools to optimize performance, enhance reliability, and maintain long-term client relationships.
Table of Contents
Chapter 1 Methodology & Scope
- 1.1 Market scope and definition
- 1.2 Research design
- 1.2.1 Research approach
- 1.2.2 Data collection methods
- 1.3 Data mining sources
- 1.3.1 Global
- 1.3.2 Regional/Country
- 1.4 Base estimates and calculations
- 1.4.1 Base year calculation
- 1.4.2 Key trends for market estimation
- 1.5 Primary research and validation
- 1.5.1 Primary sources
- 1.6 Forecast
- 1.7 Research assumptions and limitations
Chapter 2 Executive Summary
- 2.1 Industry 360° synopsis, 2022-2035
- 2.2 Key market trends
- 2.2.1 Regional
- 2.2.2 Component
- 2.2.3 Cooling mechanism
- 2.2.4 Coolant
- 2.2.5 Data center
- 2.2.6 Application
- 2.2.7 End use
- 2.3 TAM analysis, 2026-2035
- 2.4 CXO perspectives: Strategic imperatives
- 2.4.1 Key decision points for industry executives
- 2.4.2 Critical success factors for market players
- 2.5 Future outlook and strategic recommendations
Chapter 3 Industry Insights
- 3.1 Industry ecosystem analysis
- 3.1.1 Supplier landscape
- 3.1.1.1 Component suppliers
- 3.1.1.2 Manufacturers
- 3.1.1.3 System integrators
- 3.1.1.4 Distribution channel analysis
- 3.1.1.5 Cloud service providers
- 3.1.1.6 End user
- 3.1.2 Cost structure
- 3.1.3 Profit margin
- 3.1.4 Value addition at each stage
- 3.1.5 Factors impacting the supply chain
- 3.1.6 Disruptors
- 3.1.1 Supplier landscape
- 3.2 Impact on forces
- 3.2.1 Growth drivers
- 3.2.1.1 Exponential growth in AI and high-performance computing workloads
- 3.2.1.2 Increasing energy costs and sustainability mandates
- 3.2.1.3 Expansion of hyperscale and colocation data center infrastructure
- 3.2.1.4 Proliferation of edge computing and distributed architecture
- 3.2.2 Industry pitfalls & challenges
- 3.2.2.1 High initial capital investment and complexity
- 3.2.2.2 Technical risks and operational concerns
- 3.2.3 Market opportunities
- 3.2.3.1 Retrofit and modernization of existing data center facilities
- 3.2.3.2 Development of hybrid cooling architecture
- 3.2.3.3 Emergence of cooling-as-a-service and managed service models markets
- 3.2.1 Growth drivers
- 3.3 Growth potential analysis
- 3.4 Regulatory landscape
- 3.4.1 North America
- 3.4.1.1 U.S. Energy Policy Act (PUE Standards)
- 3.4.1.2 California Title 24 Energy Efficiency Regulations
- 3.4.1.3 NERC Critical Infrastructure Protection (Cooling Reliability)
- 3.4.2 Europe
- 3.4.2.1 EU Energy Efficiency Directive (EED)
- 3.4.2.2 German Energy Efficiency Act (PUE ≤1.3)
- 3.4.2.3 UK Energy-related Products Policy Framework
- 3.4.2.4 Climate Neutral Data Centre Pact
- 3.4.2.5 French Data Center Energy Reporting Decree
- 3.4.3 Asia Pacific
- 3.4.3.1 China GB 50174 PUE Standards (≤1.3 Mandate)
- 3.4.3.2 India Digital India Efficiency Guidelines
- 3.4.3.3 Singapore Green Data Centre Roadmap
- 3.4.3.4 Japan Seismic Cooling Standards
- 3.4.3.5 Australia Data Centre Energy Regulations
- 3.4.4 Latin America
- 3.4.4.1 Brazil ANATEL Energy Efficiency Norms
- 3.4.4.2 Mexico Data Center Sustainability Guidelines
- 3.4.4.3 Chile Green Data Center Incentives
- 3.4.5 Middle East & Africa
- 3.4.5.1 UAE Green Agenda 2030
- 3.4.5.2 Saudi Arabia Vision Data Efficiency 2030
- 3.4.5.3 South Africa Critical Infrastructure Regulations
- 3.4.1 North America
- 3.5 Porter';s analysis
- 3.6 PESTEL analysis
- 3.7 Technology and innovation landscape
- 3.7.1 Current technological trends
- 3.7.2 Emerging technologies
- 3.8 Cost breakdown analysis
- 3.8.1 Cost per kW cooled across rack density tiers
- 3.8.2 Greenfield vs retrofit cost delta
- 3.8.3 Total Cost of Ownership (TCO)
- 3.9 Patent analysis
- 3.10 Case studies
- 3.11 Sustainability and environmental aspects
- 3.11.1 Sustainable practices
- 3.11.2 Waste reduction strategies
- 3.11.3 Energy efficiency in production
- 3.11.4 Eco-friendly initiatives
- 3.11.5 Carbon footprint considerations
- 3.12 Architecture analysis
- 3.12.1 Direct to chip liquid cooling
- 3.12.2 Immersive cooling
- 3.13 Analysis of shift from air cooling to liquid cooling
- 3.14 Power density trends in data centers
- 3.14.1 Increasing demands for high-performance computing
- 3.14.2 Acceleration of edge computing
- 3.14.3 Advanced cooling technologies
- 3.14.4 Optimization of space
- 3.14.5 Customized workload solutions
- 3.15 Relationship and partnership build-out
- 3.15.1 Strategic integration partnership models
- 3.15.1.1 Joint engineering services
- 3.15.1.2 Co-development of integration standards
- 3.15.1.3 Co-bidding for hyperscale dc projects
- 3.15.2 Pilot deployment collaboration opportunities
- 3.15.2.1 Demonstration projects with hyperscalers
- 3.15.2.2 Strategic adoption in enterprise retrofits
- 3.15.1 Strategic integration partnership models
- 3.16 Integration with existing infrastructure & efficiency optimization
- 3.16.1 Integration strategies
- 3.16.1.1 Retrofit pathways
- 3.16.1.2 Direct-to-chip implementation with existing chilled water
- 3.16.1.3 Rear-door heat exchanger drop-in retrofits
- 3.16.1.4 Immersion pod modular addition
- 3.16.2 Hybrid integration
- 3.16.2.1 Air cooling + liquid cooling zones
- 3.16.2.2 Partial rack liquid assist (GPU racks)
- 3.16.3 Greenfield adaptation
- 3.16.3.1 Design-to-integrate with existing systems if part of campus
- 3.16.3.2 Secondary loop for isolated liquid cooling
- 3.16.4 Efficiency optimization approaches
- 3.16.4.1 Thermal efficiency
- 3.16.4.2 Rack-level heat removal optimization
- 3.16.4.3 Hot/cold aisle containment integration
- 3.16.4.4 Minimizing recirculation and bypass airflow
- 3.16.1 Integration strategies
Chapter 4 Competitive Landscape, 2025
- 4.1 Introduction
- 4.2 Company market share analysis
- 4.2.1 North America
- 4.2.2 Europe
- 4.2.3 Asia Pacific
- 4.2.4 LATAM
- 4.2.5 MEA
- 4.3 Competitive analysis of major market players
- 4.4 Competitive positioning matrix
- 4.5 Strategic outlook matrix
- 4.6 Key developments
- 4.6.1 Mergers & acquisitions
- 4.6.2 Partnerships & collaborations
- 4.6.3 New product launches
- 4.6.4 Expansion plans and funding
- 4.7 Integration & retrofit benchmarking
- 4.7.1 Time-to-deploy liquid cooling in existing racks
- 4.7.2 Downtime impact during retrofits
- 4.7.3 Compatibility with existing CRAH/CRAC or in-row units
- 4.7.4 Operational complexity scaling
Chapter 5 Market Estimates & Forecast, By Component, 2022 - 2035 ($Bn)
- 5.1 Key trends
- 5.2 Solution
- 5.2.1 Direct to chip
- 5.2.1.1 Cold plates
- 5.2.1.2 Micro-channel coolers
- 5.2.2 Immersive
- 5.2.2.1 IT chassis
- 5.2.2.2 Tub/Open bath
- 5.2.3 Rear-door heat exchangers
- 5.2.3.1 Active (pumped)
- 5.2.3.2 Passive
- 5.2.1 Direct to chip
- 5.3 Service
- 5.3.1 Managed service
- 5.3.1.1 Remote monitoring
- 5.3.1.2 Performance optimization
- 5.3.1.3 Maintenance & support services
- 5.3.2 Professional service
- 5.3.2.1 Consultation & design
- 5.3.2.2 Installation & deployment
- 5.3.1 Managed service
Chapter 6 Market Estimates & Forecast, By Cooling Mechanism, 2022 - 2035 ($Bn)
- 6.1 Key trends
- 6.2 Single-phase liquid cooling
- 6.3 Two-phase liquid cooling
Chapter 7 Market Estimates & Forecast, By Coolant, 2022 - 2035 ($Bn)
- 7.1 Key trends
- 7.2 Water-based coolants
- 7.3 Dielectric fluids
- 7.4 Synthetic fluids
- 7.5 Mineral oils
- 7.6 Bio-based/Natural coolants
Chapter 8 Market Estimates & Forecast, By Data Center, 2022 - 2035 ($Bn)
- 8.1 Key trends
- 8.2 Small data centers
- 8.3 Medium data centers
- 8.4 Large data centers
Chapter 9 Market Estimates & Forecast, By Application, 2022 - 2035 ($Bn)
- 9.1 Key trends
- 9.2 Server cooling
- 9.2.1 CPU cooling
- 9.2.2 GPU/AI accelerator cooling
- 9.3 Storage cooling
- 9.4 Networking cooling
- 9.5 Others
Chapter 10 Market Estimates & Forecast, By End Use, 2022 - 2035 ($Bn)
- 10.1 Key trends
- 10.2 Enterprise
- 10.2.1 BFSI
- 10.2.2 Retail & e-commerce
- 10.2.3 Government
- 10.2.4 Healthcare
- 10.2.5 Manufacturing
- 10.2.6 IT enabled services (ITeS)
- 10.2.7 Others
- 10.3 Telecom service provider
- 10.4 Cloud service provider
Chapter 11 Market Estimates & Forecast, By Region, 2022 - 2035 ($Bn)
- 11.1 Key trends
- 11.2 North America
- 11.2.1 US
- 11.2.2 Canada
- 11.2.3 Mexico
- 11.3 Europe
- 11.3.1 UK
- 11.3.2 Germany
- 11.3.3 France
- 11.3.4 Italy
- 11.3.5 Spain
- 11.3.6 Poland
- 11.3.7 Benelux
- 11.4 Asia Pacific
- 11.4.1 China
- 11.4.2 India
- 11.4.3 Japan
- 11.4.4 Australia
- 11.4.5 South Korea
- 11.4.6 Southeast Asia
- 11.5 Latin America
- 11.5.1 Brazil
- 11.5.2 Colombia
- 11.5.3 Argentina
- 11.5.4 Chile
- 11.6 MEA
- 11.6.1 South Africa
- 11.6.2 Saudi Arabia
- 11.6.3 UAE
Chapter 12 Company Profiles
- 12.1 Global leaders
- 12.1.1 Alfa Laval
- 12.1.2 Asetek
- 12.1.3 Boyd
- 12.1.4 CoolIT Systems
- 12.1.5 Green Revolution Cooling (GRC)
- 12.1.6 LiquidStack
- 12.1.7 Rittal
- 12.1.8 Schneider Electric
- 12.1.9 Stulz
- 12.1.10 Vertiv
- 12.2 Regional players
- 12.2.1 Asperitas
- 12.2.2 DCX Liquid Cooling Systems
- 12.2.3 Delta Electronics
- 12.2.4 DUG Technology
- 12.2.5 Iceotope Technologies
- 12.2.6 Kaori Heat Treatment
- 12.2.7 Submer Technologies
- 12.3 Emerging players
- 12.3.1 Accelsius
- 12.3.2 Chilldyne
- 12.3.3 JETCOOL Technologies
- 12.3.4 LiquidCool Solutions
- 12.3.5 Midas Green Technologies
- 12.3.6 Seguente
- 12.3.7 ZutaCore
 資料中心液冷市場分析及預測(至2035年):類型、產品、服務、技術、組件、應用、材料類型、部署模式、最終用戶、解決方案
 資料中心自主液冷系統市場:依產品、類型、資料中心類型、最終用途及部署方式分類,全球預測(2026-2032年)
 全球資料中心冷卻液市場(至2032年):依液體類型(水-乙二醇混合物、合成烴、氟基冷卻液)、冷卻方式(單相冷卻、兩相冷卻)、資料中心類型、冷卻技術與區域分類
 資料中心液冷:市場佔有率分析、產業趨勢與統計、成長預測(2026-2031)
 資料中心液冷市場規模、佔有率和趨勢分析:按組件、冷卻方式、資料中心、最終用途、地區和細分市場預測(2026-2033 年)
 2026年全球資料中心液冷市場報告液冷資料中心基礎設施產品市場(按組件、冷卻技術、流速類型、流體類型、部署類型、機架密度和最終用戶分類)-2026-2032年全球預測資料中心液冷設備市場按技術類型、冷卻介質、容量範圍、應用和最終用戶產業分類,全球預測(2026-2032年)
 全球資料中心液冷市場評估:按組件、規模、類型、終端用戶產業、地區、機會和預測(2018-2032 年)
 資料中心液冷市場規模、佔有率及成長分析(按產品、資料中心類型、資料中心規模、冷卻模式、基礎設施、應用、分銷通路和地區分類)-2026-2033年產業預測