


 |
市場調查報告書
商品編碼
1928908
過氧乙酸市場機會、成長要素、產業趨勢分析及2026年至2035年預測Peracetic Acid Market Opportunity, Growth Drivers, Industry Trend Analysis, and Forecast 2026 - 2035 |
||||||
全球過氧乙酸市場預計到 2025 年將達到 10 億美元,到 2035 年將達到 22 億美元,年複合成長率為 7.4%。
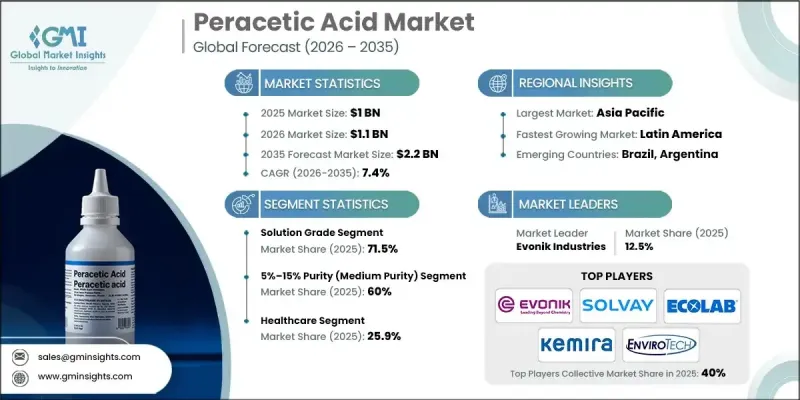
這一成長得益於對環保消毒劑日益成長的需求,以及食品安全和衛生法規執行的加強,尤其是在開發中國家。監管機構正在收緊污水處理和工業污水的要求,加速了其在市政和工業領域的應用。人們越來越關注傳統消毒劑對健康和環境的影響,特別是那些會產生有害殘留副產物的消毒劑,這使得過氧乙酸成為首選。其高效性、生物分解性和與法規結構的兼容性,正在鞏固其在多個終端應用領域的地位。在醫療保健領域,感染預防仍然是重中之重,這推動了過氧乙酸在滅菌和衛生流程中的廣泛應用,從而維持了穩定的需求。這些因素共同促進了過氧乙酸的長期成長,並擴大了其在全球的應用範圍。
| 市場覆蓋範圍 | |
|---|---|
| 開始年份 | 2025 |
| 預測年份 | 2026-2035 |
| 起始值 | 10億美元 |
| 預測金額 | 22億美元 |
| 複合年成長率 | 7.4% |
溶液級過氧乙酸市佔率佔比高達71.5%,預計到2035年將以7.2%的複合年成長率成長。該級別產品憑藉其在衛生、醫療保健和工業消毒等廣泛應用領域的兼容性,保持著主導地位。即用型配方有助於快速實施並簡化操作流程,因此溶液級產品的需求持續成長。
預計到 2025 年,純度為 5-15% 的產品將佔市場佔有率的 60%,到 2035 年將以 7.1% 的複合年成長率成長。此純度等級被廣泛採用,因為它在抗菌性能、法規合規性和安全操作特性方面實現了有效平衡,使其適用於各種衛生和消毒應用。
到 2025 年,北美過氧乙酸市場將佔 30.1% 的佔有率。不斷發展的法規結構,尤其注重對已批准的消毒劑和殘留水平的控制,尤其是在食品加工、醫療保健和工業衛生領域,正在支持該地區的成長。
目錄
第1章調查方法和範圍
第2章執行摘要
第3章業界考察
- 生態系分析
- 供應商情況
- 利潤率
- 每個階段的附加價值
- 影響價值鏈的因素
- 中斷
- 產業影響因素
- 促進要素
- 產業潛在風險與挑戰
- 市場機遇
- 成長潛力分析
- 監管環境
- 北美洲
- 歐洲
- 亞太地區
- 拉丁美洲
- 中東和非洲
- 波特分析
- PESTEL 分析
- 價格趨勢
- 按地區
- 依產品類型
- 未來市場趨勢
- 科技與創新趨勢
- 當前技術趨勢
- 新興技術
- 專利狀態
- 貿易統計(HS編碼)(註:僅提供主要國家的貿易統計)
- 主要進口國
- 主要出口國
- 永續性和環境方面
- 永續努力
- 減少廢棄物策略
- 生產中的能源效率
- 環保舉措
- 考慮到碳足跡
第4章 競爭情勢
- 介紹
- 公司市佔率分析
- 按地區
- 北美洲
- 歐洲
- 亞太地區
- 拉丁美洲
- 中東和非洲
- 按地區
- 企業矩陣分析
- 主要市場公司的競爭分析
- 競爭定位矩陣
- 重大進展
- 併購
- 夥伴關係與合作
- 新產品發布
- 業務拓展計劃
第5章 依產品類型分類的市場估算與預測,2022-2035年
- 溶液級
- 蒸餾級
- 其他
6. 按純度分類的市場估計與預測,2022-2035 年
- 純度低於5%(低純度)
- 純度5%至15%(中等純度)
- 高純度(超過15%)
7. 2022-2035年按最終用途產業分類的市場估算與預測
- 衛生保健
- 醫院表面消毒
- 手術器械的消毒
- 透析設備的消毒
- 製藥無塵室衛生管理
- 食品/飲料加工
- 肉類/家禽加工
- 飲水衛生管理
- 乳製品設備清潔
- 蔬果清洗
- 水處理
- 水處理
- 污水處理
- 工業水處理
- 水產養殖水處理
- 紙漿和造紙
- 紙漿漂白
- 消毒紙機系統
- 再生纖維加工
- 使用 Slimside 和除臭劑
- 農業
- 採後農產品消毒
- 牲畜棚衛生管理
- 灌溉水處理
- 農業設備消毒
- 製藥
- API合成
- 無塵室表面衛生管理
- 製藥設備滅菌
- 包裝設備消毒
- 化學過程
- 氧化劑
- 聚合催化劑
- 有機合成中間體
- 污水消毒
- 石油化學/石油和天然氣
- 煉油廠污水消毒
- 管道污泥和生物膜清除
- 脫硫工藝
- 冷卻水系統處理
第8章 2022-2035年各地區市場估算與預測
- 北美洲
- 美國
- 加拿大
- 歐洲
- 德國
- 英國
- 法國
- 西班牙
- 義大利
- 其他歐洲地區
- 亞太地區
- 中國
- 印度
- 日本
- 澳洲
- 韓國
- 亞太其他地區
- 拉丁美洲
- 巴西
- 墨西哥
- 阿根廷
- 其他拉丁美洲地區
- 中東和非洲
- 沙烏地阿拉伯
- 南非
- 阿拉伯聯合大公國
- 其他中東和非洲地區
第9章:公司簡介
- Acuro Organics Limited
- Airedale Chemical
- Biosan LLC
- Christeyns
- Diversey Holdings
- Ecolab
- Enviro Tech Chemical Services
- Evonik Industries
- FMC Corporation
- Hydrite Chemical Co.
- Kemira
- Loeffler Chemical Corporation
- Mitsubishi Gas Chemical Company
- National Peroxide Limited
- SEITZ GmbH
- Solvay
- Sopura SA
- Spartan Chemical Company, Inc.
- Others
The Global Peracetic Acid Market was valued at USD 1 billion in 2025 and is estimated to grow at a CAGR of 7.4% to reach USD 2.2 billion by 2035.
Growth is supported by rising demand for environmentally responsible disinfectants and increasing enforcement of food safety and sanitation regulations, particularly in developing economies. Regulatory bodies are tightening requirements around wastewater treatment and industrial discharge, which is accelerating adoption across municipal and industrial applications. Peracetic acid is gaining preference as concerns rise over the health and environmental impact of conventional disinfectants, especially those associated with harmful residual byproducts. Its effectiveness, biodegradability, and compatibility with regulatory frameworks are strengthening its position across multiple end-use sectors. The healthcare sector continues to demonstrate consistent demand as infection prevention remains a priority, encouraging wider use of peracetic acid in sterilization and sanitation processes. Together, these factors are reinforcing long-term growth and expanding the application scope of peracetic acid globally.
| Market Scope | |
|---|---|
| Start Year | 2025 |
| Forecast Year | 2026-2035 |
| Start Value | $1 Billion |
| Forecast Value | $2.2 Billion |
| CAGR | 7.4% |
The solution-grade peracetic acid segment held 71.5% share and is expected to grow at a CAGR of 7.2% through 2035. This grade maintains its leading position due to its broad end-use compatibility across sanitation, healthcare, and industrial disinfection. Ready-to-use formulations support rapid deployment and simplify operational processes, which continues to drive preference for solution-grade products.
The 5%-15% purity range accounted for 60% share in 2025 and is forecast to grow at a CAGR of 7.1% by 2035. This purity level is widely adopted because it offers an effective balance between antimicrobial performance, regulatory compliance, and safe handling characteristics, making it suitable for a wide range of sanitation and disinfection applications.
North America Peracetic Acid Market held 30.1% share in 2025. Regional growth is supported by evolving regulatory frameworks that emphasize approved disinfectants and controlled residual levels, particularly across food processing, healthcare, and industrial sanitation operations.
Key companies operating in the Global Peracetic Acid Market include Solvay, Evonik Industries, Ecolab, Kemira, FMC Corporation, Diversey Holdings, Mitsubishi Gas Chemical Company, Hydrite Chemical Co., Enviro Tech Chemical Services, Spartan Chemical Company, Inc., Christeyns, Sopura S.A., Biosan LLC, Airedale Chemical, Acuro Organics Limited, Loeffler Chemical Corporation, National Peroxide Limited, and SEITZ GmbH. Companies in the Global Peracetic Acid Market are strengthening their competitive positions through capacity expansion, product optimization, and regulatory alignment. Manufacturers are investing in formulation improvements to enhance stability, safety, and application efficiency. Strategic focus on environmentally friendly and low-residue solutions is helping companies align with tightening regulations. Firms are expanding distribution networks and forming partnerships with industrial and municipal clients to secure long-term supply agreements.
Table of Contents
Chapter 1 Methodology & Scope
- 1.1 Market scope and definition
- 1.2 Research design
- 1.2.1 Research approach
- 1.2.2 Data collection methods
- 1.3 Data mining sources
- 1.3.1 Global
- 1.3.2 Regional/Country
- 1.4 Base estimates and calculations
- 1.4.1 Base year calculation
- 1.4.2 Key trends for market estimation
- 1.5 Primary research and validation
- 1.5.1 Primary sources
- 1.6 Forecast model
- 1.7 Research assumptions and limitations
Chapter 2 Executive Summary
- 2.1 Industry 360° synopsis
- 2.2 Key market trends
- 2.2.1 Regional
- 2.2.2 Product type
- 2.2.3 Purity
- 2.2.4 End Use industry
- 2.3 TAM Analysis, 2026-2035
- 2.4 CXO perspectives: Strategic imperatives
- 2.4.1 Executive decision points
- 2.4.2 Critical success factors
- 2.5 Future Outlook and Strategic Recommendations
Chapter 3 Industry Insights
- 3.1 Industry ecosystem analysis
- 3.1.1 Supplier landscape
- 3.1.2 Profit margin
- 3.1.3 Value addition at each stage
- 3.1.4 Factor affecting the value chain
- 3.1.5 Disruptions
- 3.2 Industry impact forces
- 3.2.1 Growth drivers
- 3.2.2 Industry pitfalls and challenges
- 3.2.3 Market opportunities
- 3.3 Growth potential analysis
- 3.4 Regulatory landscape
- 3.4.1 North America
- 3.4.2 Europe
- 3.4.3 Asia Pacific
- 3.4.4 Latin America
- 3.4.5 Middle East & Africa
- 3.5 Porter';s analysis
- 3.6 PESTEL analysis
- 3.7 Price trends
- 3.7.1 By region
- 3.7.2 By Product type
- 3.8 Future market trends
- 3.9 Technology and Innovation landscape
- 3.9.1 Current technological trends
- 3.9.2 Emerging technologies
- 3.10 Patent Landscape
- 3.11 Trade statistics (HS code) ( Note: the trade statistics will be provided for key countries only)
- 3.11.1 Major importing countries
- 3.11.2 Major exporting countries
- 3.12 Sustainability and environmental aspects
- 3.12.1 Sustainable practices
- 3.12.2 Waste reduction strategies
- 3.12.3 Energy efficiency in production
- 3.12.4 Eco-friendly initiatives
- 3.13 Carbon footprint consideration
Chapter 4 Competitive Landscape, 2025
- 4.1 Introduction
- 4.2 Company market share analysis
- 4.2.1 By region
- 4.2.1.1 North America
- 4.2.1.2 Europe
- 4.2.1.3 Asia Pacific
- 4.2.1.4 LATAM
- 4.2.1.5 MEA
- 4.2.1 By region
- 4.3 Company matrix analysis
- 4.4 Competitive analysis of major market players
- 4.5 Competitive positioning matrix
- 4.6 Key developments
- 4.6.1 Mergers & acquisitions
- 4.6.2 Partnerships & collaborations
- 4.6.3 New Product Launches
- 4.6.4 Expansion Plans
Chapter 5 Market Estimates and Forecast, By Product Type, 2022-2035 (USD Million) (Kilo Tons)
- 5.1 Key trends
- 5.2 Solution grade
- 5.3 Distilled grade
- 5.4 Others
Chapter 6 Market Estimates and Forecast, By Purity, 2022-2035 (USD Million) (Kilo Tons)
- 6.1 Key trends
- 6.2 <5% Purity (Low Purity)
- 6.3 5%-15% Purity (Medium Purity)
- 6.4 >15% Purity (High Purity)
Chapter 7 Market Estimates and Forecast, By End Use Industry, 2022-2035 (USD Million) (Kilo Tons)
- 7.1 Key trends
- 7.2 Healthcare
- 7.2.1 Hospital Surface Disinfection
- 7.2.2 Surgical Instrument Sterilization
- 7.2.3 Dialysis Equipment Disinfection
- 7.2.4 Pharmaceutical Clean Room Sanitation
- 7.3 Food & Beverage Processing
- 7.3.1 Meat and Poultry Processing
- 7.3.2 Beverage Sanitation
- 7.3.3 Dairy Equipment Cleaning
- 7.3.4 Fruit & Vegetable Washing
- 7.4 Water Treatment
- 7.4.1 Municipal Water Treatment
- 7.4.2 Wastewater Treatment
- 7.4.3 Industrial Water Treatment
- 7.4.4 Aquaculture Water Treatment
- 7.5 Pulp & Paper
- 7.5.1 Pulp Bleaching
- 7.5.2 Paper Machine System Disinfection
- 7.5.3 Recycled Fiber Treatment
- 7.5.4 Slimicide & Deodorizing Agent Use
- 7.6 Agriculture
- 7.6.1 Post-Harvest Produce Disinfection
- 7.6.2 Animal Housing Sanitation
- 7.6.3 Irrigation Water Treatment
- 7.6.4 Agricultural Equipment Disinfection
- 7.7 Pharmaceuticals
- 7.7.1 API Synthesis
- 7.7.2 Cleanroom Surface Sanitation
- 7.7.3 Pharma Equipment Sterilization
- 7.7.4 Packaging Equipment Disinfection
- 7.8 Chemical Processing
- 7.8.1 Oxidizing Agent
- 7.8.2 Polymerization Catalyst
- 7.8.3 Organic Synthesis Intermediate
- 7.8.4 Wastewater Disinfection
- 7.9 Petrochemical / Oil & Gas
- 7.9.1 Refinery Wastewater Disinfection
- 7.9.2 Pipeline Sludge & Biofilm Removal
- 7.9.3 Desulfurization Processes
- 7.9.4 Cooling Water System Treatment
Chapter 8 Market Estimates and Forecast, By Region, 2022-2035 (USD Million) (Kilo Tons)
- 8.1 Key trends
- 8.2 North America
- 8.2.1 U.S.
- 8.2.2 Canada
- 8.3 Europe
- 8.3.1 Germany
- 8.3.2 UK
- 8.3.3 France
- 8.3.4 Spain
- 8.3.5 Italy
- 8.3.6 Rest of Europe
- 8.4 Asia Pacific
- 8.4.1 China
- 8.4.2 India
- 8.4.3 Japan
- 8.4.4 Australia
- 8.4.5 South Korea
- 8.4.6 Rest of Asia Pacific
- 8.5 Latin America
- 8.5.1 Brazil
- 8.5.2 Mexico
- 8.5.3 Argentina
- 8.5.4 Rest of Latin America
- 8.6 Middle East and Africa
- 8.6.1 Saudi Arabia
- 8.6.2 South Africa
- 8.6.3 UAE
- 8.6.4 Rest of Middle East and Africa
Chapter 9 Company Profiles
- 9.1 Acuro Organics Limited
- 9.2 Airedale Chemical
- 9.3 Biosan LLC
- 9.4 Christeyns
- 9.5 Diversey Holdings
- 9.6 Ecolab
- 9.7 Enviro Tech Chemical Services
- 9.8 Evonik Industries
- 9.9 FMC Corporation
- 9.10 Hydrite Chemical Co.
- 9.11 Kemira
- 9.12 Loeffler Chemical Corporation
- 9.13 Mitsubishi Gas Chemical Company
- 9.14 National Peroxide Limited
- 9.15 SEITZ GmbH
- 9.16 Solvay
- 9.17 Sopura S.A.
- 9.18 Spartan Chemical Company, Inc.
- 9.19 Others
 過氧乙酸市場:市場規模、佔有率和趨勢分析(按等級、應用、最終用途和地區分類),細分市場預測(2026-2033 年)
 過氧乙酸市場:全球市場按等級、形態、濃度、包裝、應用和分銷管道分類的預測-2026-2032年
 全球過氧乙酸市場規模、佔有率、趨勢和成長分析報告(2026-2034年)
 過氧乙酸市場:依等級、應用、最終用戶和地區分類
 過氧乙酸市場分析及預測(至2035年):類型、產品、應用、終端用戶、形態、技術、製程、材料類型、功能、設備
 過氧乙酸市場報告:依等級、應用、終端用戶產業及地區分類(2026-2034年)
 2026年過氧乙酸全球市場報告
 過氧乙酸市場 - 全球產業規模、佔有率、趨勢、機會及預測(按等級、應用、最終用途產業、地區和競爭格局分類,2021-2031年)日本過氧乙酸市場報告:依等級、應用、終端用戶產業及地區分類(2026-2034年)
 過氧乙酸市場規模、佔有率及成長分析(按等級、應用、最終用途及地區分類)-2026-2033年產業預測