

 |
市場調查報告書
商品編碼
1928876
家用電子電器產品用高壓電容器市場:機會、成長要素、產業趨勢分析及2026年至2035年預測Consumer Electronics High Voltage Electric Capacitor Market Opportunity, Growth Drivers, Industry Trend Analysis, and Forecast 2026 - 2035 |
||||||
全球家用電子電器用高壓電容器市場預計到 2025 年將達到 9.3 億美元,到 2035 年將達到 16 億美元,年複合成長率為 6%。
這種成長是由現代家用電子電器日益成長的功率需求以及向更高電壓電源架構的加速過渡所驅動的。高功率 USB-C 快速充電標準的廣泛應用,推動電源設計向更高電壓水平發展,同時保持緊湊的尺寸和散熱效率。向更先進的 USB Power Delivery 規範的過渡引入了 28V、36V 和 48V 的固定電壓軌,以及高達 240W 的可編程功率輸出,這對功率級組件提出了更高的性能要求。隨著設備製造商將介面整合到 USB-C 平台,安全合規性、全球互通性和一致的電氣性能變得越來越重要。這種環境需要可靠、標準化且具有高電氣穩定性的高壓電容器。小型化趨勢,加上電壓和電容密度的提高,進一步強化了這項需求。為了提高效率和縮小組件尺寸,電源轉換級在更高的開關頻率和總線電壓下運作。這就需要能夠在緊湊的面積內提供高電壓額定值、耐熱性和穩定介電性能的電容器。
| 市場覆蓋範圍 | |
|---|---|
| 開始年份 | 2025 |
| 預測年份 | 2026-2035 |
| 起始值 | 9.3億美元 |
| 預測金額 | 16億美元 |
| 複合年成長率 | 6% |
預計到 2025 年,非極化電容器市佔率將達到 84.7%,到 2035 年將以 5.9% 的複合年成長率成長。介電材料和多層結構的進步不斷推動非極化設計的應用,尤其是在家用電子電器的電源電路中,這些電路需要高壓能力、可靠性和緊湊的尺寸。
預計到2035年,薄膜電容器市場將以5.9%的複合年成長率成長。由於其使用壽命長、在高電壓下效率高,因此在消費性電子應用領域的需求仍然強勁。在產品性能對耐用性、電壓穩定性和耐熱性要求較高的應用中,薄膜電容器越來越受到青睞。
預計到2025年,美國消費性電子產品用高壓電容器市場規模將達6.5億美元,佔市場佔有率的75%。對更新安全標準的日益重視以及混合能源解決方案的日益普及,持續推動消費電力系統用電容器品質要求的提高。住宅環境中混合逆變器和備用電源解決方案的日益普及,也增強了先進電力電子應用中對高可靠性電容器的需求。
目錄
第1章調查方法和範圍
第2章執行摘要
第3章業界考察
- 生態系分析
- 監管環境
- 產業影響因素
- 促進要素
- 產業潛在風險與挑戰
- 成長潛力分析
- 波特分析
- 供應商的議價能力
- 買方的議價能力
- 新進入者的威脅
- 替代品的威脅
- PESTEL 分析
- 新的機會與趨勢
- 數位化和物聯網整合
- 拓展新興市場
第4章 競爭情勢
- 介紹
- 公司市佔率分析
- 策略舉措
- 競爭標竿分析
- 戰略儀錶板
- 創新與科技趨勢
第5章 依極化程度分類的市場規模及預測(2022-2035年)
- 偏振
- 非極化
第6章 依材料分類的市場規模及預測(2022-2035年)
- 薄膜電容器
- 陶瓷電容器
- 電解電容器
- 其他
第7章 2022-2035年各地區市場規模及預測
- 北美洲
- 美國
- 加拿大
- 墨西哥
- 歐洲
- 英國
- 法國
- 德國
- 義大利
- 奧地利
- 亞太地區
- 中國
- 印度
- 日本
- 澳洲
- 韓國
- 中東和非洲
- 沙烏地阿拉伯
- 南非
- 阿拉伯聯合大公國
- 拉丁美洲
- 巴西
- 阿根廷
- 智利
第8章 公司簡介
- ABB
- CapXon International Electronic Co., Ltd.
- Cornell Dubilier Electronics
- ELNA Co., Ltd.
- Havells India Ltd.
- JB電容器
- KEMET Corporation
- KYOCERA AVX Components Corporation
- Murata Manufacturing Co., Ltd.
- Nichicon Corporation
- Panasonic Corporation
- Rubycon Corporation
- Samsung Electro-Mechanics Co., Ltd.
- Schneider Electric
- Siemens
- Taiyo Yuden Co., Ltd.
- TDK Corporation
- Vishay Intertechnology, Inc.
- WIMA GmbH &Co. KG
- Xuansn Electronic
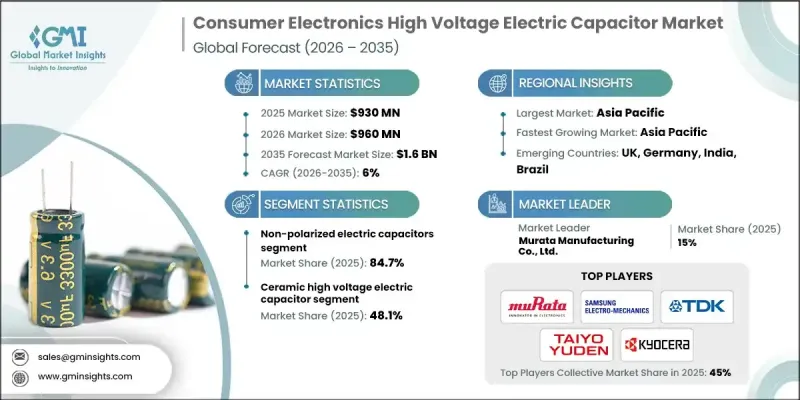
The Global Consumer Electronics High Voltage Electric Capacitor Market was valued at USD 930 million in 2025 and is estimated to grow at a CAGR of 6% to reach USD 1.6 billion by 2035.
Growth is driven by rising power requirements across modern consumer electronics and the accelerating shift toward higher-voltage power architectures. Widespread adoption of higher-wattage USB-C fast-charging standards is pushing power designs toward elevated voltage levels while maintaining compact form factors and thermal efficiency. The transition to advanced USB Power Delivery specifications introduces fixed voltage rails at 28 V, 36 V, and 48 V, along with programmable power delivery up to 240 W, which places greater performance demands on power stage components. As device manufacturers consolidate interfaces around USB-C, emphasis increases on safety compliance, global interoperability, and consistent electrical behavior. This environment favors reliable, standardized high-voltage capacitors with strong electrical stability. Miniaturization trends, coupled with increasing voltage and capacitance density, further strengthen demand. Power conversion stages operate at higher switching frequencies and bus voltages to improve efficiency and reduce component size, requiring capacitors that deliver high voltage ratings, thermal resilience, and stable dielectric performance within compact footprints.
| Market Scope | |
|---|---|
| Start Year | 2025 |
| Forecast Year | 2026-2035 |
| Start Value | $930 Million |
| Forecast Value | $1.6 Billion |
| CAGR | 6% |
The non-polarized electric capacitors segment accounted for 84.7% share in 2025 and is expected to grow at a CAGR of 5.9% through 2035. Advances in dielectric materials and multilayer construction continue to support the adoption of non-polarized designs, particularly where high voltage capability, reliability, and compact size are required in consumer electronics power circuits.
The film capacitors segment is projected to grow at a CAGR of 5.9% through 2035. Demand remains strong in consumer applications that combine long operational life with high efficiency at elevated voltages. These components are increasingly favored where durability, voltage stability, and thermal endurance are critical to product performance.
United States Consumer Electronics High Voltage Electric Capacitor Market held 75% share in 2025 and generated USD 650 million. Rising emphasis on updated safety standards and growing adoption of hybrid energy solutions continue to elevate quality requirements for capacitors used in consumer power systems. Increased deployment of hybrid inverters and backup-ready solutions in residential settings strengthens demand for robust capacitors within advanced power electronics.
Key companies active in the Consumer Electronics High Voltage Electric Capacitor Market include Murata Manufacturing Co., Ltd., TDK Corporation, Panasonic Corporation, KEMET Corporation, Vishay Intertechnology, Inc., Samsung Electro Mechanics Co., Ltd., Nichicon Corporation, Taiyo Yuden Co., Ltd., Rubycon Corporation, ABB, Schneider Electric, Siemens, Cornell Dubilier Electronics, KYOCERA AVX Components Corporation, ELNA Co., Ltd., WIMA GmbH & Co. KG, CapXon International Electronic Co., Ltd., Havells India Ltd., JB Capacitors Company, Xuansn Electronic, and Panasonic Corporation. Companies operating in the Consumer Electronics High Voltage Electric Capacitor Market strengthen their market position through continuous material innovation and capacity expansion. Investment in advanced dielectric technologies enables higher voltage tolerance and improved thermal stability in compact designs. Manufacturers focus on standardization and certification to meet evolving global safety and interoperability requirements. Strategic partnerships with device makers help align product development with next-generation power architectures.
Table of Contents
Chapter 1 Methodology & Scope
- 1.1 Research approach
- 1.2 Quality commitment
- 1.2.1 GMI AI policy & data integrity commitment
- 1.2.1.1 Source consistency protocol
- 1.2.1 GMI AI policy & data integrity commitment
- 1.3 Research Trail & Confidence Scoring
- 1.3.1 Research Trail Components
- 1.3.2 Scoring Components
- 1.4 Data Collection
- 1.4.1 Partial list of primary sources
- 1.5 Data mining sources
- 1.5.1 Paid sources
- 1.5.1.1 Sources, by region
- 1.5.1 Paid sources
- 1.6 Base estimates and calculations
- 1.6.1 Base year calculation for any one approach
- 1.7 Forecast model
- 1.8 Research transparency addendum
- 1.8.1 Source attribution framework
- 1.8.2 Quality assurance metrics
- 1.8.3 Our commitment to trust
- 1.9 Market definitions
Chapter 2 Executive Summary
- 2.1 Industry synopsis, 2022 - 2035
- 2.1.1 Business trends
- 2.1.2 Polarization trends
- 2.1.3 Material trends
- 2.1.4 Regional trends
Chapter 3 Industry Insights
- 3.1 Industry ecosystem analysis
- 3.2 Regulatory landscape
- 3.3 Industry impact forces
- 3.3.1 Growth drivers
- 3.3.2 Industry pitfalls & challenges
- 3.4 Growth potential analysis
- 3.5 Porter';s analysis
- 3.5.1 Bargaining power of suppliers
- 3.5.2 Bargaining power of buyers
- 3.5.3 Threat of new entrants
- 3.5.4 Threat of substitutes
- 3.6 PESTEL analysis
- 3.6.1 Political factors
- 3.6.2 Economic factors
- 3.6.3 Social factors
- 3.6.4 Technology factors
- 3.6.5 environmental factors
- 3.6.6 Legal factors
- 3.7 Emerging opportunities & trends
- 3.7.1 Digitalization and IoT integration
- 3.7.2 Emerging market penetration
Chapter 4 Competitive landscape, 2025
- 4.1 Introduction
- 4.2 Company market share analysis, 2024
- 4.3 Strategic initiatives
- 4.4 Competitive benchmarking
- 4.5 Strategic dashboard
- 4.6 Innovation & technology landscape
Chapter 5 Market Size and Forecast, By Polarization, 2022 - 2035 (USD Million, ‘000 Units)
- 5.1 Key trends
- 5.2 Polarized
- 5.3 Non-polarized
Chapter 6 Market Size and Forecast, By Material, 2022 - 2035 (USD Million, ‘000 Units)
- 6.1 Key trends
- 6.2 Film capacitors
- 6.3 Ceramic capacitors
- 6.4 Electrolytic capacitors
- 6.5 Others
Chapter 7 Market Size and Forecast, By Region, 2022 - 2035 (USD Million, ‘000 Units)
- 7.1 Key trends
- 7.2 North America
- 7.2.1 U.S.
- 7.2.2 Canada
- 7.2.3 Mexico
- 7.3 Europe
- 7.3.1 UK
- 7.3.2 France
- 7.3.3 Germany
- 7.3.4 Italy
- 7.3.5 Austria
- 7.4 Asia Pacific
- 7.4.1 China
- 7.4.2 India
- 7.4.3 Japan
- 7.4.4 Australia
- 7.4.5 South Korea
- 7.5 Middle East & Africa
- 7.5.1 Saudi Arabia
- 7.5.2 South Africa
- 7.5.3 UAE
- 7.6 Latin America
- 7.6.1 Brazil
- 7.6.2 Argentina
- 7.6.3 Chile
Chapter 8 Company Profiles
- 8.1 ABB
- 8.2 CapXon International Electronic Co., Ltd.
- 8.3 Cornell Dubilier Electronics
- 8.4 ELNA Co., Ltd.
- 8.5 Havells India Ltd.
- 8.6 JB Capacitors Company
- 8.7 KEMET Corporation
- 8.8 KYOCERA AVX Components Corporation
- 8.9 Murata Manufacturing Co., Ltd.
- 8.10 Nichicon Corporation
- 8.11 Panasonic Corporation
- 8.12 Rubycon Corporation
- 8.13 Samsung Electro-Mechanics Co., Ltd.
- 8.14 Schneider Electric
- 8.15 Siemens
- 8.16 Taiyo Yuden Co., Ltd.
- 8.17 TDK Corporation
- 8.18 Vishay Intertechnology, Inc.
- 8.19 WIMA GmbH & Co. KG
- 8.20 Xuansn Electronic
 高壓電容器市場分析及預測(至2035年):類型、產品、應用、技術、組件、最終用戶、材質類型、功能、安裝類型
 2026年全球軸向引線電容器市場報告
 全球雙電層電容器市場(按類型、電壓範圍、應用和分銷管道分類)預測(2026-2032年)雙電層電容器隔膜市場:2026-2032年全球預測(依產品類型、材質、厚度範圍及最終用途產業分類)
 全球低壓電容器市場全球高壓電容器市場
 中壓電力電容器市場機會、成長動力、產業趨勢分析及2025-2034年預測高壓電力電容器市場機會、成長動力、產業趨勢分析及2025-2034年預測全球電容器市場輸配電容器市場機會、成長動力、產業趨勢分析及2025-2034年預測