

 |
市場調查報告書
商品編碼
1913400
自助結帳系統市場:市場機會、成長促進因素、產業趨勢分析及預測(2026-2035 年)Self-Checkout System Market Opportunity, Growth Drivers, Industry Trend Analysis, and Forecast 2026 - 2035 |
||||||
全球自助結帳系統市場預計到 2025 年將達到 53 億美元,到 2035 年將達到 188 億美元,年複合成長率為 13.7%。
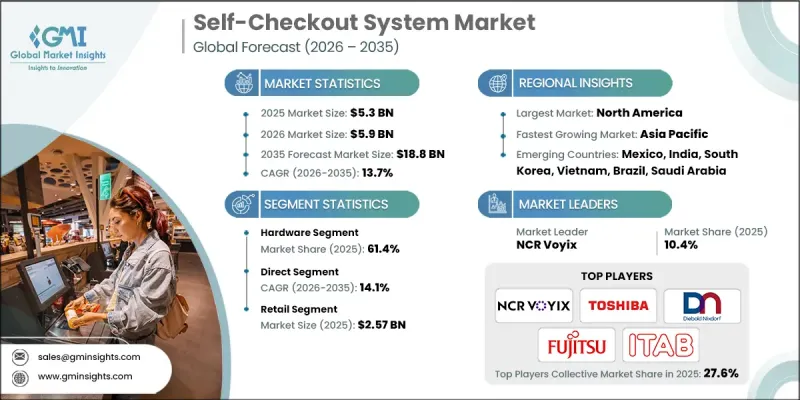
公共和商業場所客流量的不斷成長推動了產業發展,也給傳統收銀台帶來了越來越大的壓力。如何應對排長隊和擁擠的人群已成為一項重大的營運挑戰,迫使企業採用自助結帳解決方案。自助結帳系統能夠加快交易速度,最大限度地減少對第一線員工的依賴,並顯著提升顧客的便利性。此外,它們還能讓員工能騰出精力從事更有價值的工作,進而提升員工的工作效率。隨著數位支付在全球的普及,市場正迅速轉型為自動化、無現金支付環境。非接觸式支付選項和流暢的交易體驗已成為人們的核心期望,推動了這些系統的廣泛應用。在營運效率和顧客體驗成為首要考慮因素的背景下,自助結帳系統解決方案作為一項策略性投資,在服務業持續獲得認可。
| 市場覆蓋範圍 | |
|---|---|
| 開始年份 | 2025 |
| 預測期 | 2026-2035 |
| 初始市場規模 | 53億美元 |
| 市場規模預測 | 188億美元 |
| 複合年成長率 | 13.7% |
預計到2025年,硬體部分將佔據61.4%的市場。對可靠耐用的收銀機組件的強勁需求將繼續支撐這一主導地位。整合掃描、顯示和支付功能的硬體系統簡化了安裝和維護,使其在高客流量環境中極具吸引力。
預計到2025年,零售業規模將達到25.7億美元,佔市佔率的48.5%。零售商正在廣泛採用自助結帳系統,以提高交易速度、減少對勞動力的依賴,並有效應對高客流量。
預計到2025年,美國自助結帳系統市場規模將達17.5億美元。市場成長主要得益於大型零售商的強大影響力以及對結帳自動化領域的持續投資。憑藉先進的零售基礎設施和較高的普及率,技術供應商正日益將美國視為重要的產生收入來源。
目錄
第1章:分析方法和範圍
第2章執行摘要
第3章業界考察
- 產業生態系分析
- 供應商情況
- 利潤率
- 成本結構
- 每個階段的附加價值
- 影響價值鏈的因素
- 中斷
- 產業影響因素
- 促進要素
- 非接觸式支付和更快捷結帳體驗的需求日益成長
- 零售商店自動化程度不斷提高
- 降低零售商的營運成本
- 超級市場、大賣場和便利商店的擴張
- 產業潛在風險與挑戰
- 較高的初始安裝和維護成本
- 小規模、預算有限的零售商採用率有限
- 市場機遇
- 新興市場和開發中國家的需求不斷成長
- 非零售領域的採用率不斷提高
- 利用人工智慧拓展自主收銀解決方案
- 與行動應用、忠誠度計畫和分析工具整合
- 促進要素
- 成長潛力分析
- 監管環境
- 北美洲
- 支付卡產業資料安全標準(PCI DSS)
- 美國州級立法
- 加拿大的《個人資訊保護與電子文件法》(PIPEDA)
- 歐洲
- 一般資料保護規則(GDPR)
- 歐盟人工智慧法
- 英國數位身分和屬性信任框架
- 支付服務指令2(PSD2)
- 亞太地區
- 中國網路安全法(CSL)
- 本地數位支付整合標準
- 拉丁美洲
- 巴西PIX即時支付系統的安全要求
- 強制雙因素認證(2FA)
- 中東和非洲
- 海灣合作理事會國家支付安全框架
- 南非個人資訊保護法(POPIA)
- 北美洲
- 波特五力分析
- PESTEL 分析
- 科技與創新趨勢
- 當前技術趨勢
- 新興技術
- 價格趨勢
- 按地區
- 依產品
- 成本細分分析
- 永續性和環境影響
- 環境影響評估
- 社會影響力和社區服務
- 公司管治與企業社會責任
- 永續金融與投資趨勢
- 案例研究
- 未來前景與機遇
第4章 競爭情勢
- 介紹
- 公司市佔率分析
- 按地區
- 北美洲
- 歐洲
- 亞太地區
- 拉丁美洲
- 中東和非洲
- 按地區
- 主要企業的競爭分析
- 競爭定位矩陣
- 戰略展望矩陣
- 主要趨勢
- 企業合併(M&A)
- 商業夥伴關係與合作
- 新產品發布
- 企業擴張計畫和資金籌措
第5章 依產品類型分類的市場估算與預測(2022-2035 年)
- 硬體
- 娛樂
- 醫療保健
- 飯店業
- 零售
- 旅行
- 其他
- 軟體
- 服務
第6章 依支付方式分類的市場估算與預測(2022-2035 年)
- 現金制
- 無現金
- 詢問
- 非接觸式支付
- 混合
第7章 按模型分類的市場估算與預測(2022-2035 年)
- 獨立型
- 壁掛式和桌面式
- 手機類型
第8章 按銷售管道分類的市場估算與預測(2022-2035 年)
- 直銷
- 間接銷售
第9章 依自動駕駛等級分類的市場估算與預測(2022-2035 年)
- 半自動
- 全自動
第10章 按應用領域分類的市場估算與預測(2022-2035 年)
- 娛樂
- 醫療保健
- 飯店業
- 飯店
- 餐廳
- 其他
- 零售
- 超級市場和大賣場
- 便利商店
- 百貨公司
- 其他
- 旅行
- 其他
第11章 各地區市場估計與預測(2022-2035 年)
- 北美洲
- 美國
- 加拿大
- 歐洲
- 德國
- 英國
- 法國
- 義大利
- 西班牙
- 俄羅斯
- 北歐國家
- 比荷盧經濟聯盟國家
- 亞太地區
- 中國
- 印度
- 日本
- 韓國
- 澳洲和紐西蘭
- 新加坡
- 馬來西亞
- 印尼
- 越南
- 泰國
- 拉丁美洲
- 巴西
- 墨西哥
- 阿根廷
- 哥倫比亞
- 中東和非洲
- 南非
- 沙烏地阿拉伯
- 阿拉伯聯合大公國
第12章:公司簡介
- 世界公司
- NCR Voyix
- Diebold Nixdorf
- Toshiba Global Commerce
- Fujitsu
- ITAB
- IBM
- Zebra Technologies
- Verifone
- Glory
- StrongPoint ASA
- Honeywell
- Pan-Oston
- DXC Technology
- 本地公司
- Qingdao CCL Technology
- HiStone POS
- Qingdao Wintec System
- Pyramid Computer
- Hisense Systems
- ECR Software
- PCMS
- 新興企業
- Mashgin
- Zippin
- Trigo
- Standard Cognition
- ShelfX
The Global Self-Checkout System Market was valued at USD 5.3 billion in 2025 and is estimated to grow at a CAGR of 13.7% to reach USD 18.8 billion by 2035.
Growth is driven by rising customer volumes across public and commercial environments, which place increasing pressure on traditional checkout counters. Managing long queues and overcrowding has become a major operational challenge, prompting organizations to adopt automated checkout solutions. Self-checkout systems enable faster transaction completion, minimize dependency on on-site staff, and significantly improve customer convenience. These systems also allow businesses to reassign employees to higher-value tasks, improving workforce efficiency. The market is increasingly shifting toward automated and cashless checkout environments as digital payment adoption rises globally. Contactless payment options and seamless transaction experiences are becoming core expectations, supporting widespread system deployment. As operational efficiency and customer experience remain top priorities, self-checkout solutions continue to gain traction as a strategic investment across multiple service-oriented industries.
| Market Scope | |
|---|---|
| Start Year | 2025 |
| Forecast Year | 2026-2035 |
| Start Value | $5.3 Billion |
| Forecast Value | $18.8 Billion |
| CAGR | 13.7% |
The hardware segment accounted for 61.4% share in 2025. Strong demand for reliable and durable checkout components continues to support this dominance. Integrated hardware systems that combine scanning, display, and payment functionality simplify installation and maintenance, making them highly attractive for high-traffic environments.
The retail segment reached USD 2.57 billion and represented 48.5% share in 2025. Retailers have adopted self-checkout systems extensively to accelerate transaction speed, reduce labor dependency, and handle high customer footfall efficiently.
U.S. Self-Checkout System Market reached USD 1.75 billion in 2025. Market growth is supported by the strong presence of large-format retail operations and continuous investment in checkout automation. Technology providers increasingly prioritize the U.S. as a key revenue-generating region due to its advanced retail infrastructure and high adoption rates.
Key companies operating in the Self-Checkout System Market include Toshiba Global Commerce, Diebold Nixdorf, NCR Voyix, Fujitsu, ITAB, StrongPoint ASA, Pan-Oston, ECR Software, Wintec, and HiStone POS. Companies in the Self-Checkout System Market strengthen their competitive position through continuous hardware innovation and software integration. Manufacturers focus on developing robust, all-in-one systems that reduce installation complexity and improve uptime. Investment in cashless and contactless payment compatibility enhances system relevance. Strategic partnerships with retailers support large-scale deployments and long-term contracts. Firms also emphasize modular designs that allow easy upgrades and scalability. Improving system accuracy, security, and user interface design helps boost customer acceptance. Expanding global distribution networks and providing strong after-sales support further reinforce market presence and customer loyalty.
Table of Contents
Chapter 1 Methodology
- 1.1 Market scope and definition
- 1.2 Research design
- 1.2.1 Research approach
- 1.2.2 Data collection methods
- 1.3 Data mining sources
- 1.3.1 Global
- 1.3.2 Regional/Country
- 1.4 Base estimates and calculations
- 1.4.1 Base year calculation
- 1.4.2 Key trends for market estimation
- 1.5 Primary research and validation
- 1.5.1 Primary sources
- 1.6 Forecast
- 1.7 Research assumptions and limitations
Chapter 2 Executive Summary
- 2.1 Industry 3600 synopsis
- 2.2 Key market trends
- 2.2.1 Regional
- 2.2.2 Offering
- 2.2.3 Transaction
- 2.2.4 Model
- 2.2.5 Sales Channel
- 2.2.6 Autonomy Level
- 2.2.7 Application
- 2.3 TAM analysis, 2026-2035
- 2.4 CXO perspectives: Strategic imperatives
- 2.4.1 Executive decision points
- 2.4.2 Critical success factors
- 2.5 Future outlook and recommendations
Chapter 3 Industry Insights
- 3.1 Industry ecosystem analysis
- 3.1.1 Supplier landscape
- 3.1.2 Profit margin
- 3.1.3 Cost structure
- 3.1.4 Value addition at each stage
- 3.1.5 Factor affecting the value chain
- 3.1.6 Disruptions
- 3.2 Industry impact forces
- 3.2.1 Growth drivers
- 3.2.1.1 Rising demand for contactless and faster checkout experience
- 3.2.1.2 Growing adoption of automation in retail stores
- 3.2.1.3 Reduced operational costs for retailers
- 3.2.1.4 Expansion of supermarkets, hypermarkets, and convenience stores
- 3.2.2 Industry pitfalls and challenges
- 3.2.2.1 High initial deployment and maintenance costs
- 3.2.2.2 Limited adoption in small and budget-constrained retailers
- 3.2.3 Market opportunities
- 3.2.3.1 Growing demand from emerging markets and developing economies
- 3.2.3.2 Rising adoption in non-retail segments
- 3.2.3.3 Expansion of AI-powered autonomous checkout solutions
- 3.2.3.4 Integration with mobile apps, loyalty programs, and analytics
- 3.2.1 Growth drivers
- 3.3 Growth potential analysis
- 3.4 Regulatory landscape
- 3.4.1 North America
- 3.4.1.1 PCI Data Security Standard (PCI DSS)
- 3.4.1.2 US State-Level Legislation
- 3.4.1.3 Canadian PIPEDA
- 3.4.2 Europe
- 3.4.2.1 EU General Data Protection Regulation (GDPR)
- 3.4.2.2 EU AI Act
- 3.4.2.3 UK Digital Identity and Attributes Trust Framework
- 3.4.2.4 Payment Services Directive 2 (PSD2)
- 3.4.3 Asia Pacific
- 3.4.3.1 China's Cybersecurity Law (CSL)
- 3.4.3.2 Local Digital Payment Integration Standards
- 3.4.4 Latin America
- 3.4.4.1 Brazil PIX instant payment system security requirements
- 3.4.4.2 Mandatory Two-Factor Authentication (2FA)
- 3.4.5 Middle East & Africa
- 3.4.5.1 GCC National Payment Security Frameworks
- 3.4.5.2 South Africa's Protection of Personal Information Act (POPIA)
- 3.4.1 North America
- 3.5 Porter's analysis
- 3.6 PESTEL analysis
- 3.7 Technology and innovation landscape
- 3.7.1 Current technological trends
- 3.7.2 Emerging technologies
- 3.8 Price trends
- 3.8.1 By region
- 3.8.2 By product
- 3.9 Cost breakdown analysis
- 3.10 Sustainability and environmental impact
- 3.10.1 Environmental impact assessment
- 3.10.2 Social impact & community benefits
- 3.10.3 Governance & corporate responsibility
- 3.10.4 Sustainable finance & investment trends
- 3.11 Case studies
- 3.12 Future outlook & opportunities
Chapter 4 Competitive Landscape, 2025
- 4.1 Introduction
- 4.2 Company market share analysis
- 4.2.1 North America
- 4.2.2 Europe
- 4.2.3 Asia Pacific
- 4.2.4 LATAM
- 4.2.5 MEA
- 4.3 Competitive analysis of major market players
- 4.4 Competitive positioning matrix
- 4.5 Strategic outlook matrix
- 4.6 Key developments
- 4.6.1 Mergers & acquisitions
- 4.6.2 Partnerships & collaborations
- 4.6.3 New product launches
- 4.6.4 Expansion plans and funding
Chapter 5 Market Estimates & Forecast, By Offering, 2022 - 2035 ($Bn, Units)
- 5.1 Key trends
- 5.2 Hardware
- 5.2.1 Entertainment
- 5.2.2 Healthcare
- 5.2.3 Hospitality
- 5.2.4 Retail
- 5.2.5 Travel
- 5.2.6 Others
- 5.3 Software
- 5.4 Services
Chapter 6 Market Estimates & Forecast, By Transaction, 2022 - 2035 ($Bn, Units)
- 6.1 Key trends
- 6.2 Cash-based
- 6.3 Cashless
- 6.3.1 Contact
- 6.3.2 Contactless
- 6.3.3 Hybrid
Chapter 7 Market Estimates & Forecast, By Model, 2022 - 2035 ($Bn, Units)
- 7.1 Key trends
- 7.2 Standalone
- 7.3 Wall-mounted or countertop
- 7.4 Mobile
Chapter 8 Market Estimates & Forecast, By Sales Channel, 2022 - 2035 ($Bn, Units)
- 8.1 Key trends
- 8.2 Direct
- 8.3 Indirect
Chapter 9 Market Estimates & Forecast, By Autonomy Level, 2022 - 2035 ($Bn, Units)
- 9.1 Key trends
- 9.2 Semi-automated
- 9.3 fully-automated
Chapter 10 Market Estimates & Forecast, By Application, 2022 - 2035 ($Bn, Units)
- 10.1 Key trends
- 10.2 Entertainment
- 10.3 Healthcare
- 10.4 Hospitality
- 10.4.1 Hotel
- 10.4.2 Restaurants
- 10.4.3 Others
- 10.5 Retail
- 10.5.1 Supermarkets & Hypermarkets
- 10.5.2 Convenience Stores
- 10.5.3 Department Stores
- 10.5.4 Others
- 10.6 Travel
- 10.7 Others
Chapter 11 Market Estimates & Forecast, By Region, 2022 - 2035 ($Bn, Units)
- 11.1 Key trends
- 11.2 North America
- 11.2.1 US
- 11.2.2 Canada
- 11.3 Europe
- 11.3.1 Germany
- 11.3.2 UK
- 11.3.3 France
- 11.3.4 Italy
- 11.3.5 Spain
- 11.3.6 Russia
- 11.3.7 Nordics
- 11.3.8 Benelux
- 11.4 Asia Pacific
- 11.4.1 China
- 11.4.2 India
- 11.4.3 Japan
- 11.4.4 South Korea
- 11.4.5 ANZ
- 11.4.6 Singapore
- 11.4.7 Malaysia
- 11.4.8 Indonesia
- 11.4.9 Vietnam
- 11.4.10 Thailand
- 11.5 Latin America
- 11.5.1 Brazil
- 11.5.2 Mexico
- 11.5.3 Argentina
- 11.5.4 Colombia
- 11.6 MEA
- 11.6.1 South Africa
- 11.6.2 Saudi Arabia
- 11.6.3 UAE
Chapter 12 Company Profiles
- 12.1 Global companies
- 12.1.1 NCR Voyix
- 12.1.2 Diebold Nixdorf
- 12.1.3 Toshiba Global Commerce
- 12.1.4 Fujitsu
- 12.1.5 ITAB
- 12.1.6 IBM
- 12.1.7 Zebra Technologies
- 12.1.8 Verifone
- 12.1.9 Glory
- 12.1.10 StrongPoint ASA
- 12.1.11 Honeywell
- 12.1.12 Pan-Oston
- 12.1.13 DXC Technology
- 12.2 Regional companies
- 12.2.1 Qingdao CCL Technology
- 12.2.2 HiStone POS
- 12.2.3 Qingdao Wintec System
- 12.2.4 Pyramid Computer
- 12.2.5 Hisense Systems
- 12.2.6 ECR Software
- 12.2.7 PCMS
- 12.3 Emerging companies
- 12.3.1 Mashgin
- 12.3.2 Zippin
- 12.3.3 Trigo
- 12.3.4 Standard Cognition
- 12.3.5 ShelfX
 自助結帳系統系統市場:按部署類型、組織規模、組件、解決方案類型、最終用戶產業和應用分類-2026-2032年全球市場預測
 自助結帳系統系統市場分析及預測(至2035年):依類型、產品類型、服務、技術、組件、應用、部署類型、最終用戶、功能及安裝類型分類
 2026年全球自助結帳系統市場報告
 自助結帳系統市場 - 全球產業規模、佔有率、趨勢、機會、預測:按產品、交易類型、型號、最終用戶、地區和競爭格局分類,2021-2031年
 自助結帳系統市場規模、佔有率、成長及全球產業分析:依類型、應用和地區劃分的洞察與預測(2026-2034)
 自助結帳系統市場報告(按產品、型號、安裝類型、最終用戶和地區)2025 年至 2033 年
 自助結帳系統系統的全球市場評估,各零件,交易類別,模式類別,各終端用戶產業,各地區,機會,預測,2018年~2032年
 自助結帳系統市場,按產品、按交易、按型號、按應用、按國家和地區 - 2025 年至 2032 年全球行業分析、市場規模、市場佔有率和預測
 自助結帳系統系統:市場佔有率分析、產業趨勢/統計、成長預測(2025-2030)
 美國自助結帳系統系統市場規模、佔有率、趨勢分析報告:按組件、類型、應用和細分市場預測,2025-2030 年