


 |
市場調查報告書
商品編碼
1913397
聚四亞甲基醚二醇市場:市場機會、成長促進因素、產業趨勢分析及預測(2026-2035)Polytetramethylene Ether Glycol Market Opportunity, Growth Drivers, Industry Trend Analysis, and Forecast 2026 - 2035 |
||||||
2025 年全球聚四氫呋喃醚二醇市值為 29 億美元,預計到 2035 年將達到 56 億美元,年複合成長率為 6.6%。
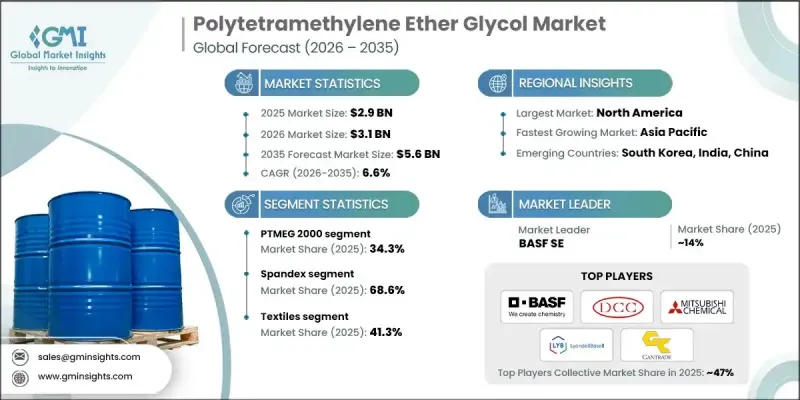
市場擴張的驅動力在於紡織品、汽車零件和先進材料應用領域對高性能聚合物日益成長的需求。聚四氫呋喃(也稱為聚四氫呋喃)因其作為彈性纖維、熱可塑性橡膠和特殊聚合物的核心結構單元而聞名。其廣泛的分子量範圍使其能夠應用於需要柔軟性、回彈性和機械穩定性的應用領域。紡織製造業的成長、汽車生產中輕質材料的日益普及以及高性能聚合物的持續創新正在塑造市場動態。生產商正投資於最新的製造技術,以提高產品的一致性、純度和工藝效率,從而支持其在要求苛刻的終端用戶行業中的廣泛應用。同時,永續性因素也影響生產策略,企業更加重視減少環境影響、提高資源利用效率並遵循循環經濟原則。這些趨勢確保了成熟市場和新興市場對聚四氫呋喃的持續全球需求。
| 市場覆蓋範圍 | |
|---|---|
| 開始年份 | 2025 |
| 預測期 | 2026-2035 |
| 初始市場規模 | 29億美元 |
| 市場規模預測 | 56億美元 |
| 複合年成長率 | 6.6% |
PTMEG 2000牌號在2025年佔據了34.3%的市場佔有率,預計從2026年到2035年將以6.6%的複合年成長率成長。此牌號維持主導地位的原因在於其均衡的分子結構,使其具有優異的模量、拉伸強度和加工柔軟性。其卓越的性能使其成為需要持久穩定機械性能的應用的理想選擇。
預計到 2025 年,氨綸市佔率將達到 68.6%,到 2035 年將以 7% 的複合年成長率成長。對彈性舒適服飾的強勁需求推動了 PTMEG 基纖維的高消費,這主要得益於其優異的回彈性、耐用性和美觀性。
預計到 2025 年,美國聚四氫呋喃醚二醇市場規模將達到 3.979 億美元。由於彈性纖維生產體係成熟、熱塑性聚氨酯應用廣泛,以及技術纖維和高性能材料領域的不斷創新,市場需求仍然強勁,鞏固了美國在該地區的主導地位。
目錄
第1章:分析方法和範圍
第2章執行摘要
第3章業界考察
- 產業生態系分析
- 供應商情況
- 利潤率
- 每個階段的附加價值
- 影響價值鏈的因素
- 中斷
- 產業影響因素
- 促進要素
- 產業潛在風險與挑戰
- 市場機遇
- 成長潛力分析
- 監管環境
- 北美洲
- 歐洲
- 亞太地區
- 拉丁美洲
- 中東和非洲
- 波特五力分析
- PESTEL 分析
- 科技與創新趨勢
- 當前技術趨勢
- 新興技術
- 價格趨勢
- 按地區
- 按產品等級
- 未來市場趨勢
- 科技與創新趨勢
- 當前技術趨勢
- 新興技術
- 專利趨勢
- 貿易統計(HS編碼)(註:僅提供主要國家的貿易統計)
- 主要進口國
- 主要出口國
- 永續性和環境方面
- 永續努力
- 減少廢棄物策略
- 生產中的能源效率
- 環保舉措
- 考慮到碳足跡
第4章 競爭情勢
- 介紹
- 公司市佔率分析
- 按地區
- 北美洲
- 歐洲
- 亞太地區
- 拉丁美洲
- 中東和非洲
- 按地區
- 企業矩陣分析
- 主要企業的競爭分析
- 競爭定位矩陣
- 主要趨勢
- 企業合併(M&A)
- 商業夥伴關係與合作
- 新產品發布
- 擴張計劃
第5章 依產品等級分類的市場估算與預測(2022-2035 年)
- PTMEG 250
- PTMEG 650
- PTMEG 1000
- PTMEG 1400
- PTMEG 1800
- PTMEG 2000
- 其他
第6章 按應用領域分類的市場估算與預測(2022-2035 年)
- 氨綸
- 熱塑性胺甲酸乙酯彈性體
- 共聚酯醚彈性體
- 其他
7. 依最終用途產業分類的市場估計與預測(2022-2035 年)
- 畫
- 建造
- 黏合劑和密封劑
- 紡織業
- 人造皮革
- 車
- 工業的
- 休閒與體育
- 其他
第8章 各地區市場估算與預測(2022-2035 年)
- 北美洲
- 美國
- 加拿大
- 歐洲
- 德國
- 英國
- 法國
- 西班牙
- 義大利
- 其他歐洲
- 亞太地區
- 中國
- 印度
- 日本
- 澳洲
- 韓國
- 亞太其他地區
- 拉丁美洲
- 巴西
- 墨西哥
- 阿根廷
- 其他拉丁美洲
- 中東和非洲
- 沙烏地阿拉伯
- 南非
- 阿拉伯聯合大公國
- 其他中東和非洲地區
第9章:公司簡介
- BASF SE
- Dairen Chemical Corporation
- Mitsubishi Chemical Corporation
- LyondellBasell Industries NV
- Gantrade Corporation
- Ashland Global Holdings Inc.
- Lanxess AG
- Kuraray Co., Ltd.
- Chang Chun Petrochemical
- Shanxi Sanwei Group
- Korea PTG Co., Ltd.
- China Petrochemical Corporation
- Brenntag
- SINOPEC Great Wall Energy
- IMCD Group
The Global Polytetramethylene Ether Glycol Market was valued at USD 2.9 billion in 2025 and is estimated to grow at a CAGR of 6.6% to reach USD 5.6 billion by 2035.
Market expansion is driven by rising demand for high-performance polymers across textiles, automotive components, and advanced material applications. Polytetramethylene ether glycol, also referred to as polytetrahydrofuran, is recognized for its role as a core building block in elastic fibers, thermoplastic elastomers, and specialty polymers. Availability across a broad range of molecular weights enables its use in applications requiring flexibility, resilience, and mechanical stability. Growth in textile manufacturing, increasing adoption of lightweight materials in automotive production, and ongoing innovation in performance polymers are collectively shaping market dynamics. Producers are investing in modern manufacturing techniques to enhance consistency, purity, and process efficiency, which is supporting wider adoption across demanding end-use industries. At the same time, sustainability considerations are influencing production strategies, with a greater focus on reducing environmental impact, improving resource efficiency, and aligning with circular economy principles. These trends are ensuring continued global demand across both mature and emerging markets.
| Market Scope | |
|---|---|
| Start Year | 2025 |
| Forecast Year | 2026-2035 |
| Start Value | $2.9 billion |
| Forecast Value | $5.6 billion |
| CAGR | 6.6% |
The PTMEG 2000 accounted for 34.3% share in 2025 and is expected to grow at a CAGR of 6.6% from 2026 to 2035. This grade maintains a leading position due to its balanced molecular structure, which supports strong elasticity, tensile strength, and processing flexibility. Its performance profile makes it a preferred option for applications requiring durability and consistent mechanical properties.
The spandex segment held 68.6% share in 2025 and is projected to grow at a CAGR of 7% through 2035. Strong growth in demand for stretchable and comfortable apparel is sustaining high consumption of PTMEG-based fibers, supported by its ability to deliver excellent recovery, durability, and aesthetic performance.
United States Polytetramethylene Ether Glycol Market generated USD 397.9 million in 2025. Demand remains strong due to established elastic fiber production, widespread use of thermoplastic polyurethanes, and continuous innovation in technical textiles and performance materials, reinforcing the country's leading regional position.
Key companies operating in the Global Polytetramethylene Ether Glycol Market include BASF SE, Mitsubishi Chemical Corporation, LyondellBasell Industries N.V., Kuraray Co., Ltd., Lanxess AG, Ashland Global Holdings Inc., Dairen Chemical Corporation, Chang Chun Petrochemical, Shanxi Sanwei Group, Korea PTG Co., Ltd., China Petrochemical Corporation, SINOPEC Great Wall Energy, Gantrade Corporation, Brenntag, and IMCD Group. Companies active in the Global Polytetramethylene Ether Glycol Market are strengthening their competitive position through capacity expansion, product differentiation, and technology advancement. Manufacturers are prioritizing process optimization to achieve higher purity levels, consistent molecular weight distribution, and improved production efficiency. Strategic investments in sustainable manufacturing practices and alternative feedstocks are helping align operations with evolving environmental expectations. Firms are also expanding global distribution networks and forming long-term supply agreements with downstream users to secure stable demand.
Table of Contents
Chapter 1 Methodology & Scope
- 1.1 Market scope and definition
- 1.2 Research design
- 1.2.1 Research approach
- 1.2.2 Data collection methods
- 1.3 Data mining sources
- 1.3.1 Global
- 1.3.2 Regional/Country
- 1.4 Base estimates and calculations
- 1.4.1 Base year calculation
- 1.4.2 Key trends for market estimation
- 1.5 Primary research and validation
- 1.5.1 Primary sources
- 1.6 Forecast model
- 1.7 Research assumptions and limitations
Chapter 2 Executive Summary
- 2.1 Industry 3600 synopsis
- 2.2 Key market trends
- 2.2.1 Product grade
- 2.2.2 Application
- 2.2.3 End use industry
- 2.2.4 Regional
- 2.3 TAM Analysis, 2025-2035
- 2.4 CXO perspectives: Strategic imperatives
- 2.4.1 Executive decision points
- 2.4.2 Critical success factors
- 2.5 Future outlook and strategic recommendations
Chapter 3 Industry Insights
- 3.1 Industry ecosystem analysis
- 3.1.1 Supplier landscape
- 3.1.2 Profit margin
- 3.1.3 Value addition at each stage
- 3.1.4 Factor affecting the value chain
- 3.1.5 Disruptions
- 3.2 Industry impact forces
- 3.2.1 Growth drivers
- 3.2.2 Industry pitfalls and challenges
- 3.2.3 Market opportunities
- 3.3 Growth potential analysis
- 3.4 Regulatory landscape
- 3.4.1 North America
- 3.4.2 Europe
- 3.4.3 Asia Pacific
- 3.4.4 Latin America
- 3.4.5 Middle East & Africa
- 3.5 Porter's analysis
- 3.6 PESTEL analysis
- 3.7 Technology and innovation landscape
- 3.7.1 Current technological trends
- 3.7.2 Emerging technologies
- 3.8 Price trends
- 3.8.1 By region
- 3.8.2 By product grade
- 3.9 Future market trends
- 3.10 Technology and innovation landscape
- 3.10.1 Current technological trends
- 3.10.2 Emerging technologies
- 3.11 Patent landscape
- 3.12 Trade statistics (HS code) ( Note: the trade statistics will be provided for key countries only)
- 3.12.1 Major importing countries
- 3.12.2 Major exporting countries
- 3.13 Sustainability and environmental aspects
- 3.13.1 Sustainable practices
- 3.13.2 Waste reduction strategies
- 3.13.3 Energy efficiency in production
- 3.13.4 Eco-friendly initiatives
- 3.14 Carbon footprint consideration
Chapter 4 Competitive Landscape, 2025
- 4.1 Introduction
- 4.2 Company market share analysis
- 4.2.1 By region
- 4.2.1.1 North America
- 4.2.1.2 Europe
- 4.2.1.3 Asia Pacific
- 4.2.1.4 LATAM
- 4.2.1.5 MEA
- 4.2.1 By region
- 4.3 Company matrix analysis
- 4.4 Competitive analysis of major market players
- 4.5 Competitive positioning matrix
- 4.6 Key developments
- 4.6.1 Mergers & acquisitions
- 4.6.2 Partnerships & collaborations
- 4.6.3 New product launches
- 4.6.4 Expansion plans
Chapter 5 Market Estimates and Forecast, By Product Grade, 2022-2035 (USD Billion) (Kilo Tons)
- 5.1 Key trends
- 5.2 PTMEG 250
- 5.3 PTMEG 650
- 5.4 PTMEG 1000
- 5.5 PTMEG 1400
- 5.6 PTMEG 1800
- 5.7 PTMEG 2000
- 5.8 Others
Chapter 6 Market Estimates and Forecast, By Application, 2022-2035 (USD Billion) (Kilo Tons)
- 6.1 Key trends
- 6.2 Spandex
- 6.3 Thermoplastic urethane elastomer
- 6.4 Co-polyester ether elastomers
- 6.5 Others
Chapter 7 Market Estimates and Forecast, By End Use Industry, 2022-2035 (USD Billion) (Kilo Tons)
- 7.1 Key trends
- 7.2 Coatings
- 7.3 Construction
- 7.4 Adhesives & sealants
- 7.5 Textiles
- 7.6 Artificial leather
- 7.7 Automotive
- 7.8 Industrial
- 7.9 Leisure & sports
- 7.10 Others
Chapter 8 Market Estimates and Forecast, By Region, 2022-2035 (USD Billion) (Kilo Tons)
- 8.1 Key trends
- 8.2 North America
- 8.2.1 U.S.
- 8.2.2 Canada
- 8.3 Europe
- 8.3.1 Germany
- 8.3.2 UK
- 8.3.3 France
- 8.3.4 Spain
- 8.3.5 Italy
- 8.3.6 Rest of Europe
- 8.4 Asia Pacific
- 8.4.1 China
- 8.4.2 India
- 8.4.3 Japan
- 8.4.4 Australia
- 8.4.5 South Korea
- 8.4.6 Rest of Asia Pacific
- 8.5 Latin America
- 8.5.1 Brazil
- 8.5.2 Mexico
- 8.5.3 Argentina
- 8.5.4 Rest of Latin America
- 8.6 Middle East and Africa
- 8.6.1 Saudi Arabia
- 8.6.2 South Africa
- 8.6.3 UAE
- 8.6.4 Rest of Middle East and Africa
Chapter 9 Company Profiles
- 9.1 BASF SE
- 9.2 Dairen Chemical Corporation
- 9.3 Mitsubishi Chemical Corporation
- 9.4 LyondellBasell Industries N.V.
- 9.5 Gantrade Corporation
- 9.6 Ashland Global Holdings Inc.
- 9.7 Lanxess AG
- 9.8 Kuraray Co., Ltd.
- 9.9 Chang Chun Petrochemical
- 9.10 Shanxi Sanwei Group
- 9.11 Korea PTG Co., Ltd.
- 9.12 China Petrochemical Corporation
- 9.13 Brenntag
- 9.14 SINOPEC Great Wall Energy
- 9.15 IMCD Group
 生物基聚丙烯市場:依原料、製造技術、應用及終端用戶產業分類-2026-2032年全球市場預測
 生物基聚丙烯市場規模、佔有率、成長和全球產業分析:按類型、應用和地區的洞察,2026-2034年的預測
 生物基聚丙烯醫療設備市場-全球產業規模、佔有率、趨勢、機會和預測:按應用、地區和競爭格局分類,2021-2031年
 生物基聚丙烯市場規模、佔有率和趨勢分析報告:按應用、地區和細分市場預測(2026-2033 年)
 生物基聚丙烯市場規模、佔有率和成長分析(按原料、製造流程、擠出類型、應用和地區分類)-2026-2033年產業預測
 全球醫療設備生物基聚丙烯市場全球合成與生物基聚丙烯市場
 生物基聚丙烯:市場佔有率分析、產業趨勢與成長預測(2025-2030)
 聚四亞甲基醚二醇市場評估:各用途,各終端用戶產業,各地區,機會及預測,2018~2032年
 生物基聚丙烯市場按來源、應用、最終用途產業和地區分類 - 預測至 2029 年