

 |
市場調查報告書
商品編碼
1913371
聯苯市場:市場機會、成長促進因素、產業趨勢分析及預測(2026-2035)Biphenyl Market Opportunity, Growth Drivers, Industry Trend Analysis, and Forecast 2026 - 2035 |
||||||
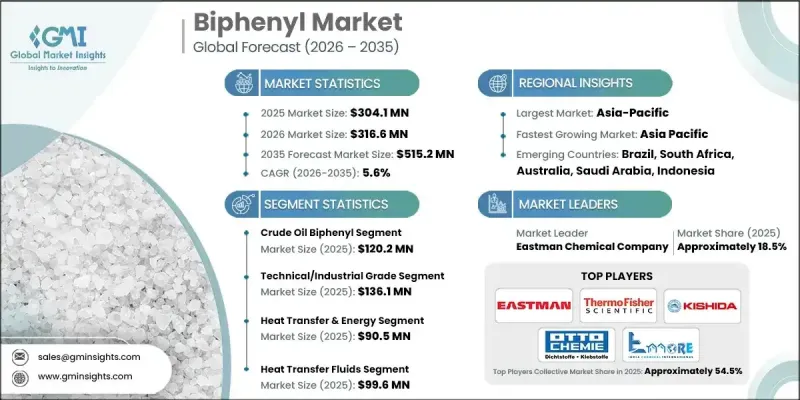
2025 年全球聯苯市場價值為 3.041 億美元,預計到 2035 年將達到 5.152 億美元,年複合成長率為 5.6%。
聯苯市場成長主要受特種化學品生產中對聯苯需求不斷成長的推動。製藥和農業化學品產業對高純度中間體的依賴性日益增強,這使得聯苯成為複雜分子配方中的關鍵成分。日益嚴格的化學品純度和性能監管要求,也推動了聯苯類化合物的應用,因為它們具有穩定性好、性能可預測等優點。另一個關鍵促進因素是聯苯作為傳熱介質和工業溶劑的應用不斷擴展。其優異的熱穩定性和溶解性使其成為高性能工業應用的理想選擇,尤其是在石油化學和汽車行業。環境和監管方面的考慮也推動了聯苯的應用,因為其明確的安全性和可預測的性能使其適用於塗料、黏合劑、塑膠和其他受監管的應用領域。總而言之,工業復甦、能源效率提升舉措以及對可靠合規的化學解決方案的需求,共同推動了市場的繁榮發展。
| 市場覆蓋範圍 | |
|---|---|
| 開始年份 | 2025 |
| 預測期 | 2026-2035 |
| 初始市場規模 | 3.041億美元 |
| 市場規模預測 | 5.152億美元 |
| 複合年成長率 | 5.6% |
預計2025年,原油衍生聯苯市場規模將達到1.202億美元,2026年至2035年的複合年成長率(CAGR)為5.1%。其生產持續受惠於成熟的石化設施,這些設施為穩定的工業供應提供了保障。在焦爐製程整合的地區,煤焦油衍生聯苯仍然十分重要,因為它可以實現產品特定用途和成本效益高的生產。隨著人們尋求更清潔的加工路線,天然氣衍生聯苯正日益受到關注,因為它有助於減少排放並提高效率。
預計到 2025 年,傳熱和能源應用領域市場規模將達到 9,050 萬美元,到 2035 年將以 5.3% 的複合年成長率成長。聯苯的功能特性使其能夠在高溫環境下運行,其在紡織和塑膠加工以及受監管的食品和研究應用中的應用,正在推動市場的穩步擴張。
預計到2025年,北美聯苯市場規模將達到7,230萬美元。該地區受益於成熟的化學品製造網路、對高純度化學品生產的持續投資,以及來自製藥、特種化學品和工業能源領域的持續需求。監管合規和受控的工業環境進一步鞏固了市場的穩定性和普及性。
目錄
第1章:分析方法和範圍
第2章執行摘要
第3章業界考察
- 生態系分析
- 供應商情況
- 利潤率
- 每個階段的附加價值
- 影響價值鏈的因素
- 中斷
- 產業影響因素
- 促進要素
- 產業潛在風險與挑戰
- 市場機遇
- 成長潛力分析
- 監管環境
- 北美洲
- 歐洲
- 亞太地區
- 拉丁美洲
- 中東和非洲
- 波特五力分析
- PESTEL 分析
- 價格趨勢
- 按地區
- 依產品
- 未來市場趨勢
- 科技與創新趨勢
- 當前技術趨勢
- 新興技術
- 專利狀態
- 貿易統計(註:僅提供主要國家的貿易統計)
- 主要進口國
- 主要出口國
- 永續性和環境方面
- 永續實踐
- 減少廢棄物策略
- 生產中的能源效率
- 環保舉措
- 碳足跡考量
第4章 競爭情勢
- 介紹
- 公司市佔率分析
- 按地區
- 北美洲
- 歐洲
- 亞太地區
- 拉丁美洲
- 中東和非洲
- 按地區
- 企業矩陣分析
- 主要企業的競爭分析
- 競爭定位矩陣
- 主要趨勢
- 併購
- 夥伴關係與合作
- 新產品發布
- 業務拓展計劃
第5章 依原料分類的市場估算與預測(2022-2035 年)
- 原油衍生的聯苯
- 煤焦油聯苯
- 天然氣衍生的聯苯
第6章 依等級分類的市場估計與預測(2022-2035 年)
- 醫藥/分析級
- 電子/液晶級
- 工業級
- 研究級和實驗室級
7. 依最終用途產業分類的市場估計與預測(2022-2035 年)
- 製藥
- 農藥(殺蟲劑、殺菌劑、除草劑、殺菌劑)
- 電子設備和顯示器(LCD、OLED、太陽能發電)
- 熱傳遞和能量
- 纖維
- 食品/飲料
- 塑膠和聚合物
- 研究/分析
第8章 按應用領域分類的市場估算與預測(2022-2035 年)
- 熱介質
- 化學中間體
- 消毒劑
- 染料載體
- 食品防腐劑和殺菌劑
- 醫藥溶劑
第9章 各地區市場估算與預測(2022-2035 年)
- 北美洲
- 美國
- 加拿大
- 歐洲
- 德國
- 英國
- 法國
- 義大利
- 西班牙
- 其他歐洲
- 亞太地區
- 中國
- 印度
- 日本
- 澳洲
- 韓國
- 亞太其他地區
- 拉丁美洲
- 巴西
- 墨西哥
- 阿根廷
- 其他拉丁美洲
- 中東和非洲
- 沙烏地阿拉伯
- 南非
- 阿拉伯聯合大公國
- 其他中東和非洲地區
第10章:公司簡介
- Eastman Chemical Company
- Kanto Chemical Co., Inc.
- Kishida Chemical Co., Ltd.
- Ennore India Chemicals
- Matrix Scientific
- LGC Standards
- Taj Pharmaceuticals Ltd.
- Biosynth Carbosynth
- Otto Chemie Pvt. Ltd.
- Thermo Fisher Scientific
The Global Biphenyl Market was valued at USD 304.1 million in 2025 and is estimated to grow at a CAGR of 5.6% to reach USD 515.2 million by 2035.
Market growth is driven by the rising demand for biphenyl in the production of specialty chemicals. The pharmaceutical and agrochemical sectors increasingly rely on high-purity intermediates, making biphenyl a critical component in complex molecular formulations. Stricter regulatory requirements on chemical purity and performance are encouraging manufacturers to adopt biphenyl-based compounds for their stability and predictable results. Another significant driver is the expanding use of biphenyl as a heat transfer fluid and industrial solvent. Its excellent thermal stability and solubility make it ideal for high-performance industrial applications, particularly in the petrochemical and automotive sectors. Environmental and regulatory considerations also support biphenyl adoption, as its well-characterized safety profile and predictable behavior make it suitable for coatings, adhesives, plastics, and other regulated applications. Overall, the market is benefiting from a combination of industrial recovery, energy efficiency initiatives, and the need for reliable, compliant chemical solutions.
| Market Scope | |
|---|---|
| Start Year | 2025 |
| Forecast Year | 2026-2035 |
| Start Value | $304.1 Million |
| Forecast Value | $515.2 Million |
| CAGR | 5.6% |
The crude oil-based biphenyl segment was valued at USD 120.2 million in 2025 and is expected to grow at a CAGR of 5.1% from 2026 to 2035. Its production continues to benefit from established petrochemical facilities that support a consistent industrial supply. Coal tar-derived biphenyl remains relevant where integrated coke-oven processes are in place, enabling by-product utilization and cost-effective production. Natural gas-based biphenyl is gaining attention as cleaner processing routes are explored, helping the industry reduce emissions while improving efficiency.
The heat transfer and energy application segment accounted for USD 90.5 million in 2025 and is expected to grow at a CAGR of 5.3% through 2035. Biphenyl's functional properties support high-temperature operation, and its use in textiles, plastics processing, and regulated food and research applications contributes to steady market expansion.
North America Biphenyl Market was valued at USD 72.3 million in 2025. The region benefits from well-established chemical manufacturing networks, sustained investments in high-purity chemical production, and ongoing demand from pharmaceutical, specialty chemicals, and industrial energy sectors. Regulatory compliance and controlled industrial environments further support market stability and adoption.
Key companies active in the Global Biphenyl Market include Kishida Chemical Co., Ltd., Thermo Fisher Scientific, Eastman Chemical Company, Otto Chemie Pvt. Ltd., Ennore India Chemicals, and others. Market participants are strengthening their position by expanding high-purity biphenyl production capabilities, developing cleaner and more efficient synthesis processes, and diversifying feedstock sources to natural gas-based routes. Companies are also investing in R&D to enhance biphenyl applications in specialty chemicals, heat transfer media, and industrial solvents. Strategic partnerships with downstream chemical manufacturers and regional expansion initiatives help firms secure long-term contracts and global market share.
Table of Contents
Chapter 1 Methodology
- 1.1 Market scope and definition
- 1.2 Research design
- 1.2.1 Research approach
- 1.2.2 Data collection methods
- 1.3 Data mining sources
- 1.3.1 Global
- 1.3.2 Regional/Country
- 1.4 Base estimates and calculations
- 1.4.1 Base year calculation
- 1.4.2 Key trends for market estimation
- 1.5 Primary research and validation
- 1.5.1 Primary sources
- 1.6 Forecast model
- 1.7 Research assumptions and limitations
Chapter 2 Executive Summary
- 2.1 Industry 3600 synopsis
- 2.2 Key market trends
- 2.2.1 Regional
- 2.2.2 Source
- 2.2.3 Grade
- 2.2.4 End Use Industry
- 2.2.5 Application
- 2.3 TAM Analysis, 2026-2035
- 2.4 CXO perspectives: Strategic imperatives
- 2.4.1 Executive decision points
- 2.4.2 Critical success factors
- 2.5 Future Outlook and Strategic Recommendations
Chapter 3 Industry Insights
- 3.1 Industry ecosystem analysis
- 3.1.1 Supplier Landscape
- 3.1.2 Profit Margin
- 3.1.3 Value addition at each stage
- 3.1.4 Factor affecting the value chain
- 3.1.5 Disruptions
- 3.2 Industry impact forces
- 3.2.1 Growth drivers
- 3.2.2 Industry pitfalls and challenges
- 3.2.3 Market opportunities
- 3.3 Growth potential analysis
- 3.4 Regulatory landscape
- 3.4.1 North America
- 3.4.2 Europe
- 3.4.3 Asia Pacific
- 3.4.4 Latin America
- 3.4.5 Middle East & Africa
- 3.5 Porter's analysis
- 3.6 PESTEL analysis
- 3.7 Price trends
- 3.7.1 By region
- 3.7.2 By product
- 3.8 Future market trends
- 3.9 Technology and Innovation landscape
- 3.9.1 Current technological trends
- 3.9.2 Emerging technologies
- 3.10 Patent Landscape
- 3.11 Trade statistics (Note: the trade statistics will be provided for key countries only)
- 3.11.1 Major importing countries
- 3.11.2 Major exporting countries
- 3.12 Sustainability and Environmental Aspects
- 3.12.1 Sustainable Practices
- 3.12.2 Waste Reduction Strategies
- 3.12.3 Energy Efficiency in Production
- 3.12.4 Eco-friendly Initiatives
- 3.13 Carbon Footprint Considerations
Chapter 4 Competitive Landscape, 2025
- 4.1 Introduction
- 4.2 Company market share analysis
- 4.2.1 By region
- 4.2.1.1 North America
- 4.2.1.2 Europe
- 4.2.1.3 Asia Pacific
- 4.2.1.4 LATAM
- 4.2.1.5 MEA
- 4.2.1 By region
- 4.3 Company matrix analysis
- 4.4 Competitive analysis of major market players
- 4.5 Competitive positioning matrix
- 4.6 Key developments
- 4.6.1 Mergers & acquisitions
- 4.6.2 Partnerships & collaborations
- 4.6.3 New Product Launches
- 4.6.4 Expansion Plans
Chapter 5 Market Estimates and Forecast, By Source, 2022 - 2035 (USD Million, Kilo Tons)
- 5.1 Key trends
- 5.2 Crude oil biphenyl
- 5.3 Coal tar biphenyl
- 5.4 Natural gas biphenyl
Chapter 6 Market Estimates and Forecast, By Grade, 2022 - 2035 (USD Million, Kilo Tons)
- 6.1 Key trends
- 6.2 Pharmaceutical/analytical grade
- 6.3 Electronic/lcd grade
- 6.4 Technical/industrial grade
- 6.5 Research/laboratory grade
Chapter 7 Market Estimates and Forecast, By End Use Industry, 2022 - 2035 (USD Million, Kilo Tons)
- 7.1 Key trends
- 7.2 Pharmaceuticals
- 7.3 Agrochemicals (pesticides, fungicides, herbicides, insecticides)
- 7.4 Electronics & display (LCD, OLED, photovoltaics)
- 7.5 Heat transfer & energy
- 7.6 Textiles
- 7.7 Food & beverage
- 7.8 Plastics & polymers
- 7.9 Research & analytical
Chapter 8 Market Estimates and Forecast, By Application, 2022 - 2035 (USD Million, Kilo Tons)
- 8.1 Key trends
- 8.2 Heat transfer fluids
- 8.3 Chemical intermediate
- 8.4 Fungicide
- 8.5 Dyestuff carrier
- 8.6 Food preservatives & fungistats
- 8.7 Pharmaceutical solvents
Chapter 9 Market Estimates and Forecast, By Region, 2022 - 2035 (USD Million, Kilo Tons)
- 9.1 Key trends
- 9.2 North America
- 9.2.1 U.S.
- 9.2.2 Canada
- 9.3 Europe
- 9.3.1 Germany
- 9.3.2 UK
- 9.3.3 France
- 9.3.4 Italy
- 9.3.5 Spain
- 9.3.6 Rest of Europe
- 9.4 Asia Pacific
- 9.4.1 China
- 9.4.2 India
- 9.4.3 Japan
- 9.4.4 Australia
- 9.4.5 South Korea
- 9.4.6 Rest of Asia Pacific
- 9.5 Latin America
- 9.5.1 Brazil
- 9.5.2 Mexico
- 9.5.3 Argentina
- 9.5.4 Rest of Latin America
- 9.6 Middle East & Africa
- 9.6.1 Saudi Arabia
- 9.6.2 South Africa
- 9.6.3 UAE
- 9.6.4 Rest of Middle East & Africa
Chapter 10 Company Profiles
- 10.1 Eastman Chemical Company
- 10.2 Kanto Chemical Co., Inc.
- 10.3 Kishida Chemical Co., Ltd.
- 10.4 Ennore India Chemicals
- 10.5 Matrix Scientific
- 10.6 LGC Standards
- 10.7 Taj Pharmaceuticals Ltd.
- 10.8 Biosynth Carbosynth
- 10.9 Otto Chemie Pvt. Ltd.
- 10.10 Thermo Fisher Scientific
