


 |
市場調查報告書
商品編碼
1913351
燃氣渦輪機市場機會、成長要素、產業趨勢分析及預測(2026-2035年)Gas Turbine Market Opportunity, Growth Drivers, Industry Trend Analysis, and Forecast 2026 - 2035 |
||||||
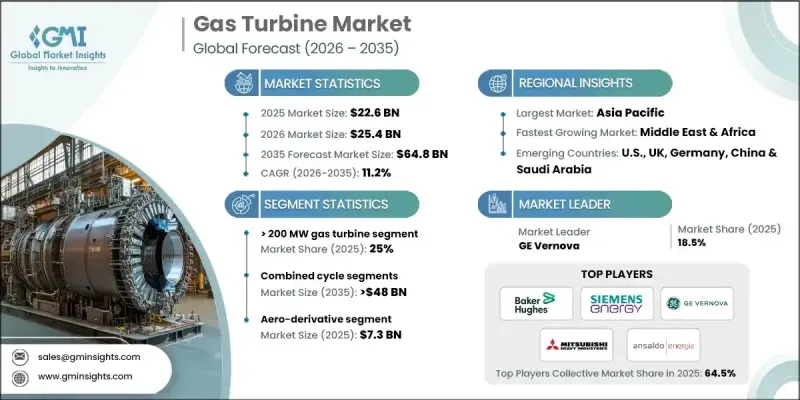
全球燃氣渦輪機市場預計到 2025 年將達到 226 億美元,到 2035 年將達到 648 億美元,年複合成長率為 11.2%。
推動市場成長的因素包括:電廠現代化進程加快、對清潔能源系統的需求不斷成長,以及全球轉型為靈活且高效的發電技術。燃氣渦輪機因其能夠與間歇性可再生能源互補,且具有啟動迅速、排放低等特點,在已開發經濟體和新興經濟體中都日益受到重視。渦輪材料、冷卻技術和數位化預測性維護的進步,進一步推動了新一代燃氣渦輪機的推出,這些新渦輪機經過最佳化,具有更長的運行時間和更高的熱效率。
| 市場覆蓋範圍 | |
|---|---|
| 開始年份 | 2025 |
| 預測年份 | 2026-2035 |
| 起始值 | 226億美元 |
| 預測金額 | 648億美元 |
| 複合年成長率 | 11.2% |
公用事業公司面臨越來越大的降低碳排放強度的壓力,這推動了對混合動力和氫能燃氣渦輪機的投資,從而顯著降低了全生命週期排放並提高了電網穩定性。這些創新技術正在幫助公用事業公司和工業營運商逐步淘汰傳統的燃煤發電裝置。現有燃氣渦輪機設備的升級和改造也極大地促進了市場成長,這主要源於營運商對更長設備壽命、更高燃料柔軟性和更高聯合循環效率的需求。隨著全球製造業、資料中心和重工業的電力需求激增,燃氣渦輪機仍然是可靠基本負載和尖峰負載發電的基礎技術。
預計到2025年,50kW燃氣渦輪機市場規模將達到14億美元,主要驅動力是分散式和社區發電解決方案需求的成長。這些緊湊型燃氣渦輪機正擴大應用於工業設施、偏遠地區、離網地區和微電網等特殊能源環境中,在這些環境中,持續可靠性、高效率和運行柔軟性至關重要。它們能夠在最小的面積內提供穩定的電力輸出,使其成為需要不間斷能源供應地區的理想選擇。此外,它們的低排放、燃料多樣性以及與再生能源來源整合的潛力也備受重視,這與全球朝向更清潔、更具韌性的能源基礎設施發展趨勢相符。
預計到2035年,聯合循環發電市場規模將達到480億美元,主要得益於其更高的效率。與傳統的單一循環系統相比,複合循環發電系統在相同燃料投入下能夠產生更多電力。由於其低排放、運行柔軟性以及能夠同時滿足基本負載和尖峰電力需求,聯合循環發電廠越來越受到大規模公共產業計劃的青睞。世界各國政府和公共產業都在優先發展高效天然氣技術,以滿足排放的電力需求並實現減排目標,這進一步推動了對聯合循環燃氣渦輪機的需求。
預計到2025年,亞太地區燃氣渦輪機市場將佔全球年總收入的35%,並顯著超越其他所有地區。該地區的領先地位歸功於快速的工業化、大規模的城市化進程以及對燃氣發電基礎設施的巨額投資。由於天然氣燃燒更清潔、運作成本更低,中國、印度、印尼和東南亞各國政府正加速從石油和煤炭發電轉型為天然氣發電。
目錄
第1章調查方法和範圍
第2章執行摘要
第3章業界考察
- 生態系分析
- 原物料供應及採購分析
- 製造能力評估
- 供應鏈韌性與風險因素
- 配電網路分析
- 監管環境
- 產業影響因素
- 促進要素
- 產業潛在風險與挑戰
- 成長潛力分析
- 波特五力分析
- PESTEL 分析
- 燃氣渦輪機成本結構分析
- 價格趨勢分析(美元/兆瓦)
- 按地區
- 按產能
- 市場動態與新興趨勢
- 智慧技術和工業4.0的採用
- 綠色舉措和ESG策略
- 天然氣運輸基礎設施的定性分析
- 天然氣發電的發展趨勢
- 電力業替代能源概覽
- 對天然氣在煤改氣轉型中的作用進行詳細分析
- 全球天然氣使用概述
第4章 競爭情勢
- 介紹
- 按地區分類的公司市佔率分析
- 北美洲
- 歐洲
- 亞太地區
- 中東和非洲
- 拉丁美洲
- 戰略儀錶板
- 策略舉措
- 重要夥伴關係與合作
- 重大併購活動
- 產品創新與新產品發布
- 市場擴大策略
- 競爭標竿分析
- 創新與永續性格局
第5章 依產能分類的市場規模及預測(2022-2035年)
- 50千瓦或以下
- 50千瓦至500千瓦
- 500千瓦至1兆瓦以上
- 1兆瓦以上~30兆瓦
- 30兆瓦~70兆瓦
- 70兆瓦~200兆瓦
- 超過200兆瓦
第6章 2022-2035年依產品分類的市場規模及預測
- 飛機衍生
- 大型商用車輛
第7章 依技術分類的市場規模及預測(2022-2035年)
- 開迴路
- 複合循環
第8章 依應用領域分類的市場規模及預測(2022-2035年)
- 發電廠
- 石油和天然氣
- 加工廠
- 航空領域
- 船
- 其他
第9章 2022-2035年各地區市場規模及預測
- 北美洲
- 美國
- 加拿大
- 墨西哥
- 歐洲
- 英國
- 法國
- 德國
- 俄羅斯
- 義大利
- 荷蘭
- 芬蘭
- 希臘
- 丹麥
- 羅馬尼亞
- 波蘭
- 瑞典
- 亞太地區
- 中國
- 澳洲
- 日本
- 印度
- 韓國
- 印尼
- 泰國
- 馬來西亞
- 孟加拉
- 中東和非洲
- 沙烏地阿拉伯
- 阿拉伯聯合大公國
- 卡達
- 科威特
- 阿曼
- 埃及
- 土耳其
- 巴林
- 伊拉克
- 約旦
- 黎巴嫩
- 南非
- 奈及利亞
- 阿爾及利亞
- 肯亞
- 迦納
- 拉丁美洲
- 巴西
- 阿根廷
- 秘魯
- 智利
第10章:公司簡介
- Ansaldo Energia
- Baker Hughes
- Bharat Heavy Electricals Limited
- Capstone Green Energy
- Destinus Energy
- Doosan Enerbility
- FlexEnergy Solutions
- GE Vernova
- Harbin Electric Corporation
- IHI Corporation
- Kawasaki Heavy Industries
- MAN Energy Solutions
- Mitsubishi Heavy Industries
- Nanjing Steam Turbine Motor(Group)
- Rolls-Royce
- Shanghai Electric
- Siemens Energy
- Solar Turbines
- Vericor
- Wartsila
The Global Gas Turbine Market was valued at USD 22.6 billion in 2025 and is estimated to grow at a CAGR of 11.2% to reach USD 64.8 billion by 2035.
The market growth is driven by accelerated power plant modernization, rising demand for cleaner energy systems, and the global shift toward flexible, high-efficiency generation technologies. Gas turbines continue to gain prominence across both developed and emerging economies due to their capability to balance intermittent renewable energy and deliver fast-start, low-emission performance. Advancements in turbine materials, cooling technologies, and digital predictive maintenance have further strengthened the adoption of next-generation units optimized for long-duration operation and superior thermal efficiency.
| Market Scope | |
|---|---|
| Start Year | 2025 |
| Forecast Year | 2026-2035 |
| Start Value | $22.6 Billion |
| Forecast Value | $64.8 Billion |
| CAGR | 11.2% |
The increasing pressure on utilities to reduce carbon intensity has boosted investment in hybrid and hydrogen-ready gas turbines, enabling significant reductions in lifecycle emissions while enhancing grid stability. These innovations support utilities and industrial operators in transitioning from conventional coal-fired units. Upgrades and retrofits for existing turbine fleets also contribute substantially to market growth, as operators seek to extend equipment life, improve fuel flexibility, and enhance combined-cycle efficiency. With global electricity demand surging across manufacturing, data centers, and heavy industries, gas turbines continue to serve as a cornerstone technology for reliable baseload and peak-load power generation.
The 50 kW gas turbine market was valued at USD 1.4 billion in 2025, driven primarily by the growing demand for decentralized and localized power generation solutions. These compact turbines are increasingly utilized in industrial facilities, remote or off-grid locations, and specialized energy setups such as microgrids, where continuous reliability, high efficiency, and operational flexibility are paramount. Their ability to deliver consistent power output with minimal footprint makes them ideal for sectors requiring uninterrupted energy supply. Additionally, these turbines are favored for their low emissions, fuel versatility, and potential integration with renewable energy sources, which aligns with global trends toward cleaner and more resilient energy infrastructure.
The combined cycle segment is expected to reach USD 48 billion by 2035, driven by its superior efficiency and ability to generate more electricity using the same fuel input compared to conventional simple-cycle systems. Combined cycle power plants are increasingly preferred for large-scale utility projects due to their lower emissions profile, operational flexibility, and ability to support baseload as well as peak power requirements. Governments and utilities worldwide are prioritizing high-efficiency natural gas technologies to meet rising electricity demand while aligning with emission reduction goals, strengthening the demand for combined cycle gas turbines.
Asia Pacific Gas Turbine Market held 35% share in 2025 significantly outpacing all other regions in annual revenue. The region's dominance is attributed to rapid industrialization, extensive urban growth, and massive investments in gas-fired power generation infrastructure. Governments in China, India, Indonesia, and Southeast Asia are accelerating the shift from oil- and coal-based power generation to natural gas, driven by cleaner combustion characteristics and lower operating costs.
Major companies shaping the Global Gas Turbine Market include General Electric, Siemens Energy, Mitsubishi Power, Ansaldo Energia, Rolls-Royce, Solar Turbines, Doosan Enerbility, Harbin Electric, BHEL, and OPRA Turbines. These players focus on high-efficiency turbine development, hydrogen integration, service modernization, and OEM-utility partnerships to strengthen their market presence. Leading companies in the Gas Turbine Market are adopting several strategic initiatives to reinforce their global presence. A major focus is on developing hydrogen-capable and low-NOx turbines, enabling operators to transition toward cleaner fuels while future-proofing long-term asset investments. Firms are also expanding aftermarket service portfolios, offering digital monitoring, predictive maintenance, and full lifecycle management to secure recurring revenue streams. Collaborative R&D partnerships with utilities, governments, and material science companies accelerate innovation in high-temperature alloys and cooling technologies.
Table of Contents
Chapter 1 Methodology & Scope
- 1.1 Research design
- 1.1.1 Research approach
- 1.1.2 Data collection methods
- 1.2 Base estimates and calculations
- 1.2.1 Base year calculation
- 1.2.2 Market estimates & forecast parameters
- 1.3 Forecast
- 1.3.1 Key trends for market estimates
- 1.3.2 Quantified market impact analysis
- 1.3.2.1 Mathematical impact of growth parameters on forecast
- 1.3.3 Scenario analysis framework
- 1.4 Primary research and validation
- 1.4.1 Some of the primary sources (but not limited to)
- 1.5 Data mining sources
- 1.5.1 Paid Sources
- 1.5.2 Sources, by region
- 1.6 Research trail & scoring components
- 1.6.1 Research trail components
- 1.6.2 Scoring components
- 1.7 Research transparency addendum
- 1.7.1 Source attribution framework
- 1.7.2 Quality assurance metrics
- 1.7.3 Our commitment to trust
- 1.8 Market definitions
Chapter 2 Executive Summary
- 2.1 Industry synopsis, 2022 - 2035
- 2.1.1 Business trends
- 2.1.2 Capacity trends
- 2.1.3 Product trends
- 2.1.4 Technology trends
- 2.1.5 Application trends
- 2.1.6 Regional trends
Chapter 3 Industry Insights
- 3.1 Industry ecosystem analysis
- 3.1.1 Raw material availability & sourcing analysis
- 3.1.2 Manufacturing capacity assessment
- 3.1.3 Supply chain resilience & risk factors
- 3.1.4 Distribution network analysis
- 3.2 Regulatory landscape
- 3.3 Industry impact forces
- 3.3.1 Growth drivers
- 3.3.2 Industry pitfalls & challenges
- 3.4 Growth potential analysis
- 3.5 Porter's analysis
- 3.5.1 Bargaining power of suppliers
- 3.5.2 Bargaining power of buyers
- 3.5.3 Threat of new entrants
- 3.5.4 Threat of substitutes
- 3.6 PESTEL analysis
- 3.6.1 Political factors
- 3.6.2 Economic factors
- 3.6.3 Social factors
- 3.6.4 Technological factors
- 3.6.5 Legal factors
- 3.6.6 Environmental factors
- 3.7 Cost structure analysis of gas turbines
- 3.8 Price trend analysis (USD/MW)
- 3.8.1 By region
- 3.8.2 By capacity
- 3.9 Market dynamics & emerging trends
- 3.10 Smart technologies & industry 4.0 adoption
- 3.11 Green initiatives & ESG strategies
- 3.12 Qualitative analysis on gas transportation infrastructure
- 3.13 Electricity generation trends from natural gas
- 3.14 Industry overview on alternative energy sources in power generation
- 3.15 Detailed analysis on role of natural gas in coal-to-gas transition
- 3.16 Global gas utilization overview
Chapter 4 Competitive Landscape, 2025
- 4.1 Introduction
- 4.2 Company market share analysis, by region, 2025
- 4.2.1 North America
- 4.2.2 Europe
- 4.2.3 Asia Pacific
- 4.2.4 Middle East & Africa
- 4.2.5 Latin America
- 4.3 Strategic dashboard
- 4.4 Strategic initiatives
- 4.4.1 Key partnerships & collaborations
- 4.4.2 Major M&A activities
- 4.4.3 Product innovations & launches
- 4.4.4 Market expansion strategies
- 4.5 Competitive benchmarking
- 4.6 Innovation & sustainability landscape
Chapter 5 Market Size and Forecast, By Capacity, 2022 - 2035 (USD Million & MW)
- 5.1 Key trends
- 5.2 ≤ 50 kW
- 5.3 > 50 kW to 500 kW
- 5.4 > 500 kW to 1 MW
- 5.5 > 1 MW to 30 MW
- 5.6 > 30 MW to 70 MW
- 5.7 > 70 MW to 200 MW
- 5.8 > 200 MW
Chapter 6 Market Size and Forecast, By Product, 2022 - 2035 (USD Million & MW)
- 6.1 Key trends
- 6.2 Aero-derivative
- 6.3 Heavy duty
Chapter 7 Market Size and Forecast, By Technology, 2022 - 2035 (USD Million & MW)
- 7.1 Key trends
- 7.2 Open cycle
- 7.3 Combined cycle
Chapter 8 Market Size and Forecast, By Application, 2022 - 2035 (USD Million & MW)
- 8.1 Key trends
- 8.2 Power plants
- 8.3 Oil & gas
- 8.4 Process plants
- 8.5 Aviation
- 8.6 Marine
- 8.7 Others
Chapter 9 Market Size and Forecast, By Region, 2022 - 2035 (USD Million & MW)
- 9.1 Key trends
- 9.2 North America
- 9.2.1 U.S.
- 9.2.2 Canada
- 9.2.3 Mexico
- 9.3 Europe
- 9.3.1 UK
- 9.3.2 France
- 9.3.3 Germany
- 9.3.4 Russia
- 9.3.5 Italy
- 9.3.6 Netherlands
- 9.3.7 Finland
- 9.3.8 Greece
- 9.3.9 Denmark
- 9.3.10 Romania
- 9.3.11 Poland
- 9.3.12 Sweden
- 9.4 Asia Pacific
- 9.4.1 China
- 9.4.2 Australia
- 9.4.3 Japan
- 9.4.4 India
- 9.4.5 South Korea
- 9.4.6 Indonesia
- 9.4.7 Thailand
- 9.4.8 Malaysia
- 9.4.9 Bangladesh
- 9.5 Middle East & Africa
- 9.5.1 Saudi Arabia
- 9.5.2 UAE
- 9.5.3 Qatar
- 9.5.4 Kuwait
- 9.5.5 Oman
- 9.5.6 Egypt
- 9.5.7 Turkey
- 9.5.8 Bahrain
- 9.5.9 Iraq
- 9.5.10 Jordan
- 9.5.11 Lebanon
- 9.5.12 South Africa
- 9.5.13 Nigeria
- 9.5.14 Algeria
- 9.5.15 Kenya
- 9.5.16 Ghana
- 9.6 Latin America
- 9.6.1 Brazil
- 9.6.2 Argentina
- 9.6.3 Peru
- 9.6.4 Chile
Chapter 10 Company Profiles
- 10.1 Ansaldo Energia
- 10.2 Baker Hughes
- 10.3 Bharat Heavy Electricals Limited
- 10.4 Capstone Green Energy
- 10.5 Destinus Energy
- 10.6 Doosan Enerbility
- 10.7 FlexEnergy Solutions
- 10.8 GE Vernova
- 10.9 Harbin Electric Corporation
- 10.10 IHI Corporation
- 10.11 Kawasaki Heavy Industries
- 10.12 MAN Energy Solutions
- 10.13 Mitsubishi Heavy Industries
- 10.14 Nanjing Steam Turbine Motor (Group)
- 10.15 Rolls-Royce
- 10.16 Shanghai Electric
- 10.17 Siemens Energy
- 10.18 Solar Turbines
- 10.19 Vericor
- 10.20 Wartsila
 2026年全球氫燃料相容燃氣渦輪機市場報告
 複合迴圈燃氣渦輪機市場:按燃料類型、渦輪機功率容量、運行模式、循環配置和最終用戶分類 - 全球市場預測(2026-2032 年)2026年全球氫能渦輪機改裝市場報告2026年全球火箭動力系統市場報告2026年全球軍用燃氣渦輪機市場報告燃氣渦輪機服務市場:按服務類型、渦輪機類型、額定功率、服務模式和最終用戶分類-2026-2032年全球市場預測
 燃氣渦輪機
燃氣渦輪機 複合循環 (CC)的全球市場 (以季度為基礎)泛氫燃氣渦輪機市場:按配置、容量、部署、燃料混合比、應用和最終用戶分類的全球預測,2026-2032年微型燃氣渦輪機發電機市場:按燃料類型、功率輸出、銷售管道、應用和最終用戶分類的全球預測(2026-2032年)