


 |
市場調查報告書
商品編碼
1892894
電動運輸工具市場機會、成長促進因素、產業趨勢分析及預測(2026-2035年)Electric Transporters Market Opportunity, Growth Drivers, Industry Trend Analysis, and Forecast 2026 - 2035 |
||||||
2025年全球電動運輸工具市場價值為5,79億美元,預計2035年將以8.2%的複合年成長率成長至1,209億美元。
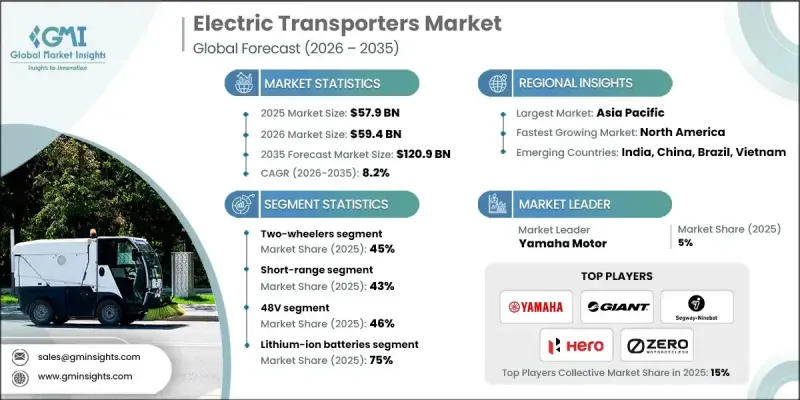
由於燃料成本上漲和傳統能源市場持續動盪,企業正穩步轉向電動出行。隨著油價逼近每桶80美元(預計還會上漲5美元),電動運輸工具正成為更具成本效益的替代方案,既能降低燃料成本,也能減少維護需求。這些車輛的整體擁有成本越來越低,尤其是在電力價格穩定或再生能源資源豐富的地區。主要城市人口的快速成長持續給城市道路網路帶來壓力,超過10億人仍然缺乏可靠的全天候道路。隨著交通堵塞日益嚴重,小型電動運輸工具正獲得越來越多的發展動力。電子商務的蓬勃發展加速了對用於最後一公里配送的電動貨運車輛的需求,而標準化資料格式和通訊協定的技術進步則提高了平台間的互通性。監管政策的不斷完善以及全球範圍內為加強安全性和相容性所做的努力,也正在加速電動運輸工具在消費者和商業應用場景中的普及。
| 市場範圍 | |
|---|---|
| 起始年份 | 2025 |
| 預測年份 | 2026-2035 |
| 起始值 | 579億美元 |
| 預測值 | 1209億美元 |
| 複合年成長率 | 8.2% |
2025年,二輪車細分市場佔據45%的市場佔有率,預計從2026年到2035年將以8.5%的複合年成長率成長。該細分市場引領電氣化進程,因為它需要相對較小的電池系統,這有助於在行業整體電池成本持續下降的情況下保持價格競爭力。
短程電動車市場在2025年佔據43%的佔有率,預計到2035年將以8.6%的最高成長率成長。這類車輛專為100公里以下的日常城市出行而設計,並可利用現有的充電基礎設施。其低成本、輕量化設計、操控性和易於停車等優點,吸引了通勤者以及專注於微出行和最後一公里配送的企業。
亞太地區電動交通工具市場在2025年佔了73%的市場佔有率,預計在2025年至2034年期間將以7.8%的複合年成長率成長。中國強勁的生產活動以及印度和東南亞市場日益成長的接受度繼續推動該地區的市場主導地位。中國約佔全球電動交通工具銷量的78%,這得益於消費者的廣泛接受、政府的支持以及龐大的產業產能。
目錄
第1章:方法論
第2章:執行概要
第3章:行業洞察
- 產業生態系分析
- 供應商格局
- 利潤率分析
- 成本結構
- 每個階段的價值增加
- 影響價值鏈的因素
- 中斷
- 產業影響因素
- 成長促進因素
- 都市化和交通堵塞
- 環境問題和監管支持
- 電子商務和物流的成長
- 電池技術的進步和成本的下降
- 燃油價格上漲和營運成本下降
- 產業陷阱與挑戰
- 充電基礎設施不足和里程焦慮
- 前期成本高,投資回收期長
- 市場機遇
- 拓展最後一公里配送解決方案
- 電池更換和快速充電基礎設施的發展
- 與智慧城市和城市交通計劃的融合
- 物流和公共運輸車隊電氣化
- 技術創新和模組化車輛設計
- 成長潛力分析
- 監管環境
- 全球監管概覽
- 北美監理框架
- 歐洲監管框架
- 亞太地區監理框架
- 拉丁美洲監管框架
- 中東和非洲監管框架
- 安全標準與認證
- 網路安全和資料隱私法規
- 環境與排放法規
- 監理合規成本分析
- 全球監管概覽
- 波特的分析
- PESTEL 分析
- 技術與創新格局
- 當前技術趨勢
- 電池技術
- 馬達技術
- 電力電子與控制系統
- 互聯互通與遠端資訊處理
- 充電基礎設施
- 新興技術
- 下一代電池技術
- 先進的充電技術
- 自動駕駛和ADAS功能
- 高級連結(新興)
- 車網互動(V2G)技術
- 當前技術趨勢
- 價格趨勢
- 按地區
- 依產品
- 生產統計
- 生產中心
- 消費中心
- 進出口
- 定價分析與市場經濟學
- 價格趨勢概述
- 按車輛類型定價
- 區域定價差異
- 電池成本對車輛定價的影響
- 總擁有成本 (TCO) 分析
- 政府激勵措施和補貼的影響
- 共享微出行定價模式
- 價格彈性分析
- 未來價格展望
- 成本細分分析
- 製造成本結構
- 研發成本分析
- 監理合規成本
- 分銷和物流成本
- 行銷和銷售成本
- 營運成本(共享出行)
- 充電基礎設施成本
- 保固及售後成本
- 成本削減路線圖
- 專利分析
- 永續性和環境方面
- 永續實踐
- 減少廢棄物策略
- 生產中的能源效率
- 環保舉措
- 碳足跡考量
- 最終使用者行為分析
- 消費者採納模式
- 使用模式和行程特徵
- 模式選擇與替代分析
- 購買決策因素
- 共享出行用戶行為
- 車隊營運決策
- 公車機構採購行為
- 安全意識與風險意識
- 品牌忠誠度與轉換行為
- 未來行為趨勢
- 風險評估與緩解框架
- 技術風險
- 監理與合規風險
- 供應鏈風險
- 市場和競爭風險
- 財務風險
- 營運風險(共享出行)
- 聲譽和品牌風險
- 環境與氣候風險
- 保險和責任風險
- 風險優先矩陣
- 未來展望與機遇
- 新興科技趨勢
- 監理演變及影響
- 商業模式創新
- 投資機會
- 策略建議
- 風險分析與緩解策略
- 情境分析
第4章:競爭格局
- 介紹
- 公司市佔率分析
- 北美洲
- 歐洲
- 亞太地區
- 拉丁美洲
- MEA
- 主要市場參與者的競爭分析
- 競爭定位矩陣
- 戰略展望矩陣
- 關鍵進展
- 併購
- 合作夥伴關係與合作
- 新產品發布
- 擴張計劃和資金
第5章:市場估算與預測:依電動車分類,2022-2035年
- 二輪車
- 電動自行車
- 電動滑板車
- 電動摩托車
- 三輪車
- 個人運輸工具
- 滑板
- 懸浮滑板
第6章:市場估算與預測:依電壓等級分類,2022-2035年
- 24伏
- 36伏
- 48伏
- 高於 48V
第7章:市場估計與預測:依電池類型分類,2022-2035年
- 鋰離子
- 鉛酸
- 鎳氫化物
- 固態
第8章:市場估算與預測:依區間分類,2022-2035年
- 短程(城市,≤100 公里/天)
- 中程(區域性,100-300公里/天)
- 遠程(≥300公里/天)
第9章:市場估算與預測:依應用領域分類,2022-2035年
- 微出行
- 共乘
- 貨運及貨物運輸
- 大眾運輸
- 個人休閒
- 其他
第10章:市場估計與預測:依最終用途分類,2022-2035年
- 個人購買
- 商業企業
- 政府和非營利組織買家
- 工業與物流
- 其他
第11章:市場估計與預測:按地區分類,2022-2035年
- 北美洲
- 美國
- 加拿大
- 歐洲
- 德國
- 英國
- 法國
- 義大利
- 西班牙
- 俄羅斯
- 北歐
- 葡萄牙
- 克羅埃西亞
- 亞太地區
- 中國
- 印度
- 日本
- 澳洲
- 韓國
- 新加坡
- 泰國
- 印尼
- 越南
- 拉丁美洲
- 巴西
- 墨西哥
- 阿根廷
- MEA
- 南非
- 沙烏地阿拉伯
- 阿拉伯聯合大公國
- 土耳其
第12章:公司簡介
- 全球參與者
- Accell
- Bosch eBike Systems
- BYD Company
- CATL (Contemporary Amperex Technology)
- Energica Motor Company
- NIU Technologies
- Proterra
- Segway Ninebot
- Yadea
- Zero Motorcycles
- 區域玩家
- Giant Manufacturing
- Harley-Davidson
- Nova Bus
- Stromer
- Gazelle
- Tern Bicycles
- Gogoro
- Ather Energy
- Hero Motorcorp
- Piaggio
- Emerging Technology Innovators
- Lime
- Aventon Bikes
- Tier Mobility
- BMW Motorrad
- Yamaha Motor
The Global Electric Transporters Market was valued at USD 57.9 billion in 2025 and is estimated to grow at a CAGR of 8.2% to reach USD 120.9 billion by 2035.
Businesses are steadily shifting toward electric mobility due to rising fuel costs and ongoing instability in conventional energy markets. As oil prices move toward USD 80 per barrel with an expected USD 5 per barrel increase, electric transporters are becoming cost-efficient alternatives that reduce both fuel spending and maintenance needs. These vehicles increasingly present a favorable total cost of ownership, particularly in regions with dependable electricity rates or strong access to renewable power. Rapid population growth in major cities continues to strain urban road networks, and more than 1 billion people still lack reliable all-weather roads. As traffic congestion worsens, compact electric transporters are gaining momentum. Expanding e-commerce is accelerating demand for electric cargo transporters used in last-mile delivery, while technological progress in standardized data formats and communication protocols is improving platform interoperability. Advancing regulatory clarity and global efforts to strengthen safety and compatibility are also helping accelerate adoption across consumer and commercial use cases.
| Market Scope | |
|---|---|
| Start Year | 2025 |
| Forecast Year | 2026-2035 |
| Start Value | $57.9 Billion |
| Forecast Value | $120.9 Billion |
| CAGR | 8.2% |
The two-wheeler segment held a 45% share in 2025 and is expected to grow at a CAGR of 8.5% from 2026 to 2035. This segment leads electrification because it requires relatively small battery systems, which helps sustain competitive pricing as industry-wide battery costs continue to decrease.
The short-range segment accounted for a 43% share in 2025 and is projected to grow at the highest rate of 8.6% through 2035. These vehicles are designed for daily urban trips under 100 km and make use of readily available charging infrastructure. Their lower cost, lightweight design, maneuverability, and ease of parking appeal to commuters and companies focused on micro-mobility and last-mile delivery.
Asia Pacific Electric Transporters Market captured 73% share in 2025 and is expected to grow at a CAGR of 7.8% throughout 2025-2034. Strong production activity in China and rising adoption in markets across India and Southeast Asia continue to influence regional dominance. China represents approximately 78% of global electric transporter sales volume, supported by widespread consumer acceptance, government-backed initiatives, and large-scale industry capacity.
Major companies in the Global Electric Transporters Market include Ather Energy, BMW Motorrad, Giant, Harley-Davidson, Hero MotoCorp, Niu Technologies, Segway Ninebot, Yadea Technology, Yamaha Motor, and Zero Motorcycles. Leading manufacturers are expanding their Electric Transporters Market presence by strengthening battery efficiency, improving motor performance, and prioritizing affordable product lines for urban users. Many companies are investing in modular platforms that allow them to scale models across multiple price tiers while optimizing production costs. Collaboration with charging infrastructure providers remains a core strategy as firms work to ensure convenient access to energy for users. Businesses are also forming alliances with fleet operators to increase adoption in commercial delivery applications. Continuous research in lightweight materials, safety systems, and digital connectivity helps brands differentiate their offerings. Manufacturers are further enhancing their reach by expanding global distribution networks and aligning with regional regulatory frameworks to accelerate certification and market entry.
Table of Contents
Chapter 1 Methodology
- 1.1 Market scope and definition
- 1.2 Research design
- 1.2.1 Research approach
- 1.2.2 Data collection methods
- 1.3 Data mining sources
- 1.3.1 Global
- 1.3.2 Regional/Country
- 1.4 Base estimates and calculations
- 1.4.1 Base year calculation
- 1.4.2 Key trends for market estimation
- 1.5 Primary research and validation
- 1.5.1 Primary sources
- 1.6 Forecast model
- 1.7 Research assumptions and limitations
Chapter 2 Executive Summary
- 2.1 Industry 3600 synopsis, 2022 - 2035
- 2.2 Key market trends
- 2.2.1 Regional
- 2.2.2 Electric Vehicle
- 2.2.3 Voltage
- 2.2.4 Battery
- 2.2.5 Range
- 2.2.6 Application
- 2.2.7 End Use
- 2.3 TAM Analysis, 2026-2035
- 2.4 CXO perspectives: Strategic imperatives
- 2.4.1 Executive decision points
- 2.4.2 Critical success factors
- 2.5 Future outlook and strategic recommendations
Chapter 3 Industry Insights
- 3.1 Industry ecosystem analysis
- 3.1.1 Supplier landscape
- 3.1.2 Profit margin analysis
- 3.1.3 Cost structure
- 3.1.4 Value addition at each stage
- 3.1.5 Factor affecting the value chain
- 3.1.6 Disruptions
- 3.2 Industry impact forces
- 3.2.1.1 Growth drivers
- 3.2.1.2 Urbanization and traffic congestion
- 3.2.1.3 Environmental concerns and regulatory support
- 3.2.1.4 Growth in e-commerce and logistics
- 3.2.1.5 Advances in battery technology and declining costs
- 3.2.1.6 Rising fuel prices and lower operating costs
- 3.2.2 Industry pitfalls and challenges
- 3.2.2.1 Limited charging infrastructure and range anxiety
- 3.2.2.2 High upfront costs and long payback period
- 3.2.3 Market opportunities
- 3.2.3.1 Expansion of last-mile delivery solutions
- 3.2.3.2 Development of battery-swapping and fast-charging infrastructure
- 3.2.3.3 Integration with smart city and urban mobility initiatives
- 3.2.3.4 Fleet electrification for logistics and public transport
- 3.2.3.5 Technological innovation and modular vehicle design
- 3.3 Growth potential analysis
- 3.4 Regulatory landscape
- 3.4.1 Global regulatory overview
- 3.4.1.1 North America regulatory framework
- 3.4.1.2 Europe regulatory framework
- 3.4.1.3 Asia Pacific regulatory framework
- 3.4.1.4 Latin America regulatory framework
- 3.4.1.5 Middle East & Africa regulatory framework
- 3.4.2 Safety standards & certifications
- 3.4.3 Cybersecurity & data privacy regulations
- 3.4.4 Environmental & emissions regulations
- 3.4.5 Regulatory compliance cost analysis
- 3.4.1 Global regulatory overview
- 3.5 Porter's analysis
- 3.6 PESTEL analysis
- 3.7 Technology and innovation landscape
- 3.7.1 Current technological trends
- 3.7.1.1 Battery technologies
- 3.7.1.2 Electric motor technologies
- 3.7.1.3 Power electronics & control systems
- 3.7.1.4 Connectivity & telematics
- 3.7.1.5 Charging infrastructure
- 3.7.2 Emerging technologies
- 3.7.2.1 Next-generation battery technologies
- 3.7.2.2 Advanced charging technologies
- 3.7.2.3 Autonomous & ADAS features
- 3.7.2.4 Advanced connectivity (emerging)
- 3.7.2.5 Vehicle-to-grid (V2G) technologies
- 3.7.1 Current technological trends
- 3.8 Price trends
- 3.8.1 By region
- 3.8.2 By product
- 3.9 Production statistics
- 3.9.1 Production hubs
- 3.9.2 Consumption hubs
- 3.9.3 Export and import
- 3.10 Pricing analysis & market economics
- 3.10.1 Pricing trends overview
- 3.10.2 Pricing by vehicle type
- 3.10.3 Regional pricing variations
- 3.10.4 Battery cost impact on vehicle pricing
- 3.10.5 Total cost of ownership (TCO) analysis
- 3.10.6 Government incentives & subsidies impact
- 3.10.7 Shared micromobility pricing models
- 3.10.8 Pricing elasticity analysis
- 3.10.9 Future pricing outlook
- 3.11 Cost breakdown analysis
- 3.11.1 Manufacturing cost structure
- 3.11.2 R&D cost analysis
- 3.11.3 Regulatory compliance costs
- 3.11.4 Distribution & logistics costs
- 3.11.5 Marketing & sales costs
- 3.11.6 Operational costs (shared mobility)
- 3.11.7 Charging infrastructure costs
- 3.11.8 Warranty & aftersales costs
- 3.11.9 Cost reduction roadmap
- 3.12 Patent analysis
- 3.13 Sustainability and environmental aspects
- 3.13.1 Sustainable practices
- 3.13.2 Waste reduction strategies
- 3.13.3 Energy efficiency in production
- 3.13.4 Eco-friendly Initiatives
- 3.13.5 Carbon footprint considerations
- 3.14 End use behavior analysis
- 3.14.1 Consumer adoption patterns
- 3.14.2 Usage patterns & trip characteristics
- 3.14.3 Mode choice & substitution analysis
- 3.14.4 Purchase decision factors
- 3.14.5 Shared mobility user behavior
- 3.14.6 Fleet operator decision-making
- 3.14.7 Transit agency procurement behavior
- 3.14.8 Safety perception & risk awareness
- 3.14.9 Brand loyalty & switching behavior
- 3.14.10 Future behavior trends
- 3.15 Risk assessment & mitigation framework
- 3.15.1 Technology risks
- 3.15.2 Regulatory & compliance risks
- 3.15.3 Supply chain risks
- 3.15.4 Market & competitive risks
- 3.15.5 Financial risks
- 3.15.6 Operational risks (shared mobility)
- 3.15.7 Reputational & brand risks
- 3.15.8 Environmental & climate risks
- 3.15.9 Insurance & liability risks
- 3.15.10 Risk prioritization matrix
- 3.16 Future outlook & opportunities
- 3.16.1 Emerging technology trends
- 3.16.2 Regulatory evolution & impact
- 3.16.3 Business model innovation
- 3.16.4 Investment opportunities
- 3.16.5 Strategic recommendations
- 3.16.6 Risk analysis & mitigation strategies
- 3.16.7 Scenario analysis
Chapter 4 Competitive Landscape, 2025
- 4.1 Introduction
- 4.2 Company market share analysis
- 4.2.1 North America
- 4.2.2 Europe
- 4.2.3 Asia Pacific
- 4.2.4 LATAM
- 4.2.5 MEA
- 4.3 Competitive analysis of major market players
- 4.4 Competitive positioning matrix
- 4.5 Strategic outlook matrix
- 4.6 Key developments
- 4.6.1 Mergers & acquisitions
- 4.6.2 Partnerships & collaborations
- 4.6.3 New Product Launches
- 4.6.4 Expansion Plans and funding
Chapter 5 Market Estimates & Forecast, By Electric Vehicle, 2022 - 2035 (USD Mn, Units)
- 5.1 Key trends
- 5.2 Two-wheelers
- 5.2.1 E-bikes
- 5.2.2 E-scooters
- 5.2.3 Electric motorcycles
- 5.3 Three-wheelers
- 5.4 Personal transporters
- 5.4.1 Skateboards
- 5.4.2 Hoverboards
Chapter 6 Market Estimates & Forecast, By Voltage, 2022 - 2035 (USD Mn, Units)
- 6.1 Key trends
- 6.2 24V
- 6.3 36V
- 6.4 48V
- 6.5 Above 48V
Chapter 7 Market Estimates & Forecast, By Battery, 2022 - 2035 (USD Mn, Units)
- 7.1 Key trends
- 7.2 Lithium-ion
- 7.3 Lead-acid
- 7.4 Nickel-metal hydride
- 7.5 Solid state
Chapter 8 Market Estimates & Forecast, By Range, 2022 - 2035 (USD Mn, Units)
- 8.1 Key trends
- 8.2 Short-range (urban, ≤100 km / day)
- 8.3 Mid-range (regional, 100-300 km / day)
- 8.4 Long-range (≥300 km / day)
Chapter 9 Market Estimates & Forecast, By Application, 2022 - 2035 (USD Mn, Units)
- 9.1 Key trends
- 9.2 Micro-mobility
- 9.3 Ridesharing
- 9.4 Freight & cargo transport
- 9.5 Public transport
- 9.6 Personal leisure
- 9.7 Others
Chapter 10 Market Estimates & Forecast, By End Use, 2022 - 2035 (USD Mn, Units)
- 10.1 Key trends
- 10.2 Personal purchase
- 10.3 Commercial enterprises
- 10.4 Government & Non-Profit Buyers
- 10.5 Industrial & Logistics
- 10.6 Others
Chapter 11 Market Estimates & Forecast, By Region, 2022 - 2035 (USD Mn, Units)
- 11.1 Key trends
- 11.2 North America
- 11.2.1 US
- 11.2.2 Canada
- 11.3 Europe
- 11.3.1 Germany
- 11.3.2 UK
- 11.3.3 France
- 11.3.4 Italy
- 11.3.5 Spain
- 11.3.6 Russia
- 11.3.7 Nordics
- 11.3.8 Portugal
- 11.3.9 Croatia
- 11.4 Asia Pacific
- 11.4.1 China
- 11.4.2 India
- 11.4.3 Japan
- 11.4.4 Australia
- 11.4.5 South Korea
- 11.4.6 Singapore
- 11.4.7 Thailand
- 11.4.8 Indonesia
- 11.4.9 Vietnam
- 11.5 Latin America
- 11.5.1 Brazil
- 11.5.2 Mexico
- 11.5.3 Argentina
- 11.6 MEA
- 11.6.1 South Africa
- 11.6.2 Saudi Arabia
- 11.6.3 UAE
- 11.6.4 Turkey
Chapter 12 Company Profiles
- 12.1 Global Players
- 12.1.1 Accell
- 12.1.2 Bosch eBike Systems
- 12.1.3 BYD Company
- 12.1.4 CATL (Contemporary Amperex Technology)
- 12.1.5 Energica Motor Company
- 12.1.6 NIU Technologies
- 12.1.7 Proterra
- 12.1.8 Segway Ninebot
- 12.1.9 Yadea
- 12.1.10 Zero Motorcycles
- 12.2 Regional Players
- 12.2.1 Giant Manufacturing
- 12.2.2 Harley-Davidson
- 12.2.3 Nova Bus
- 12.2.4 Stromer
- 12.2.5 Gazelle
- 12.2.6 Tern Bicycles
- 12.2.7 Gogoro
- 12.2.8 Ather Energy
- 12.2.9 Hero Motorcorp
- 12.2.10 Piaggio
- 12.3 Emerging Technology Innovators
- 12.3.1 Lime
- 12.3.2 Aventon Bikes
- 12.3.3 Tier Mobility
- 12.3.4 BMW Motorrad
- 12.3.5 Yamaha Motor
 電動車市場分析及預測(至2035年):依類型、產品類型、服務、技術、組件、應用、部署、設備及最終用戶分類
 2026年全球電動旅遊網路市場報告
 綠色交通走廊市場預測至2034年-按運輸方式、技術、應用和區域分類的全球分析
 電動運輸設備市場規模、佔有率、成長及全球產業分析:按類型、應用和地區分類的洞察,2026-2034 年預測全球電動交通設備市場規模、佔有率、趨勢和成長分析報告(2026-2034年)2026年全球智慧電動自行車電池租賃市場報告
 電動車市場-全球產業規模、佔有率、趨勢、機會、預測:按產品類型、電壓類型、電池類型、地區和競爭格局分類,2021-2031年
 廂型車和運輸車市場:2026-2032年全球預測(按車輛類型、負載容量、乘客容量、動力傳動系統、軸距、應用和銷售管道)全球電動交通可靠性工程市場:未來預測(至2032年)-依可靠性功能、運輸模式、系統層、應用、最終用戶和地區進行分析城市交通和低碳交通市場預測至2032年:按模式、基礎設施、技術、應用、最終用戶和區域分類的全球分析