


 |
市場調查報告書
商品編碼
1892892
自動駕駛汽車市場機會、成長促進因素、產業趨勢分析及預測(2026-2035年)Autonomous Vehicle Market Opportunity, Growth Drivers, Industry Trend Analysis, and Forecast 2026 - 2035 |
||||||
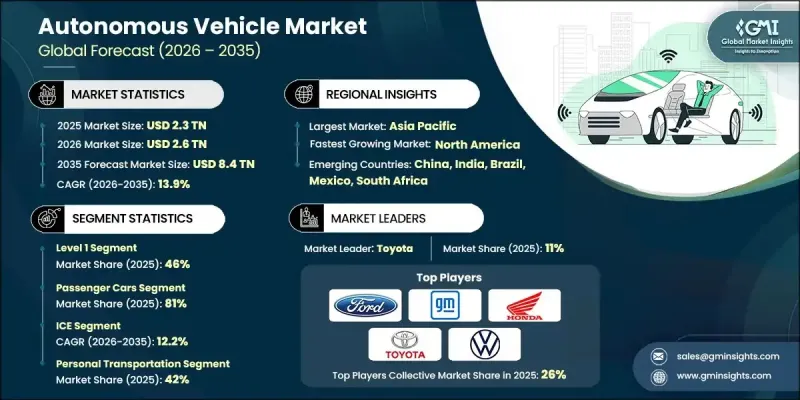
2025年全球自動駕駛汽車市場價值為2.3兆美元,預計2035年將以13.9%的複合年成長率成長至8.4兆美元。
模擬市場正成為開發、驗證和完善自動駕駛系統的重要支柱。這些模擬技術能夠創造可控、可重複且高度可擴展的虛擬環境,使開發人員能夠分析車輛在各種複雜駕駛場景下的反應。汽車製造商、技術供應商和研究機構在自動駕駛汽車開發的整個生命週期中越來越依賴模擬技術,以滿足嚴格的性能、安全性和監管要求。人工智慧、機器學習和運算基礎設施的持續進步也提升了這些平台的深度和精度。現今的仿真環境涵蓋了從精細環境建模到雲端仿真,以及支援完整端到端測試工作流程的擴展開發流程。隨著半自動駕駛系統的日益成熟,模擬工具在研究人機互動、預測駕駛員反應和評估協同決策方面發揮著至關重要的作用,而這需要更豐富、更分層的虛擬評估。
| 市場範圍 | |
|---|---|
| 起始年份 | 2025 |
| 預測年份 | 2026-2035 |
| 起始值 | 2.3兆美元 |
| 預測值 | 8.4兆美元 |
| 複合年成長率 | 13.9% |
2025年,L1級自動駕駛系統市佔率達到46%,預計2026年至2035年間將以13%的複合年成長率成長。該細分市場的強勁表現得益於監管部門的支持以及其在大眾市場車輛中的廣泛應用。 L1級系統提供單一功能的駕駛輔助,例如自適應巡航控制和車道維持輔助,但需要駕駛者保持高度注意力。隨著監管機構對車輛安全的日益重視,以及保險資料顯示事故風險降低,預計將創造巨大的成長機遇,到2035年,L1級自動駕駛系統市場規模預計將達到3.69兆美元。
2025年,乘用車市佔率佔比達到81%,預計到2035年將以12.6%的複合年成長率成長。其市場主導地位主要歸功於L1和L2級高階駕駛輔助系統(ADAS)的廣泛應用,目前已開發地區超過70%的新車都標配了這些系統。政府強制政策、安全性能的提升以及這些技術在中高階車型中日益普及,正在加速消費者對輔助駕駛的接受度,使其成為全球主流功能。
預計到2025年,美國自動駕駛汽車市場規模將達到4,102億美元。該地區的企業正在利用人工智慧和機器學習技術來提升車輛安全性、改善交通預測,並在複雜的城市和高速公路環境中實現更智慧的決策。大型科技公司和創新新創公司都在探索將自動駕駛汽車應用於叫車和配送服務等領域,為城市出行提供經濟高效、可擴展的解決方案,並變革交通運輸營運模式。
目錄
第1章:方法論
第2章:執行概要
第3章:行業洞察
- 產業生態系分析
- 供應商格局
- 利潤率
- 成本結構
- 每個階段的價值增加
- 影響價值鏈的因素
- 中斷
- 產業影響因素
- 成長促進因素
- 對道路安全的需求日益成長
- 人工智慧和感測器技術的進步
- 政府法規和激勵措施
- 不斷發展的共乘和出行服務
- 產業陷阱與挑戰
- 監管和法律方面的不確定性
- 高昂的研發與部署成本
- 市場機遇
- 城市交通解決方案的擴展
- 與科技新創公司和原始設備製造商合作
- 自動駕駛車隊的數據貨幣化
- 與智慧城市基礎建設的融合
- 成長促進因素
- 成長潛力分析
- 監管環境
- 全球的
- 聯合國歐洲經濟委員會WP.29框架與工作小組
- 聯合國第155號條例
- 聯合國第156號條例
- 聯合國第157號條例
- 北美洲
- 美國聯邦框架
- 美國國家公路交通安全管理局 (NHTSA) 自動駕駛車輛政策與指南
- 歐洲
- 歐盟型式認可條例 2019/2144
- 車輛一般安全條例(GSR)
- 亞太地區
- 中國工信部和國家發展改革委員會國家戰略
- 中國智慧網聯汽車標準
- 拉丁美洲
- 中東和非洲
- 全球的
- 波特的分析
- PESTEL 分析
- 技術與創新格局
- 當前技術趨勢
- LiDAR技術(機械式、固態式、FMCW)
- 雷達技術(77-79 GHz,4D成像雷達)
- V2X 通訊協定
- 5G網路整合
- 新興技術
- 調頻連續波(FMCW)雷射雷達
- 具有高度探測功能的 4D 成像雷達
- 熱成像及紅外線攝影機
- 硬體安全模組(HSM)
- 當前技術趨勢
- 定價分析
- 組件定價趨勢
- 車輛增加成本分析
- 服務定價模式
- 生產統計
- 生產中心
- 消費中心
- 進出口
- 成本細分分析
- 自動駕駛汽車系統成本結構
- 製造和生產成本
- 營運成本分析
- 研發投資需求
- 價值鏈利潤分析
- 專利分析
- 全球專利申請趨勢
- 按技術領域分類的專利分佈
- 領先的專利持有者和創新領導者
- IP活動的地理分佈
- 永續性和環境方面
- 永續實踐
- 減少廢棄物策略
- 生產中的能源效率
- 環保舉措
- 碳足跡考量
- 投資與融資分析
- 創投與私募股權投資趨勢
- 企業投資與策略收購
- 併購活動及估值倍數
- 各國政府資助研發項目
- 最終使用者行為及採納分析
- 消費者乘用車細分市場
- 商業車隊營運商的行為
- 叫車和行動支付用戶行為
- 配送服務最終用戶行為
- 工業及非道路最終用途行為
- 風險評估與緩解框架
- 技術風險
- 網路安全風險
- 安全與責任風險
- 監理和政策風險
- 供應鏈風險
第4章:競爭格局
- 介紹
- 公司市佔率分析
- 北美洲
- 歐洲
- 亞太地區
- 拉丁美洲
- MEA
- 主要市場參與者的競爭分析
- 競爭定位矩陣
- 戰略展望矩陣
- 關鍵進展
- 併購
- 合作夥伴關係與合作
- 新產品發布
- 擴張計劃和資金
第5章:市場估計與預測:依自主程度分類,2022-2035年
- 一級
- 二級
- 3級
- 4級
- 5級
第6章:市場估價與預測:依車輛類型分類,2022-2035年
- 搭乘用車
- SUV
- 轎車
- 掀背車
- 商用車輛
- 輕型商用車(LCV)
- 中型商用車(MCV)
- 重型商用車(HCV)
第7章:市場估算與預測:依燃料類型分類,2022-2035年
- 冰
- 電的
- 混合
第8章:市場估算與預測:依應用領域分類,2022-2035年
- 個人交通工具
- 大眾運輸
- 貨物運輸
- 工業應用
- 其他
第9章:市場估算與預測:依感測器類型分類,2022-2035年
- LiDAR
- 雷達
- 相機
- 超音波感測器
- GPS/IMU系統
第10章:市場估計與預測:依地區分類,2022-2035年
- 北美洲
- 美國
- 加拿大
- 歐洲
- 德國
- 英國
- 法國
- 義大利
- 西班牙
- 北歐
- 俄羅斯
- 波蘭
- 羅馬尼亞
- 亞太地區
- 中國
- 印度
- 日本
- 韓國
- 澳新銀行
- 越南
- 印尼
- 拉丁美洲
- 巴西
- 墨西哥
- 阿根廷
- MEA
- 南非
- 沙烏地阿拉伯
- 阿拉伯聯合大公國
第11章:公司簡介
- 全球公司
- Toyota
- Volkswagen
- General Motors
- Tesla
- BMW
- Mercedes-Benz
- Ford
- Nissan
- Honda
- Hyundai
- Waymo (Alphabet)
- 區域冠軍
- Aurora Innovation
- AutoX
- Einride
- Motional (Hyundai-Aptiv JV)
- Oxbotica
- Plus (Formerly Plus.ai)
- Pony.ai
- Wayve Technologies
- WeRide
- Zoox
- 新興玩家
- Beep
- EasyMile SAS
- Gatik
- Ghost Autonomy
- Helm.ai
- Kodiak Robotics
- May Mobility
- Navya
- Nuro
The Global Autonomous Vehicle Market was valued at USD 2.3 trillion in 2025 and is estimated to grow at a CAGR of 13.9% to reach USD 8.4 trillion by 2035.
This market is becoming a fundamental pillar in developing, validating, and refining autonomous driving systems. These simulation technologies create controlled, repeatable, and highly scalable virtual settings that allow developers to analyze how vehicles react to a wide range of complex driving scenarios. Automakers, technology providers, and research organizations increasingly depend on simulation throughout the entire lifecycle of autonomous vehicle development as they work to meet strict performance, safety, and regulatory requirements. Continuous progress in artificial intelligence, machine learning, and computing infrastructure is also improving the depth and accuracy of these platforms. Today's simulation environments span from detailed environment modeling to cloud-enabled simulations and expanded development pipelines that support full end-to-end testing workflows. As semi-autonomous systems mature, simulation tools play a crucial role in studying human-machine interaction, forecasting driver reactions, and evaluating shared decision-making, which requires richer, layered virtual assessments.
| Market Scope | |
|---|---|
| Start Year | 2025 |
| Forecast Year | 2026-2035 |
| Start Value | $2.3 Trillion |
| Forecast Value | $8.4 Trillion |
| CAGR | 13.9% |
The Level 1 segment held a 46% share in 2025 and is projected to grow at a CAGR of 13% between 2026 and 2035. This segment's strong performance is driven by regulatory support and its widespread adoption in mass-market vehicles. Level 1 systems offer single-function driver assistance, such as adaptive cruise control and lane-keeping support, while requiring the driver to remain fully attentive. Increasing regulatory focus on vehicle safety, along with insurance data highlighting reduced accident risks, is expected to create significant growth opportunities, with the Level 1 market projected to reach USD 3.69 trillion by 2035.
The passenger car segment accounted for an 81% share in 2025 and is expected to grow at a CAGR of 12.6% through 2035. Its dominance is due to the widespread integration of Level 1 and Level 2 advanced driver-assistance systems (ADAS), which are now standard in over 70% of new vehicles in developed regions. Government mandates, enhanced safety benefits, and increasing availability of these technologies across premium and mid-range vehicles are accelerating consumer acceptance of assisted driving, making it a mainstream feature globally.
U.S. Autonomous Vehicle Market reached USD 410.2 billion in 2025. Companies in the region are leveraging artificial intelligence and machine learning to enhance vehicle safety, improve traffic prediction, and enable smarter decision-making in complex urban and highway environments. Both major tech firms and innovative startups are exploring autonomous vehicles for applications such as ride-hailing and delivery services, offering cost-efficient, scalable solutions for urban mobility and transforming transportation operations.
Key companies active in the Global Autonomous Vehicle Market include aiMotive, Altair, Ansys, Dassault, Foretellix, Hexagon AB, IPG Automotive, LG, Mechanical Simulation, and Siemens. Companies in this market are reinforcing their competitive edge by enhancing simulation realism, building higher-fidelity digital twins, and integrating AI-driven analytics that improve scenario generation and automated validation. Many are expanding cloud-based platforms to support scalable testing for global teams, while still offering secure on-premises systems for customers with strict data governance needs. Vendors are also forming partnerships with OEMs, Tier 1 suppliers, and sensor manufacturers to create unified testing ecosystems that replicate full-vehicle behavior. Continuous updates that incorporate new driving regulations, road environments, and edge-case libraries help strengthen long-term customer reliance on their platforms.
Table of Contents
Chapter 1 Methodology
- 1.1 Market scope and definition
- 1.2 Research design
- 1.2.1 Research approach
- 1.2.2 Data collection methods
- 1.3 Data mining sources
- 1.3.1 Global
- 1.3.2 Regional/Country
- 1.4 Base estimates and calculations
- 1.4.1 Base year calculation
- 1.4.2 Key trends for market estimation
- 1.5 Primary research and validation
- 1.5.1 Primary sources
- 1.6 Forecast model
- 1.7 Research assumptions and limitations
Chapter 2 Executive Summary
- 2.1 Industry 3600 synopsis
- 2.2 Key market trends
- 2.2.1 Regional
- 2.2.2 Level of autonomy
- 2.2.3 Vehicle
- 2.2.4 Fuel
- 2.2.5 Application
- 2.2.6 Sensor
- 2.3 TAM analysis, 2026-2035
- 2.4 CXO perspectives: Strategic imperatives
- 2.4.1 Executive decision points
- 2.4.2 Critical success factors
- 2.5 Future outlook
- 2.6 Strategic recommendations
Chapter 3 Industry Insights
- 3.1 Industry ecosystem analysis
- 3.1.1 Supplier landscape
- 3.1.2 Profit margin
- 3.1.3 Cost structure
- 3.1.4 Value addition at each stage
- 3.1.5 Factor affecting the value chain
- 3.1.6 Disruptions
- 3.2 Industry impact forces
- 3.2.1 Growth drivers
- 3.2.1.1 Increasing demand for road safety
- 3.2.1.2 Advances in AI and sensor technologies
- 3.2.1.3 Government regulations and incentives
- 3.2.1.4 Growing ridesharing and mobility services
- 3.2.2 Industry pitfalls and challenges
- 3.2.2.1 Regulatory and legal uncertainties
- 3.2.2.2 High R&D and deployment costs
- 3.2.3 Market opportunities
- 3.2.3.1 Expansion in urban mobility solutions
- 3.2.3.2 Collaboration with tech startups and OEMs
- 3.2.3.3 Data monetization from autonomous fleets
- 3.2.3.4 Integration with smart city infrastructure
- 3.2.1 Growth drivers
- 3.3 Growth potential analysis
- 3.4 Regulatory landscape
- 3.4.1 Global
- 3.4.1.1 UNECE WP.29 framework & working groups
- 3.4.1.2 UN Regulation 155
- 3.4.1.3 UN Regulation 156
- 3.4.1.4 UN Regulation 157
- 3.4.2 North America
- 3.4.2.1 United States federal framework
- 3.4.2.2 NHTSA automated vehicles policy & guidance
- 3.4.3 Europe
- 3.4.3.1 EU Type-Approval Regulation 2019/2144
- 3.4.3.2 Vehicle General Safety Regulation (GSR)
- 3.4.4 Asia Pacific
- 3.4.4.1 China MIIT & NDRC National Strategy
- 3.4.4.2 China Intelligent & Connected Vehicle Standards
- 3.4.5 Latin America
- 3.4.6 Middle East & Africa
- 3.4.1 Global
- 3.5 Porter's analysis
- 3.6 PESTEL analysis
- 3.7 Technology and innovation landscape
- 3.7.1 Current technological trends
- 3.7.1.1 LiDAR Technology (Mechanical, Solid-State, FMCW)
- 3.7.1.2 Radar Technology (77-79 GHz, 4D Imaging Radar)
- 3.7.1.3 V2X communication protocols
- 3.7.1.4 5G network integration
- 3.7.2 Emerging technologies
- 3.7.2.1 Frequency-modulated continuous wave (FMCW) LiDAR
- 3.7.2.2 4D imaging radar with elevation detection
- 3.7.2.3 Thermal & infrared cameras
- 3.7.2.4 Hardware security modules (HSM)
- 3.7.1 Current technological trends
- 3.8 Pricing analysis
- 3.8.1.1 Component pricing trends
- 3.8.1.2 Vehicle incremental cost analysis
- 3.8.1.3 Service pricing models
- 3.9 Production statistics
- 3.9.1 Production hubs
- 3.9.2 Consumption hubs
- 3.9.3 Export and import
- 3.10 Cost breakdown analysis
- 3.10.1 Autonomous vehicle system cost structure
- 3.10.2 Manufacturing & production costs
- 3.10.3 Operating cost analysis
- 3.10.4 R&D investment requirements
- 3.10.5 Value chain margin analysis
- 3.11 Patent analysis
- 3.11.1 Global patent filing trends
- 3.11.2 Patent distribution by technology domain
- 3.11.3 Leading patent holders & innovation leaders
- 3.11.4 Geographic distribution of IP activity
- 3.12 Sustainability and environmental aspects
- 3.12.1 Sustainable practices
- 3.12.2 Waste reduction strategies
- 3.12.3 Energy efficiency in production
- 3.12.4 Eco-friendly initiatives
- 3.12.5 Carbon footprint considerations
- 3.13 Investment & funding analysis
- 3.13.1 Venture capital & private equity investment trends
- 3.13.2 Corporate investment & strategic acquisitions
- 3.13.3 M&A activity & valuation multiples
- 3.13.4 Government funding & R&D programs by country
- 3.14 End use behavior & adoption analysis
- 3.14.1 Consumer passenger vehicle segment
- 3.14.2 Commercial fleet operator behavior
- 3.14.3 Ride-hailing & maas user behavior
- 3.14.4 Delivery service End use behavior
- 3.14.5 Industrial & off-road End use behavior
- 3.15 Risk assessment & mitigation framework
- 3.15.1 Technology risks
- 3.15.2 Cybersecurity risks
- 3.15.3 Safety & liability risks
- 3.15.4 Regulatory & policy risks
- 3.15.5 Supply chain risks
Chapter 4 Competitive Landscape, 2025
- 4.1 Introduction
- 4.2 Company market share analysis
- 4.2.1 North America
- 4.2.2 Europe
- 4.2.3 Asia Pacific
- 4.2.4 LATAM
- 4.2.5 MEA
- 4.3 Competitive analysis of major market players
- 4.4 Competitive positioning matrix
- 4.5 Strategic outlook matrix
- 4.6 Key developments
- 4.6.1 Mergers & acquisitions
- 4.6.2 Partnerships & collaborations
- 4.6.3 New product launches
- 4.6.4 Expansion plans and funding
Chapter 5 Market Estimates & Forecast, By Level of Autonomy, 2022 - 2035 ($Bn, Units)
- 5.1 Key trends
- 5.2 Level 1
- 5.3 Level 2
- 5.4 Level 3
- 5.5 Level 4
- 5.6 Level 5
Chapter 6 Market Estimates & Forecast, By Vehicle, 2022 - 2035 ($Bn, Units)
- 6.1 Key trends
- 6.2 Passenger cars
- 6.2.1 SUV
- 6.2.2 Sedan
- 6.2.3 Hatchback
- 6.3 Commercial vehicles
- 6.3.1 Light commercial vehicles (LCV)
- 6.3.2 Medium commercial vehicles (MCV)
- 6.3.3 Heavy commercial vehicles (HCV)
Chapter 7 Market Estimates & Forecast, By Fuel, 2022 - 2035 ($Bn, Units)
- 7.1 Key trends
- 7.2 ICE
- 7.3 Electric
- 7.4 Hybrid
Chapter 8 Market Estimates & Forecast, By Application, 2022 - 2035 ($Bn, Units)
- 8.1 Key trends
- 8.2 Personal transportation
- 8.3 Public transportation
- 8.4 Goods transportation
- 8.5 Industrial applications
- 8.6 Others
Chapter 9 Market Estimates & Forecast, By Sensor, 2022 - 2035 ($Bn, Units)
- 9.1 Key trends
- 9.2 LiDAR
- 9.3 Radar
- 9.4 Cameras
- 9.5 Ultrasonic sensors
- 9.6 GPS/IMU systems
Chapter 10 Market Estimates & Forecast, By Region, 2022 - 2035 ($Bn, Units)
- 10.1 Key trends
- 10.2 North America
- 10.2.1 US
- 10.2.2 Canada
- 10.3 Europe
- 10.3.1 Germany
- 10.3.2 UK
- 10.3.3 France
- 10.3.4 Italy
- 10.3.5 Spain
- 10.3.6 Nordics
- 10.3.7 Russia
- 10.3.8 Poland
- 10.3.9 Romania
- 10.4 Asia Pacific
- 10.4.1 China
- 10.4.2 India
- 10.4.3 Japan
- 10.4.4 South Korea
- 10.4.5 ANZ
- 10.4.6 Vietnam
- 10.4.7 Indonesia
- 10.5 Latin America
- 10.5.1 Brazil
- 10.5.2 Mexico
- 10.5.3 Argentina
- 10.6 MEA
- 10.6.1 South Africa
- 10.6.2 Saudi Arabia
- 10.6.3 UAE
Chapter 11 Company Profiles
- 11.1 Global companies
- 11.1.1 Toyota
- 11.1.2 Volkswagen
- 11.1.3 General Motors
- 11.1.4 Tesla
- 11.1.5 BMW
- 11.1.6 Mercedes-Benz
- 11.1.7 Ford
- 11.1.8 Nissan
- 11.1.9 Honda
- 11.1.10 Hyundai
- 11.1.11 Waymo (Alphabet)
- 11.2 Regional Champions
- 11.2.1 Aurora Innovation
- 11.2.2 AutoX
- 11.2.3 Einride
- 11.2.4 Motional (Hyundai-Aptiv JV)
- 11.2.5 Oxbotica
- 11.2.6 Plus (Formerly Plus.ai)
- 11.2.7 Pony.ai
- 11.2.8 Wayve Technologies
- 11.2.9 WeRide
- 11.2.10 Zoox
- 11.3 Emerging players
- 11.3.1 Beep
- 11.3.2 EasyMile SAS
- 11.3.3 Gatik
- 11.3.4 Ghost Autonomy
- 11.3.5 Helm.ai
- 11.3.6 Kodiak Robotics
- 11.3.7 May Mobility
- 11.3.8 Navya
- 11.3.9 Nuro
 全球國防機器人與自動駕駛車輛市場:2026-2036 年
 人工智慧(AI)在自動駕駛汽車領域的市場:未來預測(至2034年)-按組件、自動駕駛等級、車輛類型、類別、應用、最終用戶和地區進行分析
 自動駕駛汽車市場:2026-2032年全球市場預測(依自動駕駛等級、動力系統、技術、最終用戶和車輛類型分類)
 2026年全球衛星港口營運監控市場報告2034年全球自動駕駛物流車輛市場預測-按車輛類型、組件、導航技術、自動駕駛等級、應用、最終用戶和地區分類的全球分析2034年自主港口營運市場預測:按自動化程度、設備類型、技術、應用、最終用戶和地區分類的全球分析
 自動駕駛汽車市場規模、佔有率、成長及全球產業分析:按類型、應用和地區分類,並預測至2026-2034年自動駕駛汽車市場:按組件、自動駕駛等級、燃料類型、技術、應用、車輛類型和最終用戶分類-2026-2032年全球市場預測2026年全球機器人車輛市場報告2026年全球自主港口操作系統市場報告