


 |
市場調查報告書
商品編碼
1892820
蒸汽渦輪機市場機會、成長促進因素、產業趨勢分析及預測(2026-2035年)Steam Turbine Market Opportunity, Growth Drivers, Industry Trend Analysis, and Forecast 2026 - 2035 |
||||||
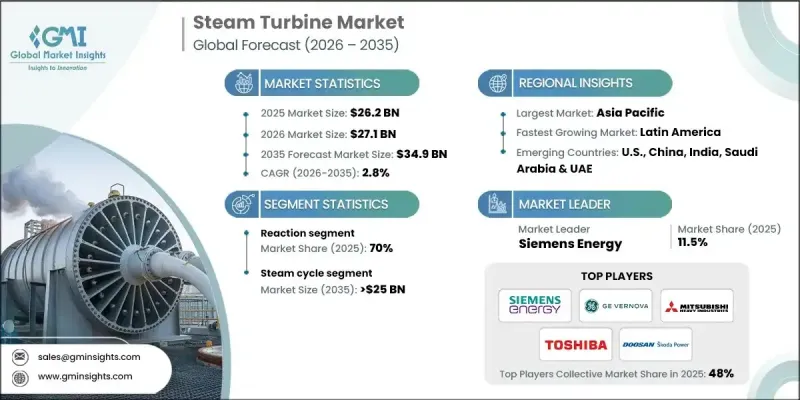
2025年全球蒸汽渦輪機市場價值為262億美元,預計到2035年將以2.8%的複合年成長率成長至349億美元。
市場擴張的驅動力來自對可靠高效電力日益成長的需求,以及新建電廠和現有能源基礎設施的現代化改造。蒸汽渦輪機將高壓蒸汽轉化為旋轉機械能,使其成為工業發電不可或缺的一部分。不斷成長的工業用電需求、熱電聯產系統的廣泛應用以及先進控制技術的整合,都促進了新汽輪機的安裝。為支持大規模發電而日益成長的大容量機組需求進一步鞏固了市場成長。工業化、重工業擴張和熱電聯產的併網持續影響需求模式。能源轉型政策正在影響汽輪機的部署,生質能能和地熱項目等再生能源應用因其高熱效率和可靠性而為汽輪機提供了發展機會。化工、石化、煉油和區域供熱等行業越來越依賴汽輪機來實現高效的電力和熱力管理。
| 市場範圍 | |
|---|---|
| 起始年份 | 2025 |
| 預測年份 | 2026-2035 |
| 起始值 | 262億美元 |
| 預測值 | 349億美元 |
| 複合年成長率 | 2.8% |
預計到2035年,脈衝式燃氣渦輪機市場規模將達到50億美元,主要得益於市場對適用於工業和公用事業應用的緊湊型、高效率、低維護成本燃氣渦輪機的需求。由於其在高壓環境下的卓越性能以及對自備電廠和製程工業的適用性,脈衝式燃氣渦輪機的應用正在不斷成長。
2025年,裝置容量大於3兆瓦至100兆瓦的電力市場創造了39億美元的收入。此容量範圍支援中型工業設施、生質能和垃圾焚化發電廠以及區域供熱系統。它兼顧了效率、靈活性和成本,有助於自備電力基礎設施的現代化,並確保在各種應用情境下都能獲得可靠的能源輸出。
預計到 2035 年,北美蒸汽渦輪機市場規模將達到 9 億美元。生質能和地熱能發電廠對蒸汽渦輪機的日益普及,以及政府支持提高效率、升級改造和控制排放的計劃,將進一步推動該地區市場的成長。
目錄
第1章:方法論與範圍
第2章:執行概要
第3章:行業洞察
- 產業生態系分析
- 原物料供應及採購分析
- 製造能力評估
- 供應鏈韌性與風險因素
- 配電網路分析
- 監管環境
- 產業影響因素
- 成長促進因素
- 產業陷阱與挑戰
- 成長潛力分析
- 波特的分析
- PESTEL 分析
- 蒸汽渦輪機成本結構分析
- 價格趨勢分析(美元/兆瓦)
- 按地區
- 按產能
- 新興機會與趨勢
- 投資分析與工業4.0整合
第4章:競爭格局
- 介紹
- 按地區分類的公司市佔率分析
- 北美洲
- 歐洲
- 亞太地區
- 中東和非洲
- 拉丁美洲
- 戰略儀錶板
- 策略舉措
- 重要夥伴關係與合作
- 主要併購活動
- 產品創新與發布
- 市場擴張策略
- 競爭性標竿分析
- 創新與永續發展格局
第5章:市場規模及預測:依設計類型分類,2022-2035年
- 反應
- 衝動
第6章:市場規模及預測:依廢氣排放類型分類,2022-2035年
- 冷凝
- 非冷凝式
第7章:市場規模及預測:依燃料類型分類,2022-2035年
- 化石燃料
- 生質能
- 地熱
第8章:市場規模及預測:依最終用途分類,2022-2035年
- 工業的
- 煉油廠
- 化工廠
- 糖廠
- 紙漿和造紙
- 其他
- 公用事業
第9章:市場規模及預測:依產能分類,2022-2035年
- ≤ 3 兆瓦
- 3兆瓦 - 100兆瓦
- 大於 100 兆瓦
第10章:市場規模及預測:依技術分類,2022-2035年
- 蒸汽循環
- 複合循環
- 熱電聯產
第11章:市場規模及預測:依地區分類,2022-2035年
- 北美洲
- 美國
- 加拿大
- 墨西哥
- 歐洲
- 英國
- 法國
- 俄羅斯
- 德國
- 西班牙
- 義大利
- 亞太地區
- 中國
- 日本
- 韓國
- 印度
- 澳洲
- 印尼
- 馬來西亞
- 泰國
- 中東和非洲
- 沙烏地阿拉伯
- 阿拉伯聯合大公國
- 伊朗
- 埃及
- 南非
- 奈及利亞
- 土耳其
- 摩洛哥
- 拉丁美洲
- 巴西
- 阿根廷
- 智利
第12章:公司簡介
- Ansaldo Energia
- Bharat Heavy Electricals Limited
- Chart Industries
- Dongfang Turbine
- Doosan Skoda Power
- EBARA CORPORATION
- Fuji Electric
- GE Vernova
- Hangzhou Turbine Power Group
- Kawasaki Heavy Industries
- MAN Energy Solutions
- Mitsubishi Heavy Industries
- NCON Turbo Tech
- Shin Nippon Machinery
- Siemens Energy
- Sumitomo Heavy Industries
- Toshiba Energy Systems & Solutions
- Trillium Flow Technologies
- Triveni Turbine
- Turbotech Precision Engineering
The Global Steam Turbine Market was valued at USD 26.2 billion in 2025 and is estimated to grow at a CAGR of 2.8% to reach USD 34.9 billion by 2035.
The market's expansion is driven by rising demand for reliable and efficient electricity alongside the construction of new power plants and the modernization of existing energy infrastructure. Steam turbines convert high-pressure steam into rotational mechanical energy, making them integral to industrial power generation. Increasing industrial electricity requirements, widespread adoption of combined heat and power systems, and integration of advanced control technologies are encouraging new turbine installations. The growing need for high-capacity units to support large-scale power generation further reinforces market growth. Industrialization, expansion of heavy manufacturing, and cogeneration integration continue to shape demand patterns. Energy transition policies are influencing deployment, with renewable applications like biomass and geothermal projects offering opportunities for turbines due to their high thermal efficiency and reliability. Sectors such as chemicals, petrochemicals, refineries, and district heating increasingly depend on turbines for efficient power and heat management.
| Market Scope | |
|---|---|
| Start Year | 2025 |
| Forecast Year | 2026-2035 |
| Start Value | $26.2 Billion |
| Forecast Value | $34.9 Billion |
| CAGR | 2.8% |
The impulse segment is expected to reach USD 5 billion by 2035, driven by demand for compact, high-efficiency, and low-maintenance turbines suited for industrial and utility applications. Its adoption is rising due to robust performance in high-pressure environments and suitability for captive power and process industries.
The >3 MW-100 MW segment generated USD 3.9 billion in 2025. This capacity range supports medium-scale industrial facilities, biomass and waste-to-energy plants, and district heating systems. It balances efficiency, flexibility, and cost, aiding the modernization of captive power infrastructure and ensuring reliable energy output across varied applications.
North America Steam Turbine Market is projected to reach USD 900 million by 2035. Growing adoption in biomass and geothermal plants, along with government programs supporting efficiency improvements, upgrades, and emissions control, will further drive the region's market growth.
Key players in the Global Steam Turbine Market include Siemens Energy, Mitsubishi Heavy Industries, Fuji Electric, Bharat Heavy Electricals Limited, Sumitomo Heavy Industries, Kawasaki Heavy Industries, Triveni Turbine, GE Vernova, Dongfang Turbine, ANSALDO Energia, Doosan Skoda Power, Hangzhou Turbine Power Group, Shin Nippon Machinery, Trillium Flow Technologies, NCON Turbo Tech, Ebara Corporation, Turbotech Precision Engineering, Chart Industries, and Toshiba Energy Systems & Solutions. Companies in the Global Steam Turbine Market are strengthening their position by investing in research and development to enhance the efficiency, reliability, and emissions performance of turbines. Strategic collaborations with power plant operators and technology providers enable deployment in renewable and hybrid energy projects. Firms are also focusing on digitalization, predictive maintenance, and smart control systems to optimize operations.
Table of Contents
Chapter 1 Methodology & Scope
- 1.1 Research design
- 1.1.1 Research approach
- 1.1.2 Data collection methods
- 1.2 Base estimates and calculations
- 1.2.1 Base year calculation
- 1.2.2 Market estimates & forecast parameters
- 1.3 Forecast
- 1.3.1 Key trends for market estimates
- 1.3.2 Quantified market impact analysis
- 1.3.2.1 Mathematical impact of growth parameters on forecast
- 1.3.3 Scenario analysis framework
- 1.4 Primary research and validation
- 1.4.1 Some of the primary sources (but not limited to)
- 1.5 Data mining sources
- 1.5.1 Paid Sources
- 1.5.2 Sources, by region
- 1.6 Research trail & scoring components
- 1.6.1 Research trail components
- 1.6.2 Scoring components
- 1.7 Research transparency addendum
- 1.7.1 Source attribution framework
- 1.7.2 Quality assurance metrics
- 1.7.3 Our commitment to trust
- 1.8 Market definitions
Chapter 2 Executive Summary
- 2.1 Industry synopsis, 2022 - 2035
- 2.1.1 Business trends
- 2.1.2 Design trends
- 2.1.3 Exhaust trends
- 2.1.4 Fuel trends
- 2.1.5 End use trends
- 2.1.6 Capacity trends
- 2.1.7 Technology trends
- 2.1.8 Regional trends
Chapter 3 Industry Insights
- 3.1 Industry ecosystem analysis
- 3.1.1 Raw material availability & sourcing analysis
- 3.1.2 Manufacturing capacity assessment
- 3.1.3 Supply chain resilience & risk factors
- 3.1.4 Distribution network analysis
- 3.2 Regulatory landscape
- 3.3 Industry impact forces
- 3.3.1 Growth drivers
- 3.3.2 Industry pitfalls & challenges
- 3.4 Growth potential analysis
- 3.5 Porter's analysis
- 3.5.1 Bargaining power of suppliers
- 3.5.2 Bargaining power of buyers
- 3.5.3 Threat of new entrants
- 3.5.4 Threat of substitutes
- 3.6 PESTEL analysis
- 3.6.1 Political factors
- 3.6.2 Economic factors
- 3.6.3 Social factors
- 3.6.4 Technological factors
- 3.6.5 Legal factors
- 3.6.6 Environmental factors
- 3.7 Cost structure analysis of steam turbine
- 3.8 Price trend analysis (USD/MW)
- 3.8.1 By region
- 3.8.2 By capacity
- 3.9 Emerging opportunities & trends
- 3.10 Investment analysis & industry 4.0 integration
Chapter 4 Competitive Landscape, 2025
- 4.1 Introduction
- 4.2 Company market share analysis, by region, 2025
- 4.2.1 North America
- 4.2.2 Europe
- 4.2.3 Asia Pacific
- 4.2.4 Middle East & Africa
- 4.2.5 Latin America
- 4.3 Strategic dashboard
- 4.4 Strategic initiatives
- 4.4.1 Key partnerships & collaborations
- 4.4.2 Major M&A activities
- 4.4.3 Product innovations & launches
- 4.4.4 Market expansion strategies
- 4.5 Competitive benchmarking
- 4.6 Innovation & sustainability landscape
Chapter 5 Market Size and Forecast, By Design, 2022 - 2035 (USD Million & MW)
- 5.1 Key trends
- 5.2 Reaction
- 5.3 Impulse
Chapter 6 Market Size and Forecast, By Exhaust, 2022 - 2035 (USD Million & MW)
- 6.1 Key trends
- 6.2 Condensing
- 6.3 Non-condensing
Chapter 7 Market Size and Forecast, By Fuel, 2022 - 2035 (USD Million & MW)
- 7.1 Key trends
- 7.2 Fossil fuel
- 7.3 Biomass
- 7.4 Geothermal
Chapter 8 Market Size and Forecast, By End Use, 2022 - 2035 (USD Million & MW)
- 8.1 Key trends
- 8.2 Industrial
- 8.2.1 Refinery
- 8.2.2 Chemical plant
- 8.2.3 Sugar plant
- 8.2.4 Pulp & paper
- 8.2.5 Others
- 8.3 Utility
Chapter 9 Market Size and Forecast, By Capacity, 2022 - 2035 (USD Million & MW)
- 9.1 Key trends
- 9.2 ≤ 3 MW
- 9.3 > 3 MW - 100 MW
- 9.4 > 100 MW
Chapter 10 Market Size and Forecast, By Technology, 2022 - 2035 (USD Million & MW)
- 10.1 Key trends
- 10.2 Steam cycle
- 10.3 Combined cycle
- 10.4 Cogeneration
Chapter 11 Market Size and Forecast, By Region, 2022 - 2035 (USD Million & MW)
- 11.1 Key trends
- 11.2 North America
- 11.2.1 U.S.
- 11.2.2 Canada
- 11.2.3 Mexico
- 11.3 Europe
- 11.3.1 UK
- 11.3.2 France
- 11.3.3 Russia
- 11.3.4 Germany
- 11.3.5 Spain
- 11.3.6 Italy
- 11.4 Asia Pacific
- 11.4.1 China
- 11.4.2 Japan
- 11.4.3 South Korea
- 11.4.4 India
- 11.4.5 Australia
- 11.4.6 Indonesia
- 11.4.7 Malaysia
- 11.4.8 Thailand
- 11.5 Middle East & Africa
- 11.5.1 Saudi Arabia
- 11.5.2 UAE
- 11.5.3 Iran
- 11.5.4 Egypt
- 11.5.5 South Africa
- 11.5.6 Nigeria
- 11.5.7 Turkey
- 11.5.8 Morocco
- 11.6 Latin America
- 11.6.1 Brazil
- 11.6.2 Argentina
- 11.6.3 Chile
Chapter 12 Company Profiles
- 12.1 Ansaldo Energia
- 12.2 Bharat Heavy Electricals Limited
- 12.3 Chart Industries
- 12.4 Dongfang Turbine
- 12.5 Doosan Skoda Power
- 12.6 EBARA CORPORATION
- 12.7 Fuji Electric
- 12.8 GE Vernova
- 12.9 Hangzhou Turbine Power Group
- 12.10 Kawasaki Heavy Industries
- 12.11 MAN Energy Solutions
- 12.12 Mitsubishi Heavy Industries
- 12.13 NCON Turbo Tech
- 12.14 Shin Nippon Machinery
- 12.15 Siemens Energy
- 12.16 Sumitomo Heavy Industries
- 12.17 Toshiba Energy Systems & Solutions
- 12.18 Trillium Flow Technologies
- 12.19 Triveni Turbine
- 12.20 Turbotech Precision Engineering
 工業蒸氣渦輪市場:依燃料類型、配置、運轉模式及應用分類-2026-2032年全球市場預測
 多級蒸氣渦輪(高達 5000kW)市場規模、佔有率、成長和全球產業分析:按類型、應用和地區分類的見解,以及 2026-2034 年的預測。蒸氣渦輪市場:按類型、級數和應用分類-2026-2032年全球預測
 2026年全球蒸氣渦輪售後市場報告
 蒸汽輪機工業蒸氣加濕器市場按產品類型、最終用戶產業、工作壓力、安裝方式和分銷管道分類,全球預測(2026-2032年)工業電阻式蒸氣加濕器市場:依終端用戶產業、容量範圍、控制方式、通路和維護類型分類,全球預測(2026-2032年)全球蒸氣渦輪服務市場規模、佔有率、趨勢和成長分析報告(2026-2034年)2026年全球蒸氣渦輪市場報告
 全球蒸汽渦輪機市場:依技術、設計、排氣系統、應用、燃料和地區劃分-市場規模、產業動態、機會分析和預測(2026-2035 年)